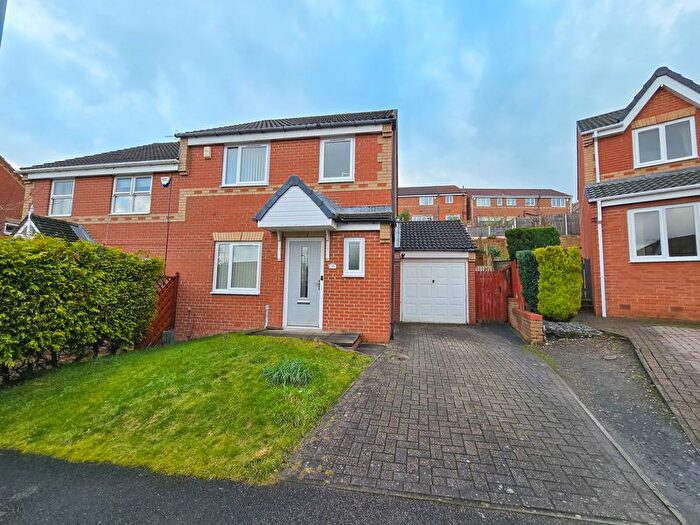
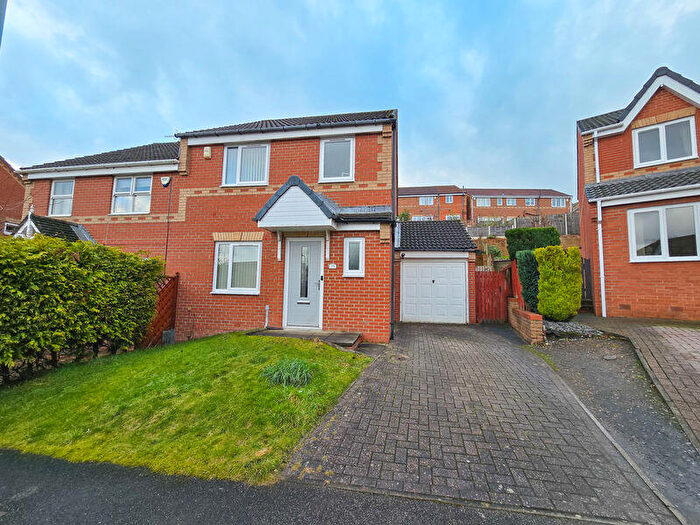
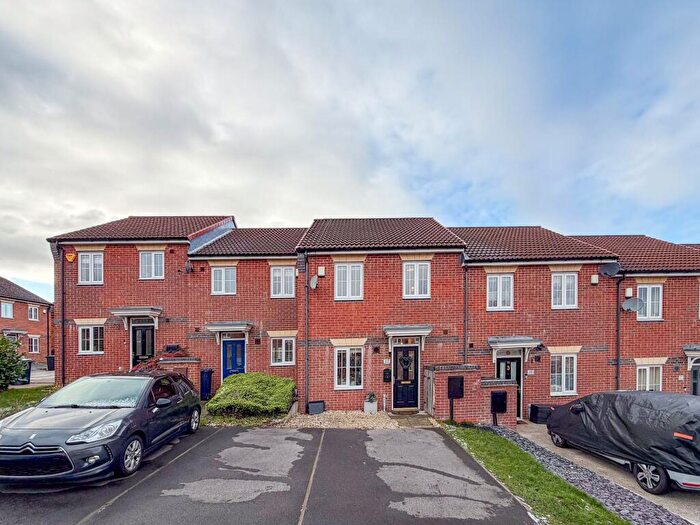
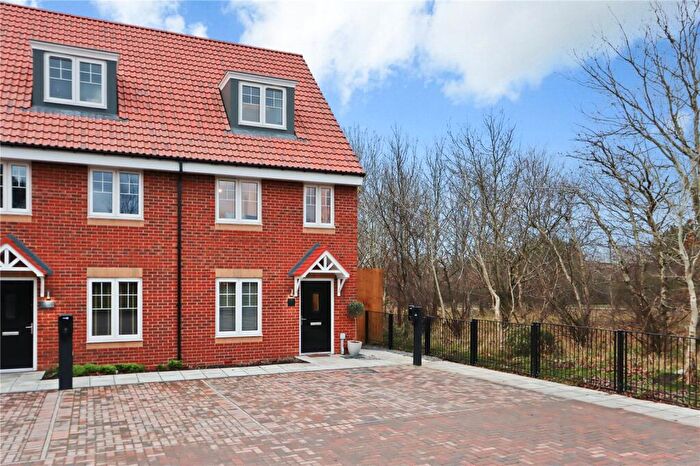
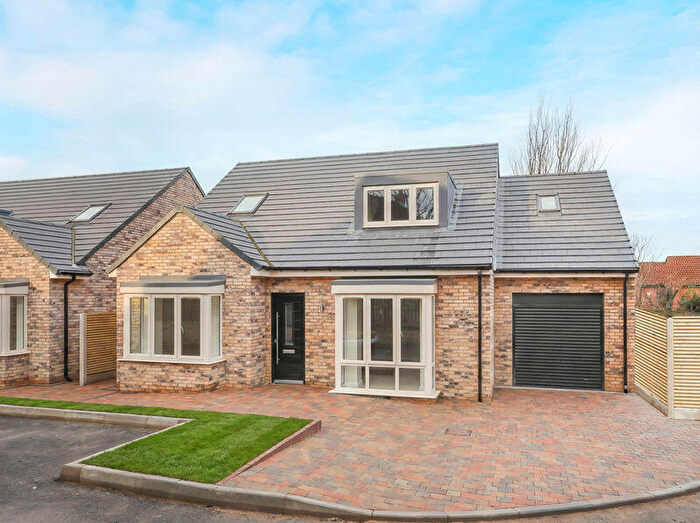
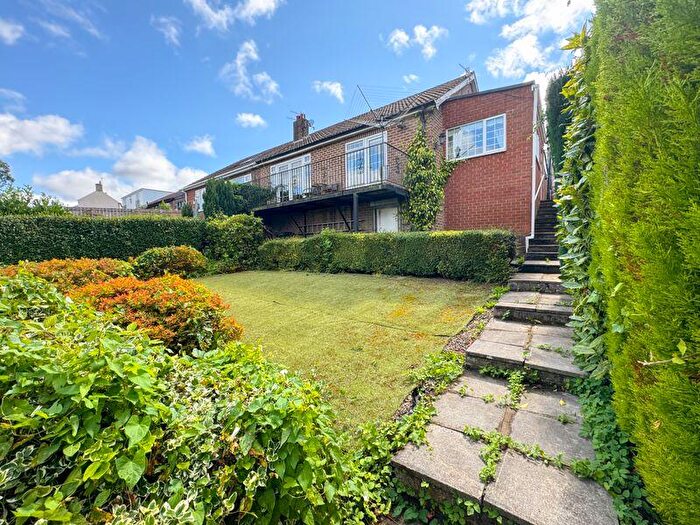
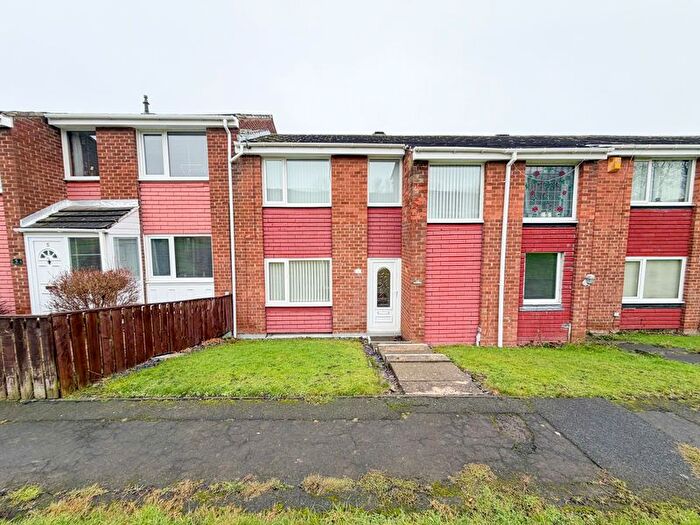
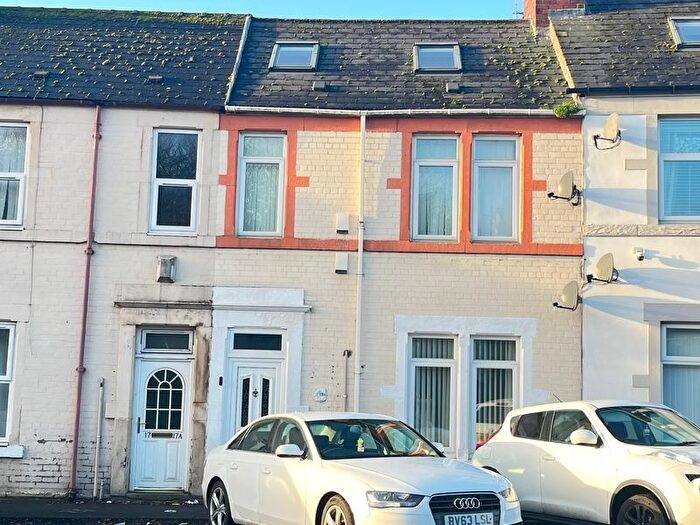
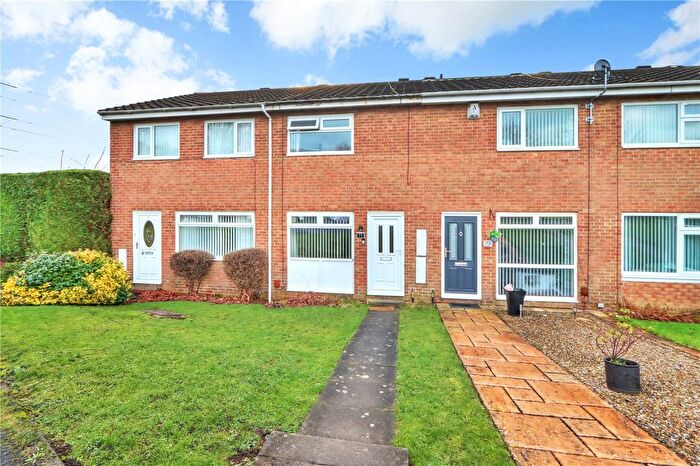
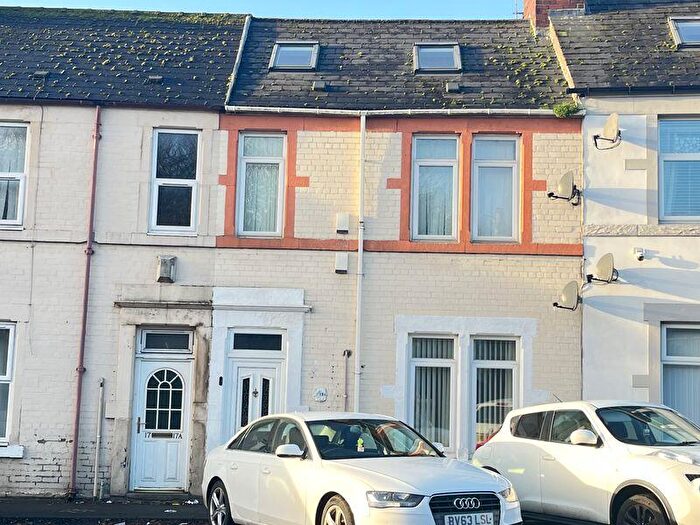
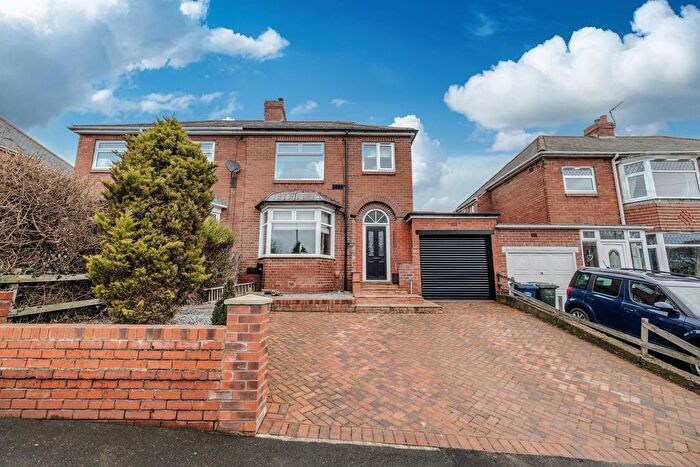
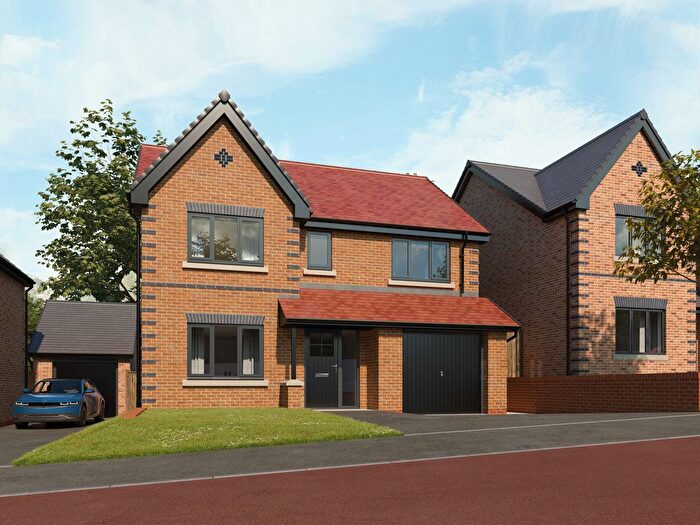
Houses for sale & to rent in Winlaton And High Spen, Blaydon-on-tyne
House Prices in Winlaton And High Spen
Properties in Winlaton And High Spen have an average house price of £170,761.00 and had 294 Property Transactions within the last 3 years¹.
Winlaton And High Spen is an area in Blaydon-on-tyne, Gateshead with 2,750 households², where the most expensive property was sold for £910,000.00.
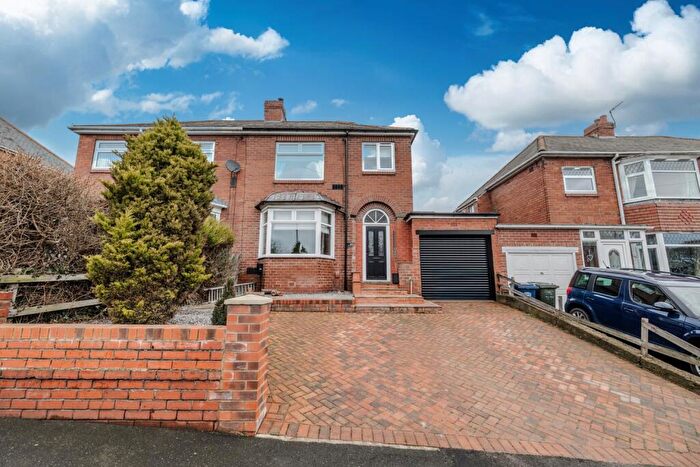
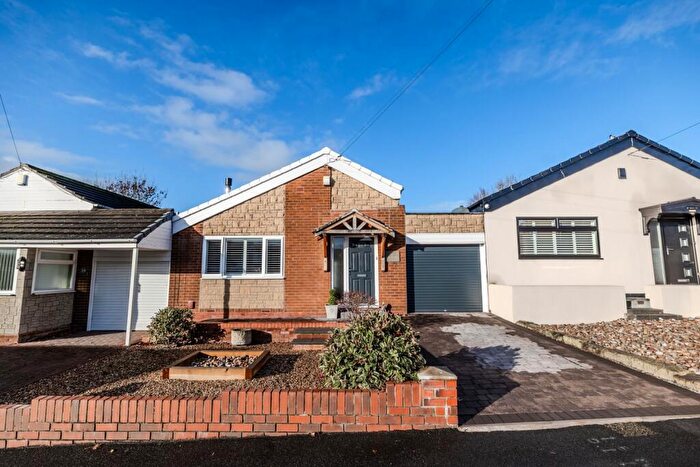
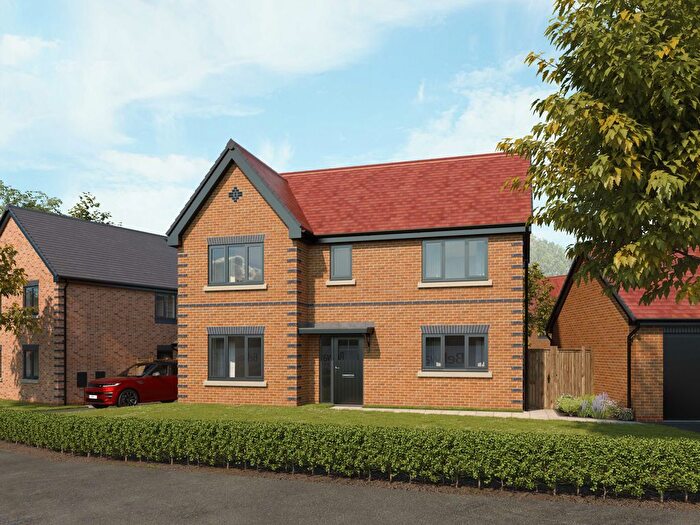
Properties for sale in Winlaton And High Spen
Roads and Postcodes in Winlaton And High Spen
Navigate through our locations to find the location of your next house in Winlaton And High Spen, Blaydon-on-tyne for sale or to rent.
| Streets | Postcodes |
|---|---|
| Ambrose Court | NE21 6PF |
| Axwell View | NE21 6NF |
| Back Street | NE21 6AH |
| Barlow Fell Road | NE21 6JQ |
| Barlow Lane | NE21 6EE NE21 6EZ |
| Barlow Road | NE21 6JT NE21 6JU |
| Barlowfield Close | NE21 6EY |
| Beadnell Close | NE21 6HP |
| Beaumont Court | NE21 6BF |
| Beverley Drive | NE21 6HE NE21 6HF NE21 6HG NE21 6HQ |
| Beweshill Crescent | NE21 6BW |
| Birchgate Close | NE21 6BS |
| Borrowdale Crescent | NE21 6QA |
| Brandon Close | NE21 6PN |
| Brinkburn Close | NE21 6HW |
| Brockwell Close | NE21 6BJ |
| Broom Close | NE21 6QR NE21 6QS |
| Burn Road | NE21 6EA NE21 6EB NE21 6JR |
| Burnt House Close | NE21 6ET |
| Buttermere Crescent | NE21 6PX |
| Caledonia | NE21 6AX |
| California | NE21 6LZ |
| Church Street | NE21 6AW NE21 6AP NE21 6AS |
| Clover Avenue | NE21 6RZ |
| Coldstream Drive | NE21 6PP NE21 6PR |
| Conifer Close | NE21 6QT NE21 6QU |
| Coniston Crescent | NE21 6PY |
| Cowen Street | NE21 6PG |
| Cresswell Close | NE21 6HN |
| Cromwell Place | NE21 6DB |
| Daryl Close | NE21 6ER |
| Denham Grove | NE21 6HR |
| Derwent View | NE21 6LP NE21 6LR NE21 6LW |
| Derwent View Close | NE21 6BR |
| Ennerdale Crescent | NE21 6PS |
| Fairfield Place | NE21 5QF |
| Farndale Close | NE21 6HH |
| Front Street | NE21 4RF NE21 6AB NE21 6AD NE21 6AF NE21 4RD NE21 4RE NE21 6AE NE21 6AG NE21 6DU |
| Garth Crescent | NE21 6DG |
| Garth Farm Road | NE21 6DF |
| Gibside View | NE21 6LJ NE21 6LL NE21 6LN |
| Glendale Close | NE21 6HD |
| Grasmere Crescent | NE21 6QF |
| Greenwell Close | NE21 6BE |
| Half Fields Close | NE21 5AQ |
| Half Fields Road | NE21 5RP NE21 5RR NE21 5RW |
| Hallgarth Mews | NE21 6DJ |
| Hanover Drive | NE21 6BA NE21 6BB NE21 6BD NE21 6BL |
| Hanover Walk | NE21 6ES |
| Hartside Crescent | NE21 6HL |
| Hawesdale Crescent | NE21 6QB |
| Herd Close | NE21 6EG |
| Hill Top | NE21 6DQ |
| Holly Avenue | NE21 6SJ NE21 6SL |
| Hood Square | NE21 6AY |
| Huntley Crescent | NE21 6EU NE21 6EX |
| June Avenue | NE21 6SQ |
| Kirkham Court | NE21 6AZ |
| Knowledge Hill | NE21 6AL |
| Landswood Terrace | NE21 6RX |
| Langdale Crescent | NE21 6PU |
| Litchfield Crescent | NE21 5QP |
| Litchfield Lane | NE21 5QW |
| Litchfield Terrace | NE21 5QS |
| Long Gair | NE21 6QY NE21 6QZ NE21 6RA |
| Lyndhurst Close | NE21 6PW |
| Manor Terrace | NE21 6BZ NE21 6SE |
| May Avenue | NE21 6SF |
| Meadow Close | NE21 6ED |
| Meldon Way | NE21 6HJ |
| Mill Lane | NE21 6RY |
| Millwood Green | NE21 6AU |
| Milner Crescent | NE21 6BN |
| Mount Pleasant | NE21 5RB |
| Mundle Avenue | NE21 6SG |
| Naylor Avenue | NE21 6SA |
| Newbank Walk | NE21 6BQ |
| Nixon Terrace | NE21 5QR |
| Noel Avenue | NE21 6SH |
| Noel Terrace | NE21 6SD |
| North Street | NE21 6BX NE21 6BY NE21 6BT |
| Old Well Avenue | NE21 5RA |
| Old Well Lane | NE21 5QY NE21 5QZ |
| Ottovale Crescent | NE21 6BG |
| Owlet Close | NE21 6BH |
| Park Lane | NE21 6LT NE21 6LU NE21 6AT |
| Park View | NE21 6NH NE21 6NJ |
| Parkgate Lane | NE21 6ND NE21 6QG NE21 6QH NE21 6QQ |
| Parkhead Gardens | NE21 6NN NE21 6NP NE21 6NW |
| Parkhead Square | NE21 6NR |
| Parkland Avenue | NE21 6NA NE21 6NB NE21 6LS |
| Rectory Lane | NE21 5RN NE21 6PJ |
| Redesdale Avenue | NE21 6HS |
| Riding Lea | NE21 6BP |
| Roxburgh Close | NE21 6QJ |
| Rydal Crescent | NE21 6QD |
| Sandhill Mews | NE21 5SF |
| Scotland Court | NE21 6DH |
| Scotland Head | NE21 6PL |
| Silverdale Drive | NE21 6EH NE21 6EN NE21 6EQ NE21 6EJ |
| Spa Well Close | NE21 6LX |
| Spa Well Road | NE21 6RT NE21 6RU |
| St Annes Close | NE21 5RL |
| Stampley Close | NE21 6EW |
| Stephenson Way | NE21 6QN NE21 6QP NE21 6QW |
| The Close | NE21 6HA |
| The Crescent | NE21 6JX |
| The Garth | NE21 6DD |
| Thirlmere Crescent | NE21 6PT |
| Ullswater Crescent | NE21 6QL |
| Warrens Walk | NE21 6EF |
| Wasdale Crescent | NE21 6PZ |
| Waverley Close | NE21 6HB |
| West Lane | NE21 6PQ NE21 6PH |
| Whinney Close | NE21 6QX |
| Windermere Crescent | NE21 6QE |
| Woodburn Close | NE21 6EL |
| Woodlands Way | NE21 6LG |
| NE21 6LD NE17 7AP NE21 6AA NE21 6HT NE21 6JS NE21 6LA NE21 6LB NE21 6LE |
Transport near Winlaton And High Spen
- FAQ
- Price Paid By Year
- Property Type Price
Frequently asked questions about Winlaton And High Spen
What is the average price for a property for sale in Winlaton And High Spen?
The average price for a property for sale in Winlaton And High Spen is £170,761. This amount is 4% higher than the average price in Blaydon-on-tyne. There are 3,604 property listings for sale in Winlaton And High Spen.
What streets have the most expensive properties for sale in Winlaton And High Spen?
The streets with the most expensive properties for sale in Winlaton And High Spen are Barlow Road at an average of £467,400, Woodlands Way at an average of £456,000 and Spa Well Road at an average of £425,000.
What streets have the most affordable properties for sale in Winlaton And High Spen?
The streets with the most affordable properties for sale in Winlaton And High Spen are Scotland Court at an average of £41,333, Thirlmere Crescent at an average of £70,000 and Fairfield Place at an average of £70,500.
Which train stations are available in or near Winlaton And High Spen?
Some of the train stations available in or near Winlaton And High Spen are Blaydon, MetroCentre and Dunston.
Property Price Paid in Winlaton And High Spen by Year
The average sold property price by year was:
| Year | Average Sold Price | Price Change |
Sold Properties
|
|---|---|---|---|
| 2025 | £161,429 | -6% |
51 Properties |
| 2024 | £171,195 | -1% |
88 Properties |
| 2023 | £172,918 | -1% |
66 Properties |
| 2022 | £174,080 | 10% |
89 Properties |
| 2021 | £156,345 | 4% |
86 Properties |
| 2020 | £150,320 | 9% |
83 Properties |
| 2019 | £136,330 | -26% |
90 Properties |
| 2018 | £172,379 | 16% |
152 Properties |
| 2017 | £144,494 | 19% |
113 Properties |
| 2016 | £117,522 | -4% |
79 Properties |
| 2015 | £122,363 | 3% |
70 Properties |
| 2014 | £118,438 | 5% |
61 Properties |
| 2013 | £112,481 | 2% |
61 Properties |
| 2012 | £110,479 | -18% |
40 Properties |
| 2011 | £130,576 | -1% |
55 Properties |
| 2010 | £131,446 | 4% |
47 Properties |
| 2009 | £126,825 | -1% |
46 Properties |
| 2008 | £127,535 | -4% |
60 Properties |
| 2007 | £133,273 | 7% |
133 Properties |
| 2006 | £123,519 | 11% |
93 Properties |
| 2005 | £109,702 | 9% |
101 Properties |
| 2004 | £100,047 | 20% |
102 Properties |
| 2003 | £80,494 | 18% |
99 Properties |
| 2002 | £65,704 | 9% |
125 Properties |
| 2001 | £59,971 | 17% |
91 Properties |
| 2000 | £49,898 | -6% |
82 Properties |
| 1999 | £52,949 | 10% |
78 Properties |
| 1998 | £47,912 | 2% |
66 Properties |
| 1997 | £46,804 | 10% |
72 Properties |
| 1996 | £42,268 | 2% |
81 Properties |
| 1995 | £41,527 | - |
77 Properties |
Property Price per Property Type in Winlaton And High Spen
Here you can find historic sold price data in order to help with your property search.
The average Property Paid Price for specific property types in the last three years are:
| Property Type | Average Sold Price | Sold Properties |
|---|---|---|
| Flat | £61,408.00 | 25 Flats |
| Semi Detached House | £169,060.00 | 150 Semi Detached Houses |
| Detached House | £309,826.00 | 45 Detached Houses |
| Terraced House | £126,585.00 | 74 Terraced Houses |

