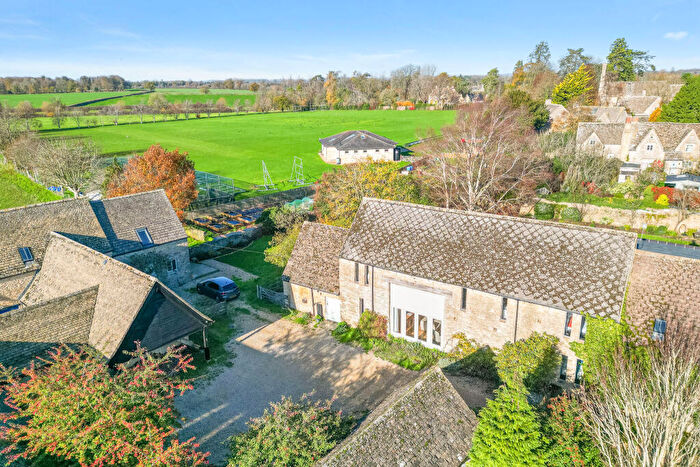
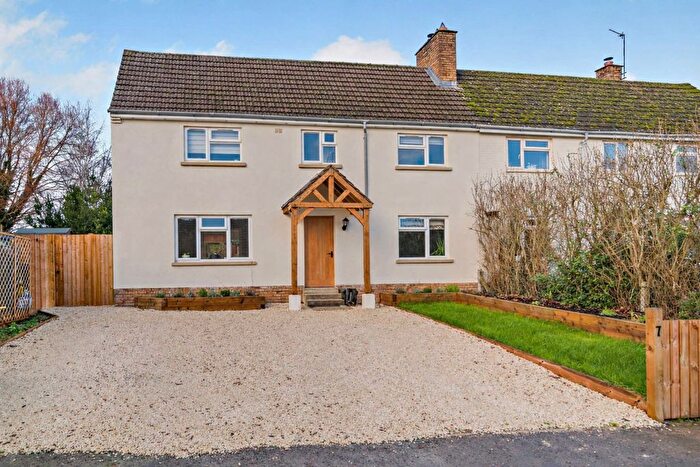
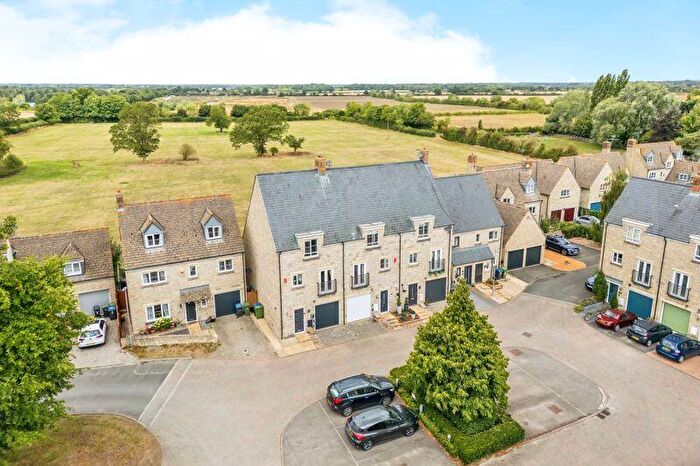
Houses for sale & to rent in Hampton, Cirencester
House Prices in Hampton
Properties in Hampton have an average house price of £778,248.00 and had 58 Property Transactions within the last 3 years¹.
Hampton is an area in Cirencester, Gloucestershire with 620 households², where the most expensive property was sold for £7,250,000.00.
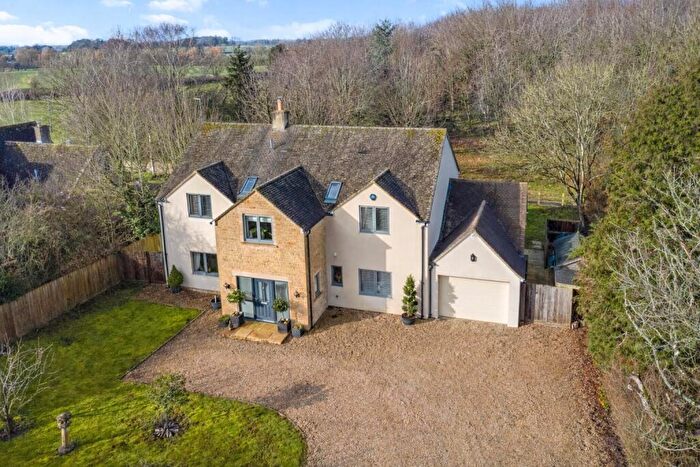
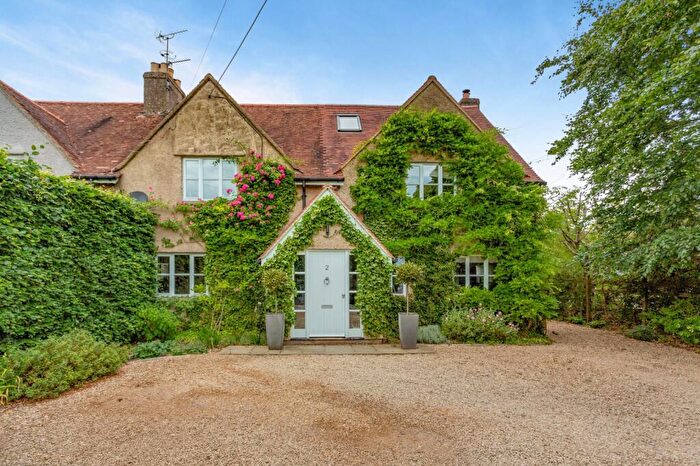
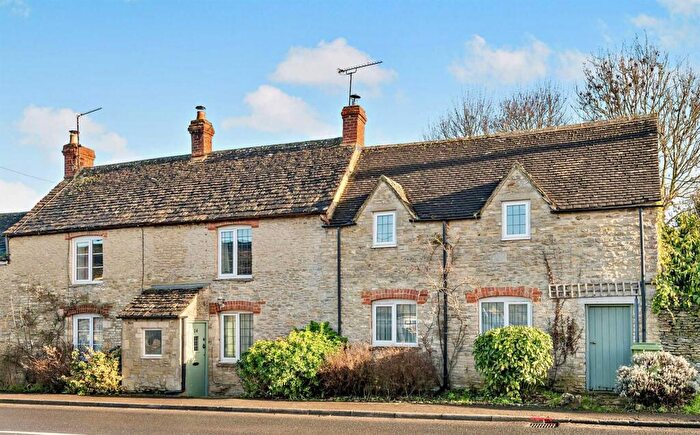
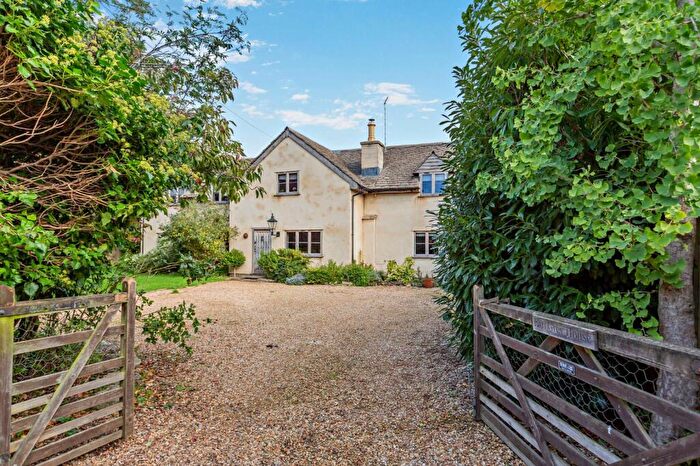
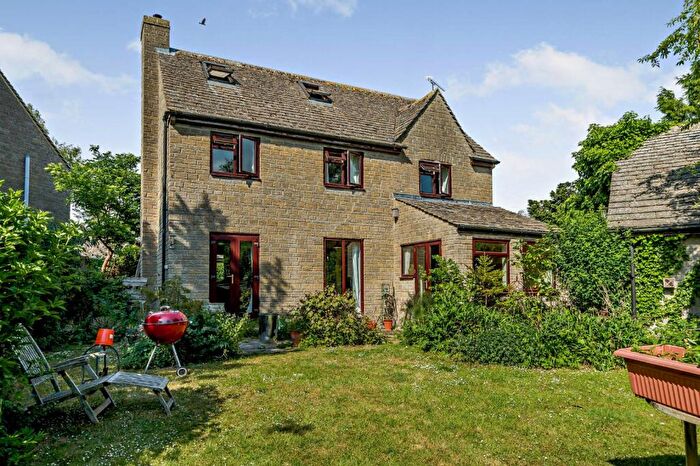
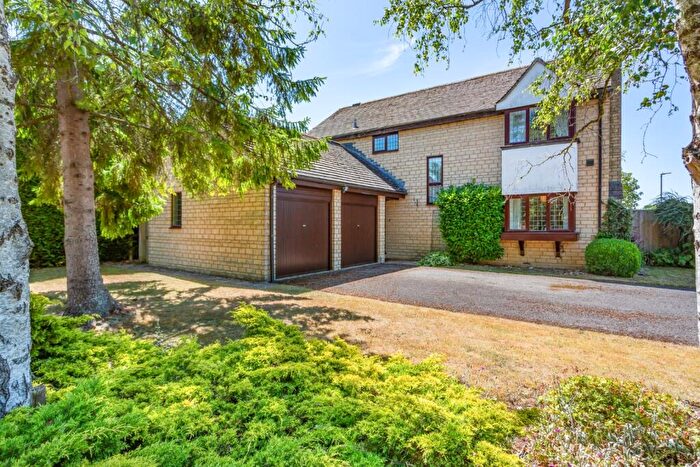
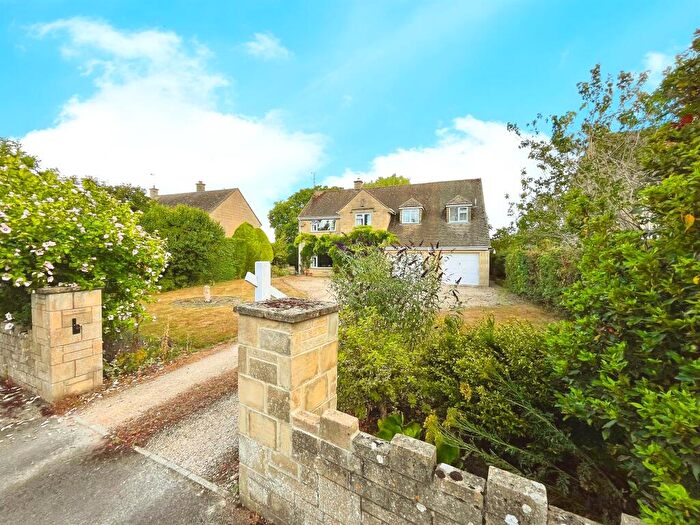
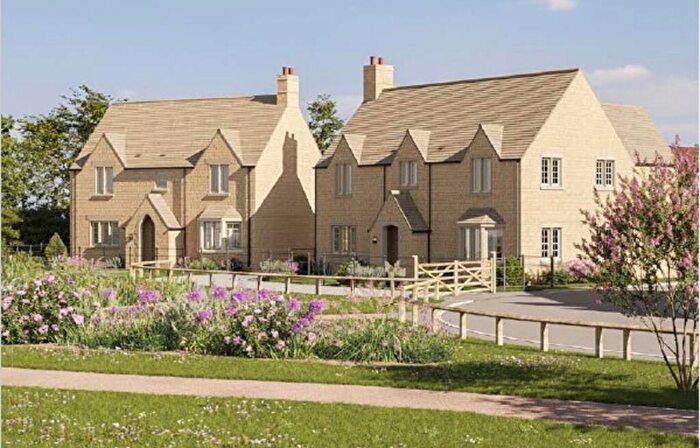
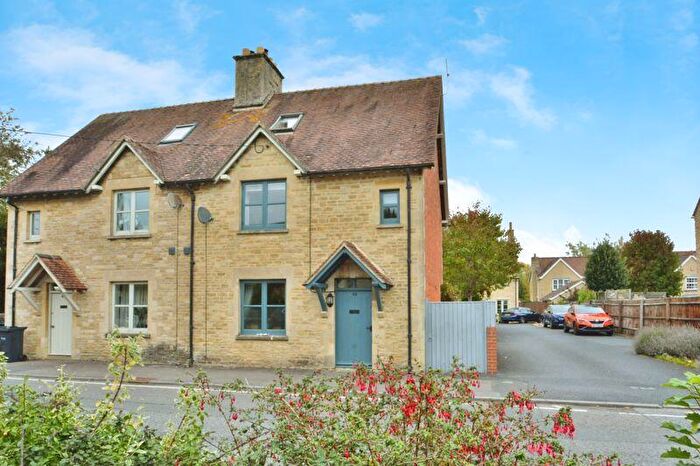
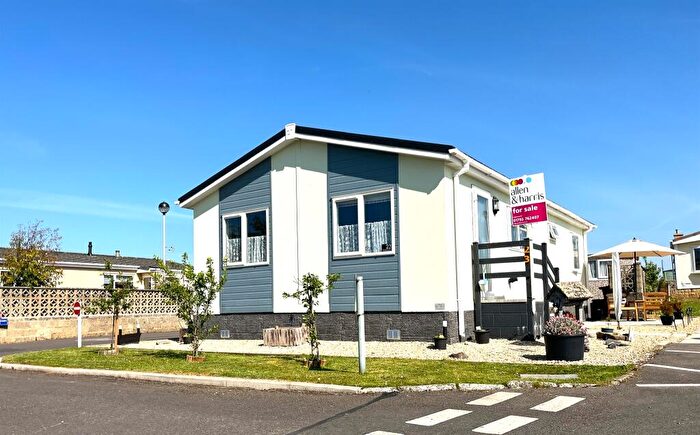
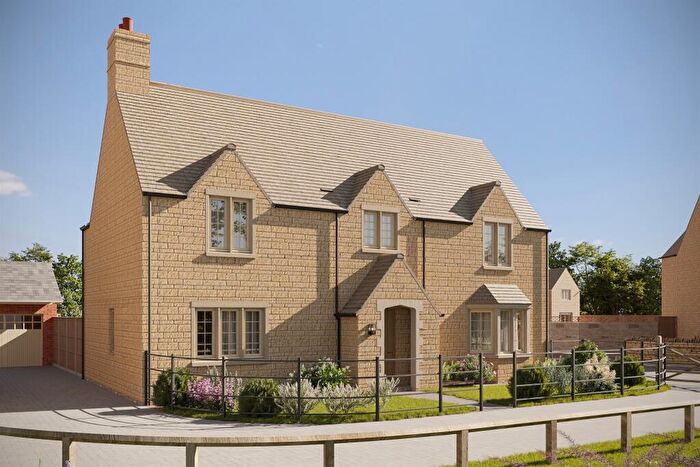
Properties for sale in Hampton
Roads and Postcodes in Hampton
Navigate through our locations to find the location of your next house in Hampton, Cirencester for sale or to rent.
| Streets | Postcodes |
|---|---|
| Ampney Mill Cottages | GL7 5RS |
| Beech Lea | GL7 5JR |
| Bell Lane | GL7 5JF |
| Bettys Grave | GL7 5ST |
| Broadleaze | GL7 5QX |
| Charlham Lane | GL7 5RQ |
| Charlham Way | GL7 5RB |
| Chestnut Close | GL7 5RA |
| Church Street | GL7 5JU |
| Council Houses | GL7 5JQ |
| Cricklade Street | GL7 5HS GL7 5HW GL7 5HX |
| Dawes Close | GL7 5LE |
| Dukes Field | GL7 5PQ |
| Edwards Close | GL7 5HT |
| Elf Meadow | GL7 5HQ |
| Elizabeth Gardens | GL7 5LP |
| Hamilton Croft | GL7 5LS |
| Hampton Grove | GL7 5JN |
| Harnhill | GL7 5PT GL7 5PU |
| High Street | GL7 5JP GL7 5JT GL7 5JW |
| Hill Cottages | GL7 5JA |
| Linden Lea | GL7 5PF |
| London Road | GL7 5JE GL7 5JG GL7 5JJ |
| Meysey Close | GL7 5LL |
| Poulton Fields Cottages | GL7 5SS |
| School Lane | GL7 5JS |
| St Marys Field | GL7 5HE |
| Stoney Pool | GL7 5LR |
| Strawberry Lane | GL7 5HL |
| Suffolk Place | GL7 5QZ |
| The Butts | GL7 5HY |
| The Old Estate Yard | GL7 5BD |
| The Paddocks | GL7 5JX |
| The Pheasantry | GL7 5RE |
| Vicarage Lane | GL7 5HU |
| West View | GL7 5HP |
| GL7 5BQ GL7 5LN GL7 5PY GL7 5PZ GL7 5QA GL7 5QR GL7 5QS GL7 5QU GL7 5QW GL7 5SZ |
Transport near Hampton
-
Kemble Station
-
Swindon Station
-
Stroud Station
-
Shipton Station
-
Ascott-Under-Wychwood Station
-
Kingham Station
-
Cheltenham Spa Station
-
Stonehouse Station
-
Finstock Station
-
Chippenham Station
- FAQ
- Price Paid By Year
- Property Type Price
Frequently asked questions about Hampton
What is the average price for a property for sale in Hampton?
The average price for a property for sale in Hampton is £778,248. This amount is 48% higher than the average price in Cirencester. There are 266 property listings for sale in Hampton.
What streets have the most expensive properties for sale in Hampton?
The streets with the most expensive properties for sale in Hampton are Ampney Mill Cottages at an average of £1,200,000, Cricklade Street at an average of £842,500 and Bell Lane at an average of £828,400.
What streets have the most affordable properties for sale in Hampton?
The streets with the most affordable properties for sale in Hampton are Broadleaze at an average of £291,000, Hamilton Croft at an average of £317,500 and Meysey Close at an average of £386,000.
Which train stations are available in or near Hampton?
Some of the train stations available in or near Hampton are Kemble, Swindon and Stroud.
Property Price Paid in Hampton by Year
The average sold property price by year was:
| Year | Average Sold Price | Price Change |
Sold Properties
|
|---|---|---|---|
| 2025 | £613,058 | -59% |
19 Properties |
| 2024 | £973,725 | 24% |
20 Properties |
| 2023 | £737,673 | 24% |
19 Properties |
| 2022 | £559,273 | -9% |
17 Properties |
| 2021 | £608,475 | -34% |
31 Properties |
| 2020 | £818,281 | 36% |
16 Properties |
| 2019 | £520,361 | 5% |
18 Properties |
| 2018 | £493,442 | -0,1% |
19 Properties |
| 2017 | £494,119 | -2% |
21 Properties |
| 2016 | £505,673 | -22% |
16 Properties |
| 2015 | £617,725 | 26% |
22 Properties |
| 2014 | £457,048 | 5% |
26 Properties |
| 2013 | £434,977 | -19% |
22 Properties |
| 2012 | £518,728 | 28% |
26 Properties |
| 2011 | £373,960 | -19% |
19 Properties |
| 2010 | £445,906 | 7% |
29 Properties |
| 2009 | £412,735 | -10% |
17 Properties |
| 2008 | £455,716 | 14% |
15 Properties |
| 2007 | £390,480 | -1% |
26 Properties |
| 2006 | £395,813 | 8% |
42 Properties |
| 2005 | £365,111 | 10% |
18 Properties |
| 2004 | £327,088 | -2% |
22 Properties |
| 2003 | £334,455 | 3% |
39 Properties |
| 2002 | £325,176 | 16% |
54 Properties |
| 2001 | £273,555 | 21% |
40 Properties |
| 2000 | £217,390 | 12% |
25 Properties |
| 1999 | £191,112 | 7% |
34 Properties |
| 1998 | £177,166 | 13% |
27 Properties |
| 1997 | £153,935 | 16% |
21 Properties |
| 1996 | £128,757 | -10% |
32 Properties |
| 1995 | £141,695 | - |
23 Properties |
Property Price per Property Type in Hampton
Here you can find historic sold price data in order to help with your property search.
The average Property Paid Price for specific property types in the last three years are:
| Property Type | Average Sold Price | Sold Properties |
|---|---|---|
| Semi Detached House | £538,240.00 | 20 Semi Detached Houses |
| Detached House | £937,388.00 | 35 Detached Houses |
| Terraced House | £521,666.00 | 3 Terraced Houses |

