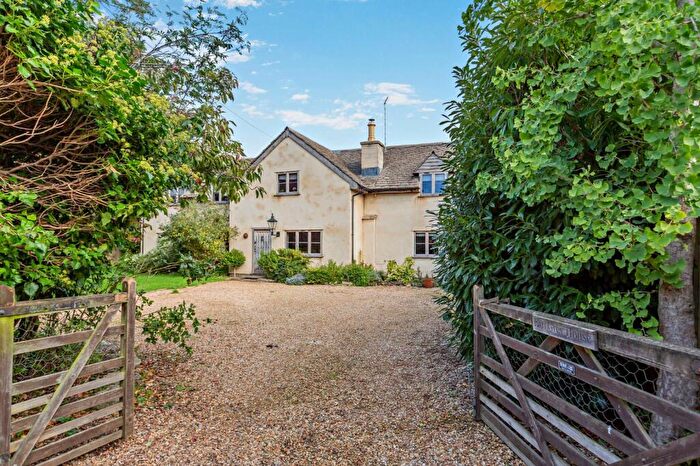
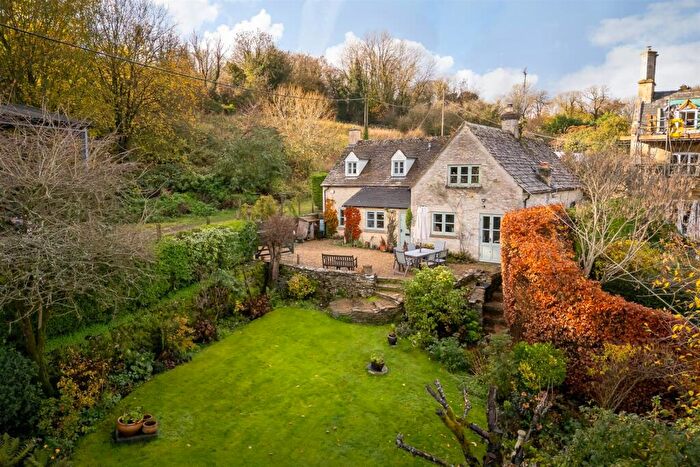
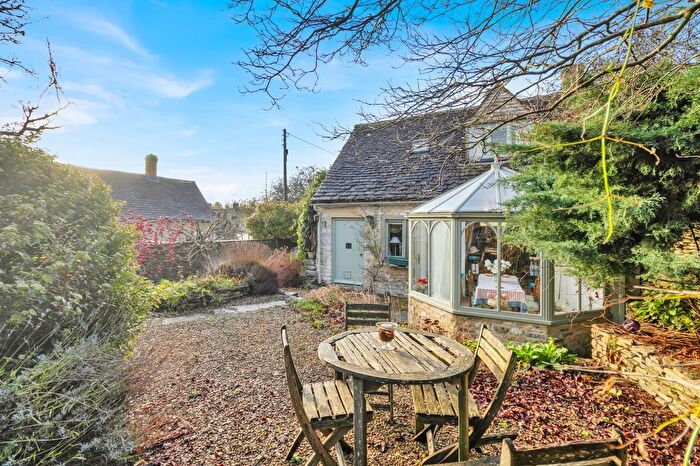
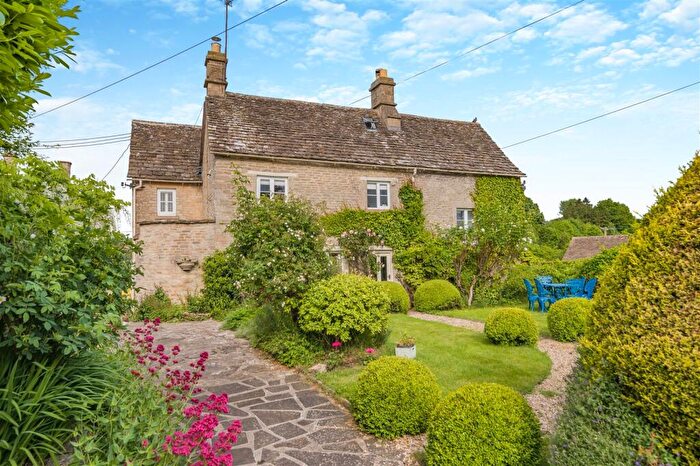
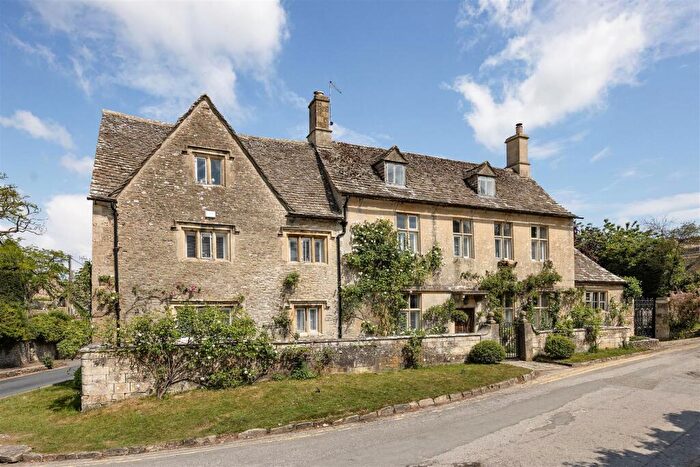
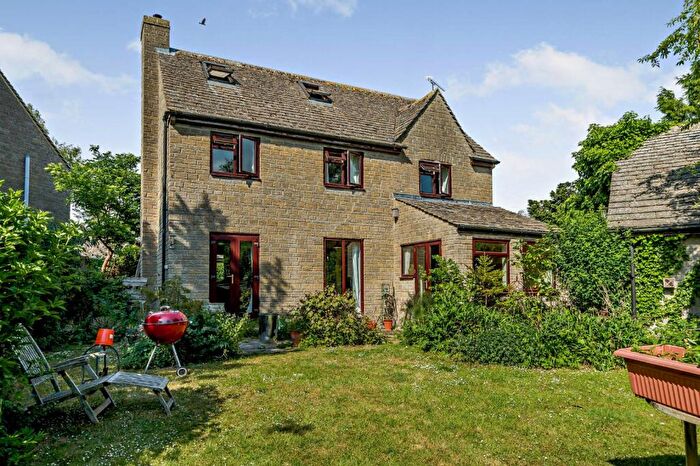
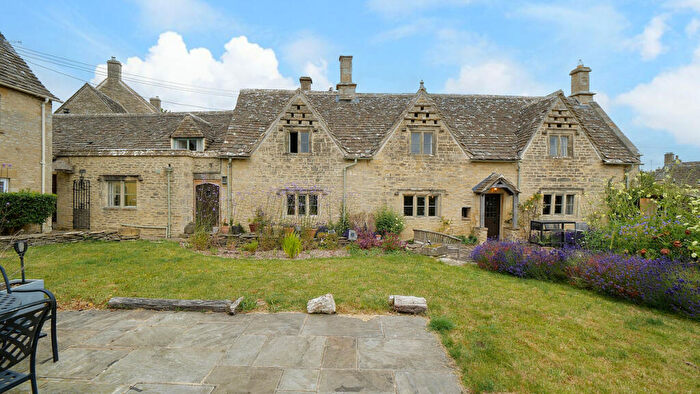
Houses for sale & to rent in Ampney-coln, Cirencester
House Prices in Ampney-coln
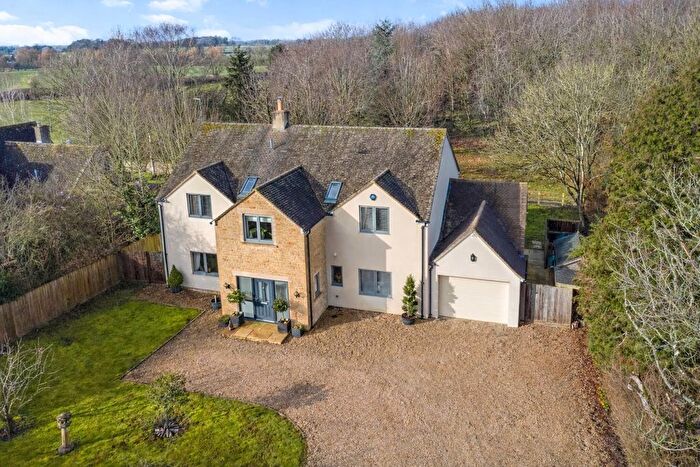
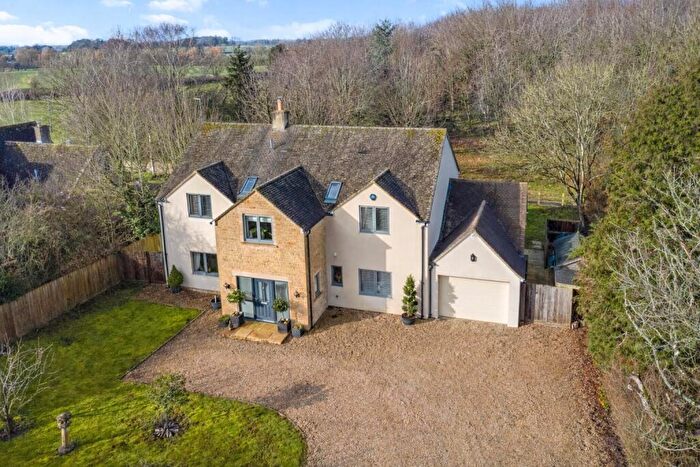
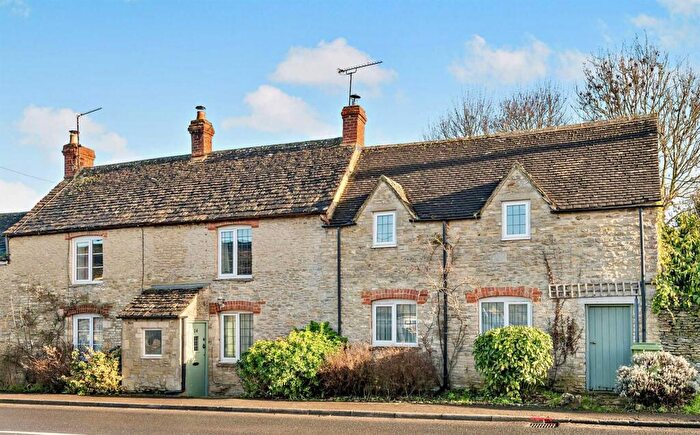
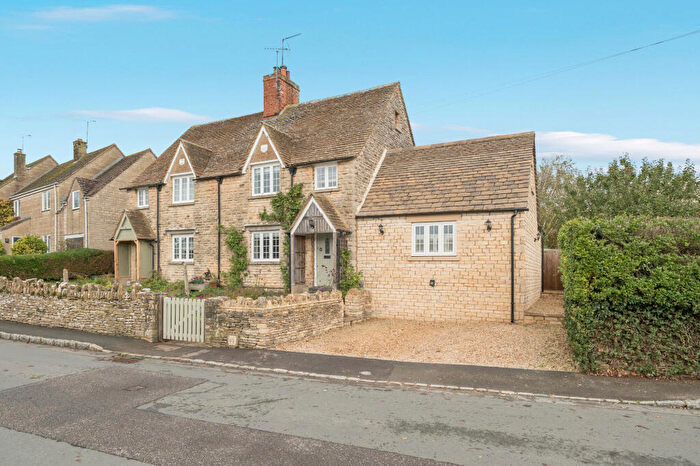
Properties in Ampney-coln have an average house price of £913,135.00 and had 55 Property Transactions within the last 3 years¹.
Ampney-coln is an area in Cirencester, Gloucestershire with 654 households², where the most expensive property was sold for £5,500,000.00.
Properties for sale in Ampney-coln
Roads and Postcodes in Ampney-coln
Navigate through our locations to find the location of your next house in Ampney-coln, Cirencester for sale or to rent.
| Streets | Postcodes |
|---|---|
| Ablington | GL7 5NU GL7 5NX GL7 5NY |
| Aldsworth Road | GL7 5PA |
| Arlington | GL7 5ND GL7 5NG GL7 5NL |
| Arlington Corner | GL7 5NF |
| Arlington Green | GL7 5NE |
| Arlington Pike | GL7 5NB |
| Arlington Row | GL7 5NJ |
| Awkward Hill | GL7 5NH |
| Barnsley Road | GL7 5DX GL7 5DY |
| Church Road | GL7 5NR |
| Donkey Field | GL7 5TD |
| Durncourt | GL7 5SE |
| Hilcot End | GL7 5HG |
| Kilkenny | GL7 5PD |
| London Road | GL7 5HN |
| Sheephouse Lane | GL7 5DZ |
| Stow Road | GL7 5EZ GL7 5HA |
| The Bibury Stud | GL7 5BB |
| The Pike | GL7 5NA |
| The Square | GL7 5NS |
| The Street | GL7 5NP |
| Triangle Cottages | GL7 5SP |
| Waterton Lane | GL7 5RX |
| GL7 5EB GL7 5ED GL7 5EE GL7 5EF GL7 5EJ GL7 5EL GL7 5EN GL7 5ER GL7 5ES GL7 5EW GL7 5LX GL7 5LZ GL7 5NT GL7 5RR GL7 5RU GL7 5RY GL7 5RZ GL7 5SA GL7 5SD GL7 5SF GL7 5SG GL7 5SH GL7 5SJ GL7 5SL GL7 5SN GL7 5SQ GL7 5SR GL7 5SW GL7 5SX |
Transport near Ampney-coln
- FAQ
- Price Paid By Year
- Property Type Price
Frequently asked questions about Ampney-coln
What is the average price for a property for sale in Ampney-coln?
The average price for a property for sale in Ampney-coln is £913,135. This amount is 74% higher than the average price in Cirencester. There are 327 property listings for sale in Ampney-coln.
What streets have the most expensive properties for sale in Ampney-coln?
The streets with the most expensive properties for sale in Ampney-coln are Barnsley Road at an average of £1,000,000, Ablington at an average of £840,000 and Arlington Green at an average of £819,750.
What streets have the most affordable properties for sale in Ampney-coln?
The streets with the most affordable properties for sale in Ampney-coln are The Square at an average of £340,000, Arlington at an average of £388,500 and Arlington Pike at an average of £540,000.
Which train stations are available in or near Ampney-coln?
Some of the train stations available in or near Ampney-coln are Kemble, Swindon and Cheltenham Spa.
Property Price Paid in Ampney-coln by Year
The average sold property price by year was:
| Year | Average Sold Price | Price Change |
Sold Properties
|
|---|---|---|---|
| 2025 | £1,140,500 | 19% |
14 Properties |
| 2024 | £920,639 | 24% |
25 Properties |
| 2023 | £702,468 | -47% |
16 Properties |
| 2022 | £1,034,875 | 27% |
28 Properties |
| 2021 | £755,067 | 1% |
25 Properties |
| 2020 | £747,893 | 28% |
28 Properties |
| 2019 | £535,320 | -59% |
15 Properties |
| 2018 | £852,501 | 13% |
19 Properties |
| 2017 | £738,481 | 6% |
22 Properties |
| 2016 | £694,829 | -62% |
29 Properties |
| 2015 | £1,124,913 | 33% |
23 Properties |
| 2014 | £754,132 | 21% |
29 Properties |
| 2013 | £596,403 | -5% |
16 Properties |
| 2012 | £625,447 | -16% |
19 Properties |
| 2011 | £722,793 | 39% |
18 Properties |
| 2010 | £440,900 | -32% |
15 Properties |
| 2009 | £583,500 | 28% |
21 Properties |
| 2008 | £420,242 | -38% |
23 Properties |
| 2007 | £579,907 | 28% |
27 Properties |
| 2006 | £415,971 | -30% |
28 Properties |
| 2005 | £539,642 | 18% |
21 Properties |
| 2004 | £444,848 | -14% |
34 Properties |
| 2003 | £509,059 | 33% |
37 Properties |
| 2002 | £338,823 | -7% |
34 Properties |
| 2001 | £362,551 | -33% |
28 Properties |
| 2000 | £480,384 | 51% |
29 Properties |
| 1999 | £237,478 | 17% |
36 Properties |
| 1998 | £197,786 | -44% |
27 Properties |
| 1997 | £284,535 | 46% |
21 Properties |
| 1996 | £152,291 | -14% |
29 Properties |
| 1995 | £174,282 | - |
17 Properties |
Property Price per Property Type in Ampney-coln
Here you can find historic sold price data in order to help with your property search.
The average Property Paid Price for specific property types in the last three years are:
| Property Type | Average Sold Price | Sold Properties |
|---|---|---|
| Semi Detached House | £640,000.00 | 10 Semi Detached Houses |
| Detached House | £1,154,234.00 | 34 Detached Houses |
| Terraced House | £436,100.00 | 10 Terraced Houses |
| Flat | £217,500.00 | 1 Flat |

