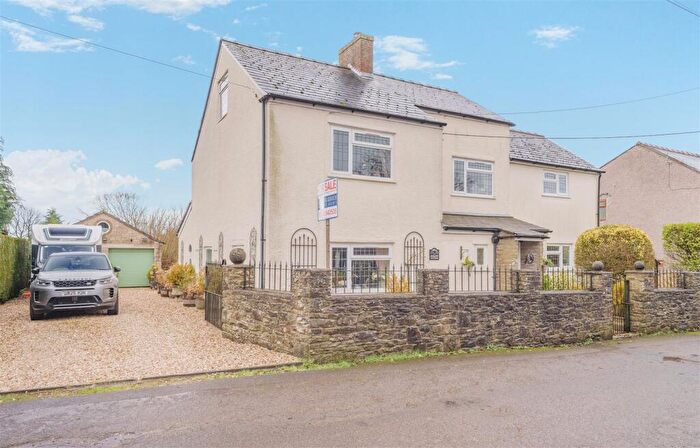
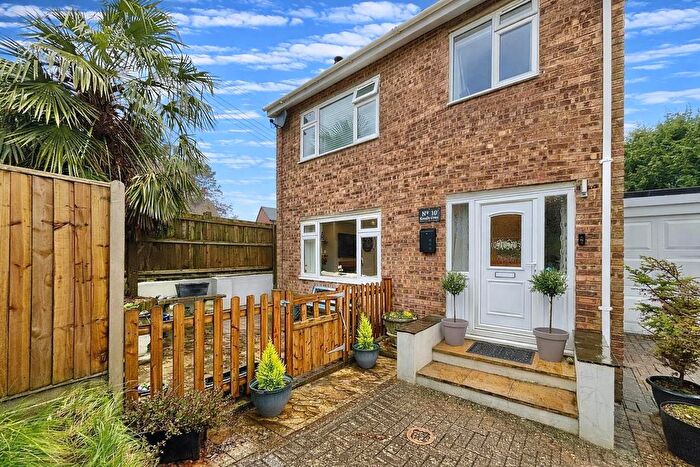
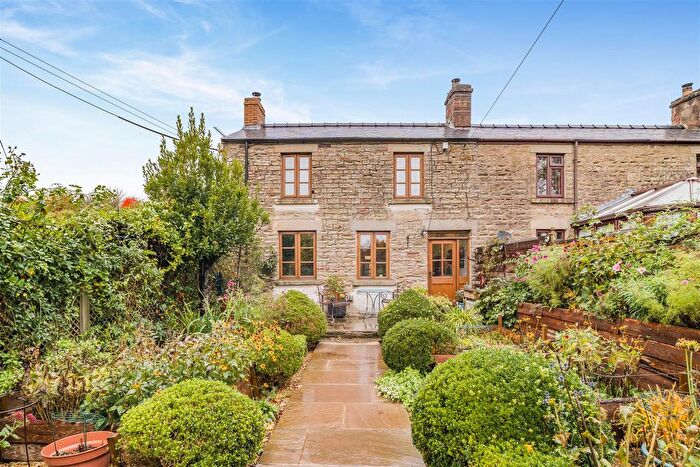
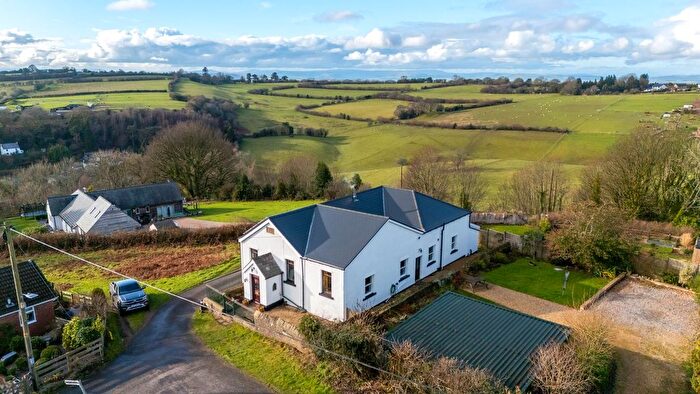
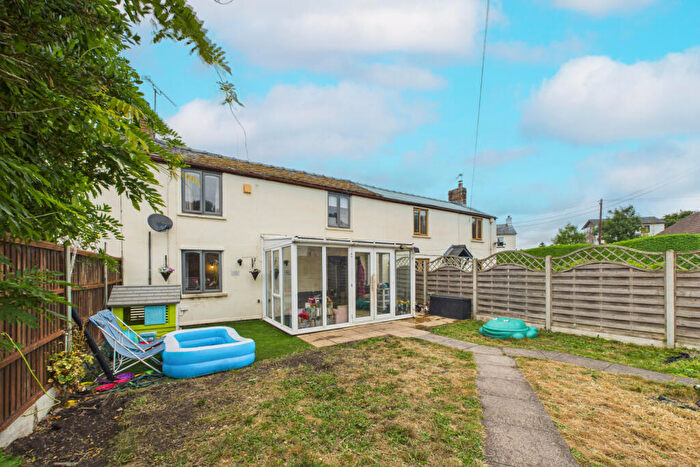
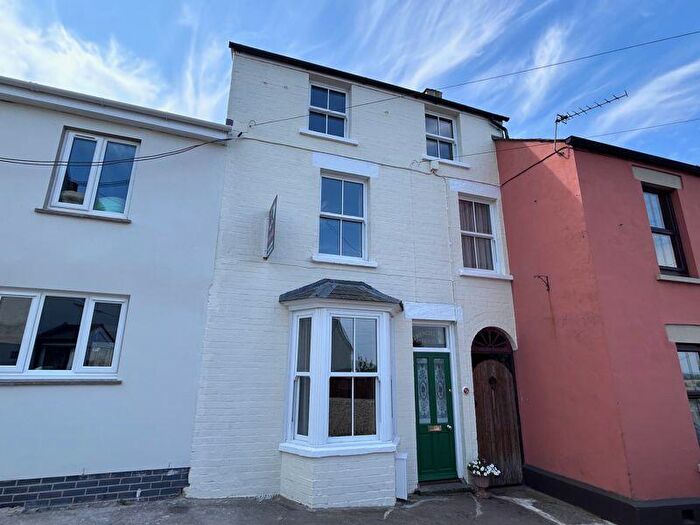
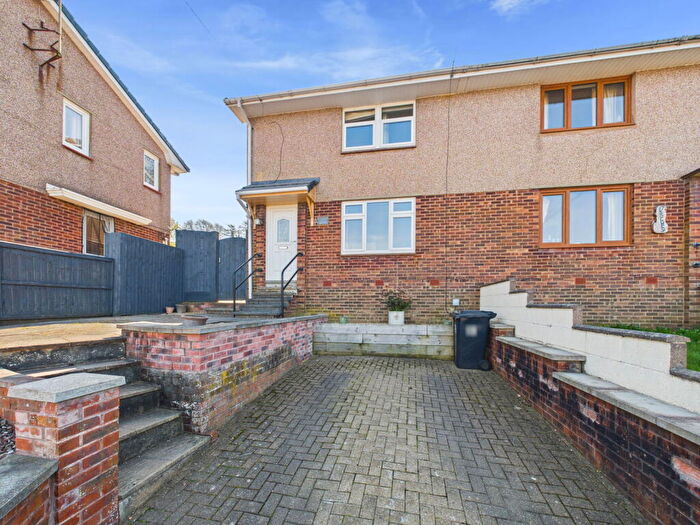
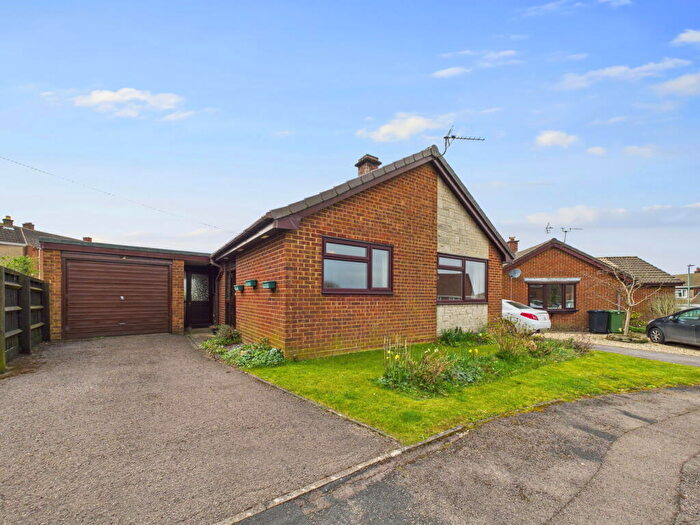
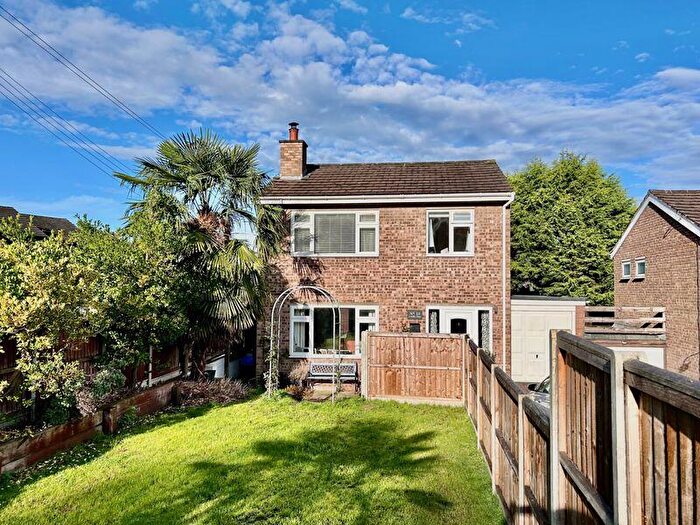
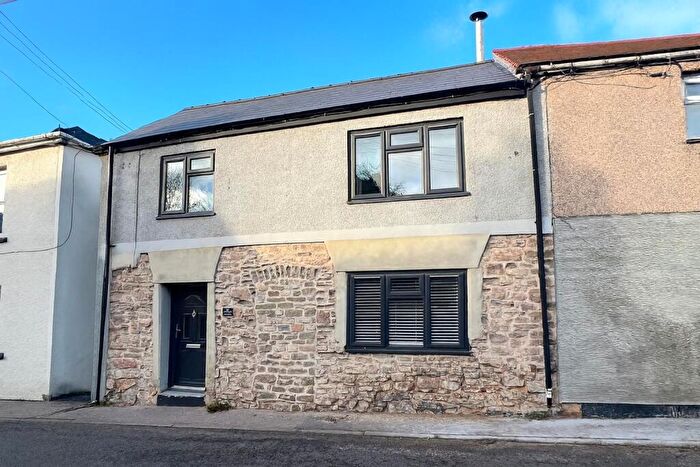
Houses for sale & to rent in Lydbrook And Ruardean, Ruardean
House Prices in Lydbrook And Ruardean
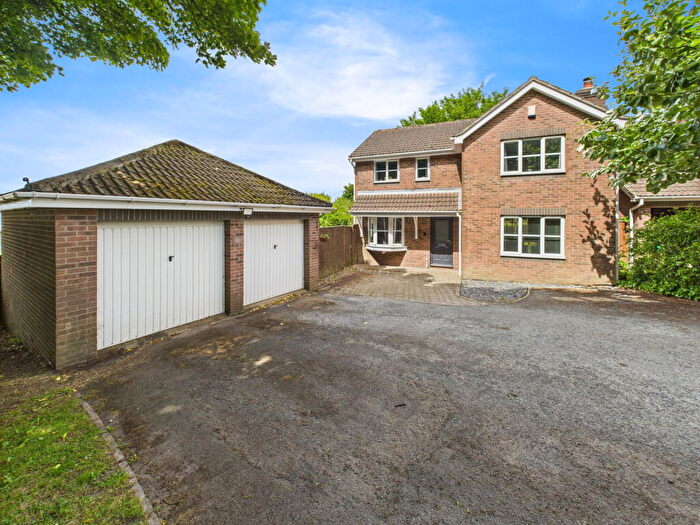
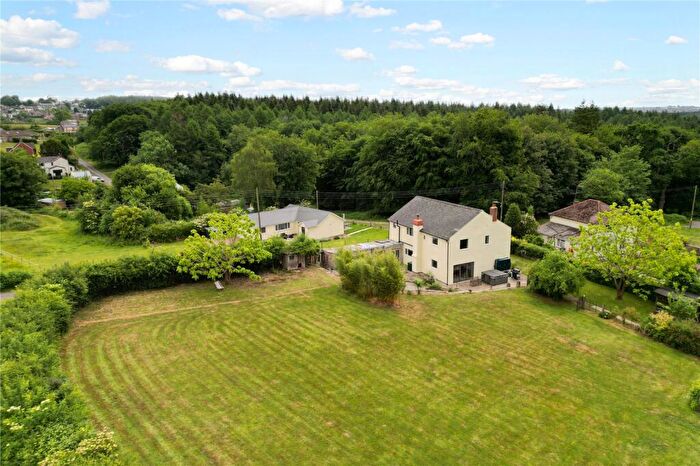
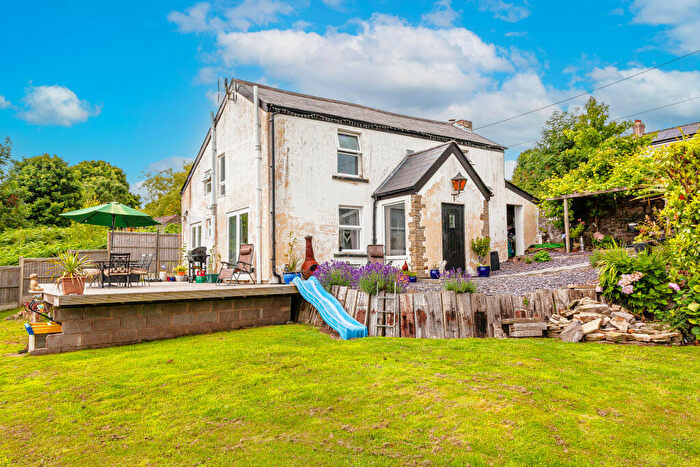
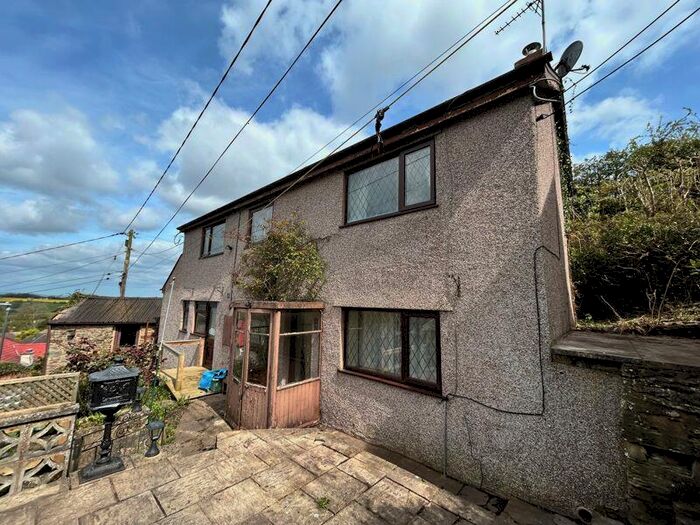
Properties in Lydbrook And Ruardean have an average house price of £313,704.00 and had 61 Property Transactions within the last 3 years¹.
Lydbrook And Ruardean is an area in Ruardean, Gloucestershire with 756 households², where the most expensive property was sold for £725,000.00.
Properties for sale in Lydbrook And Ruardean
Previously listed properties in Lydbrook And Ruardean
Roads and Postcodes in Lydbrook And Ruardean
Navigate through our locations to find the location of your next house in Lydbrook And Ruardean, Ruardean for sale or to rent.
| Streets | Postcodes |
|---|---|
| Ashdene Road | GL17 9UQ |
| Aston Bridge Road | GL17 9TZ |
| Bakers Piece | GL17 9YL |
| Barn Lane | GL17 9YF |
| Belle Vue Road | GL17 9UY |
| Boxtree Close | GL17 9UN |
| Brierley Road Woodside | GL17 9XU |
| Catshill | GL17 9TG |
| Caudle Close | GL17 9UJ |
| Caudle Lane | GL17 9TL |
| Cinderhill Way | GL17 9TQ |
| Crooked End | GL17 9XF |
| Crooked End Place | GL17 9YN |
| Crossways | GL17 9XB |
| Denehurst | GL17 9XP |
| Drybrook Road | GL17 9UX |
| Duttons Lane | GL17 9XY |
| Farm Road | GL17 9XL |
| Forest Road | GL17 9XR GL17 9XW |
| Hart Lane | GL17 9UT |
| High Beech Road | GL17 9UD |
| High Street | GL17 9TU GL17 9US |
| Highfield Road | GL17 9UZ GL17 9XA |
| Kingsway Lane | GL17 9XT |
| Knights Hill Road | GL17 9UA |
| Linden Road | GL17 9UH |
| Marfells Way | GL17 9UP |
| Mountain View | GL17 9YT |
| Newham Bottom | GL17 9UB GL17 9XS |
| Norman Way | GL17 9YP |
| Park View | GL17 9YW |
| Pettycroft | GL17 9XH |
| Pludds Court Road | GL17 9TY |
| Roebuck Meadows | GL17 9UL |
| Royal Oak Road | GL17 9UG |
| Ruardean Woodside | GL17 9XJ |
| School Lane | GL17 9XQ |
| School Road | GL17 9WW |
| Spring Place | GL17 9TA |
| St Johns Road | GL17 9UU |
| St Margarets Road | GL17 9XE |
| The Maltings | GL17 9TX |
| The Patches | GL17 9XZ |
| The Square | GL17 9TJ GL17 9TN |
| Townsend | GL17 9TR |
| Turners Tump | GL17 9XG |
| Varnister | GL17 9BQ |
| Varnister Road | GL17 9XD |
| Walkers Lane | GL17 9XN |
| Wesley Road | GL17 9XX |
| West End | GL17 9TP |
Transport near Lydbrook And Ruardean
- FAQ
- Price Paid By Year
- Property Type Price
Frequently asked questions about Lydbrook And Ruardean
What is the average price for a property for sale in Lydbrook And Ruardean?
The average price for a property for sale in Lydbrook And Ruardean is £313,704. There are 209 property listings for sale in Lydbrook And Ruardean.
What streets have the most expensive properties for sale in Lydbrook And Ruardean?
The streets with the most expensive properties for sale in Lydbrook And Ruardean are High Street at an average of £497,500, Forest Road at an average of £473,333 and Newham Bottom at an average of £457,500.
What streets have the most affordable properties for sale in Lydbrook And Ruardean?
The streets with the most affordable properties for sale in Lydbrook And Ruardean are Denehurst at an average of £162,975, St Margarets Road at an average of £211,000 and Highfield Road at an average of £212,750.
Which train stations are available in or near Lydbrook And Ruardean?
Some of the train stations available in or near Lydbrook And Ruardean are Lydney, Cam and Dursley and Gloucester.
Property Price Paid in Lydbrook And Ruardean by Year
The average sold property price by year was:
| Year | Average Sold Price | Price Change |
Sold Properties
|
|---|---|---|---|
| 2025 | £313,611 | 4% |
18 Properties |
| 2024 | £300,016 | -12% |
27 Properties |
| 2023 | £336,906 | 13% |
16 Properties |
| 2022 | £294,438 | 10% |
25 Properties |
| 2021 | £264,585 | 3% |
41 Properties |
| 2020 | £256,047 | 9% |
21 Properties |
| 2019 | £232,157 | -13% |
19 Properties |
| 2018 | £261,295 | 2% |
24 Properties |
| 2017 | £257,337 | 21% |
31 Properties |
| 2016 | £202,342 | 12% |
32 Properties |
| 2015 | £177,085 | -18% |
17 Properties |
| 2014 | £209,289 | 13% |
24 Properties |
| 2013 | £182,360 | 16% |
18 Properties |
| 2012 | £152,965 | -6% |
16 Properties |
| 2011 | £162,000 | -51% |
11 Properties |
| 2010 | £244,699 | 21% |
20 Properties |
| 2009 | £192,573 | -1% |
13 Properties |
| 2008 | £194,691 | 6% |
12 Properties |
| 2007 | £182,475 | -1% |
20 Properties |
| 2006 | £184,757 | -5% |
29 Properties |
| 2005 | £193,452 | 9% |
22 Properties |
| 2004 | £175,352 | 8% |
55 Properties |
| 2003 | £161,023 | 16% |
43 Properties |
| 2002 | £135,948 | 28% |
48 Properties |
| 2001 | £97,535 | 16% |
34 Properties |
| 2000 | £81,886 | 11% |
23 Properties |
| 1999 | £72,605 | 10% |
25 Properties |
| 1998 | £65,111 | 8% |
18 Properties |
| 1997 | £59,597 | 10% |
34 Properties |
| 1996 | £53,375 | -6% |
33 Properties |
| 1995 | £56,455 | - |
34 Properties |
Property Price per Property Type in Lydbrook And Ruardean
Here you can find historic sold price data in order to help with your property search.
The average Property Paid Price for specific property types in the last three years are:
| Property Type | Average Sold Price | Sold Properties |
|---|---|---|
| Semi Detached House | £264,478.00 | 25 Semi Detached Houses |
| Detached House | £425,916.00 | 24 Detached Houses |
| Terraced House | £191,832.00 | 12 Terraced Houses |

