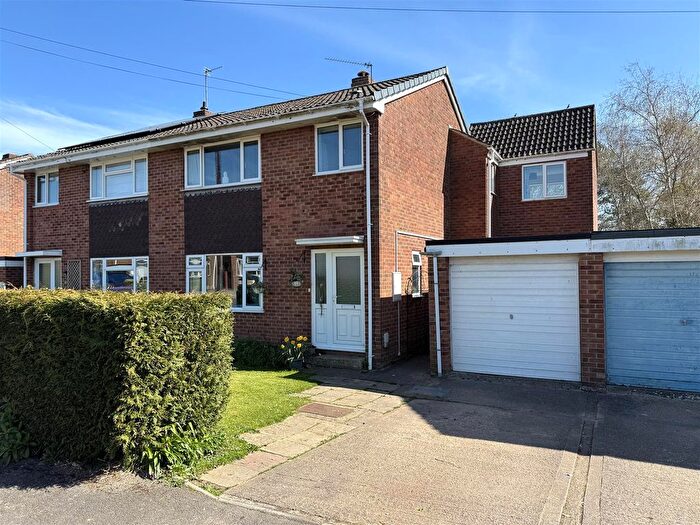
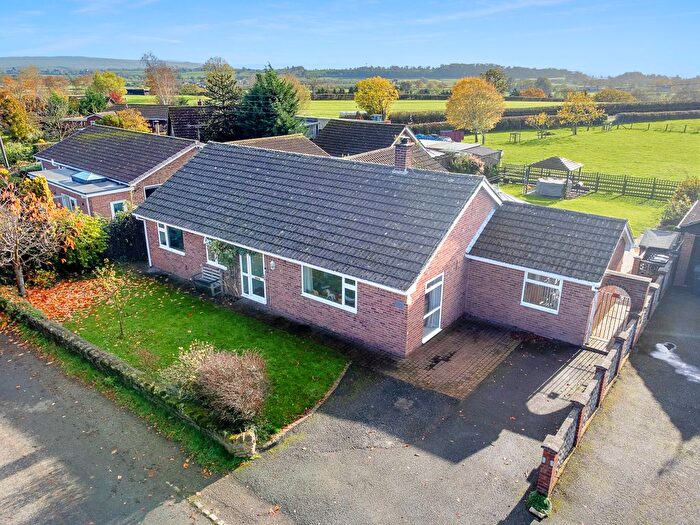
Houses for sale & to rent in Churcham And Huntley, Gloucester
House Prices in Churcham And Huntley
Properties in Churcham And Huntley have an average house price of £437,455.00 and had 62 Property Transactions within the last 3 years¹.
Churcham And Huntley is an area in Gloucester, Gloucestershire with 695 households², where the most expensive property was sold for £900,000.00.
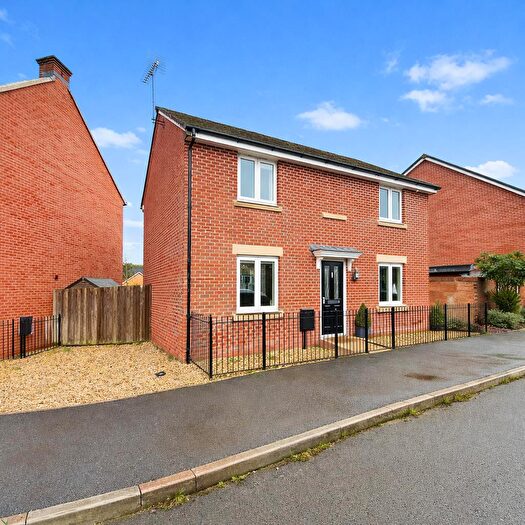
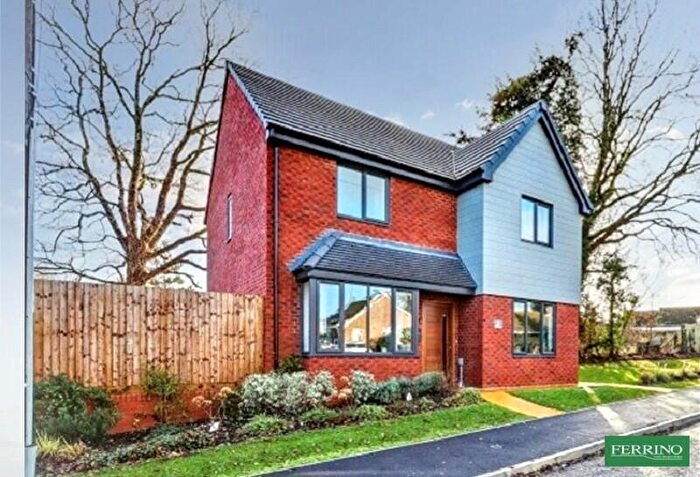
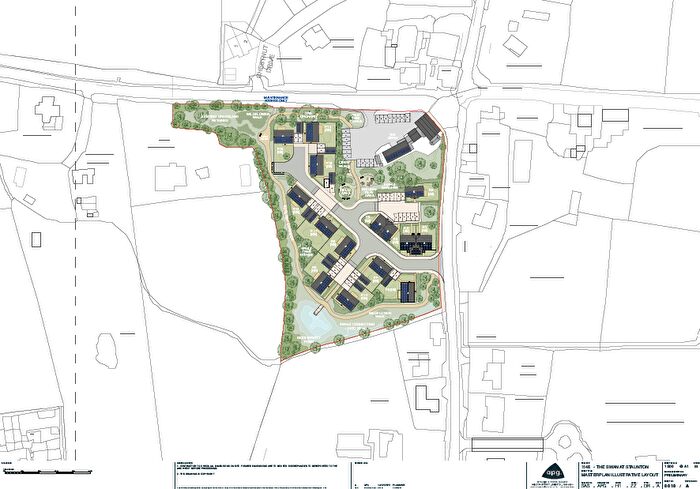
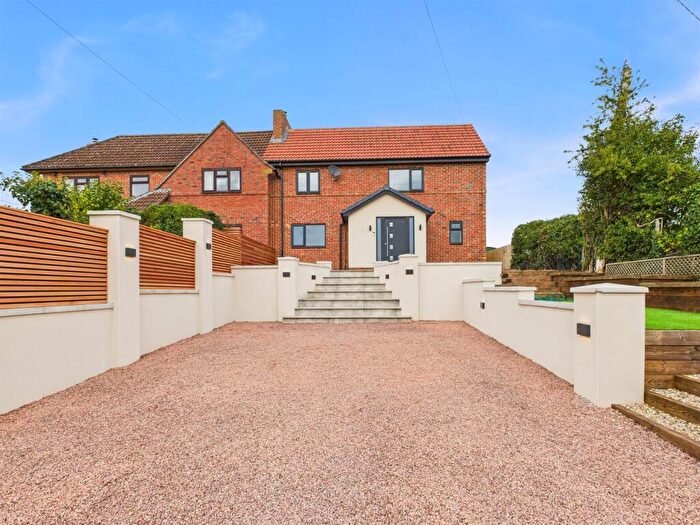
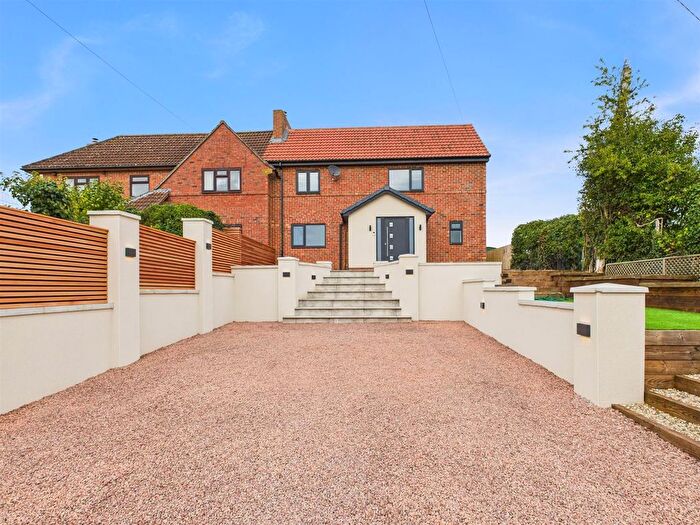
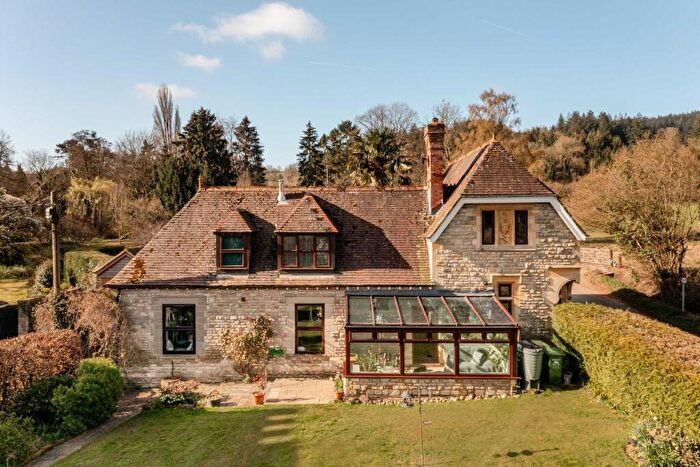
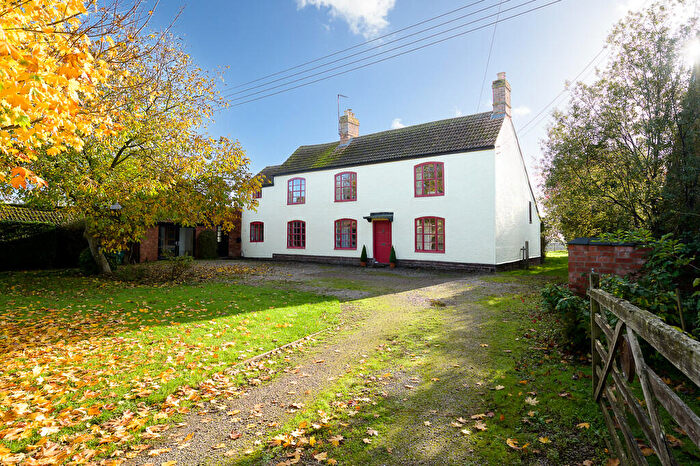
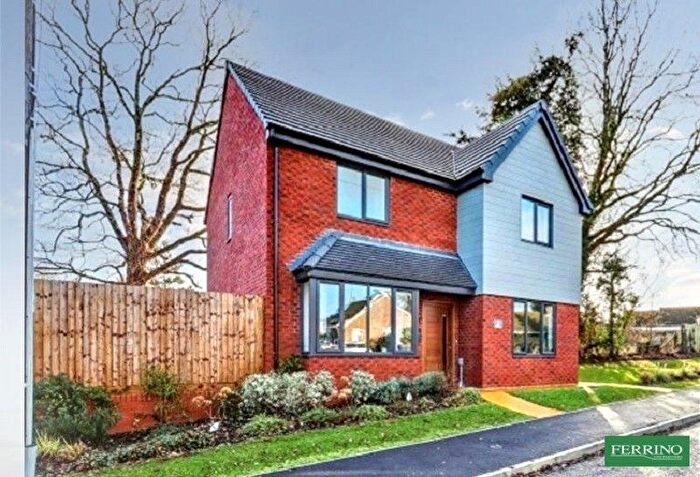
Properties for sale in Churcham And Huntley
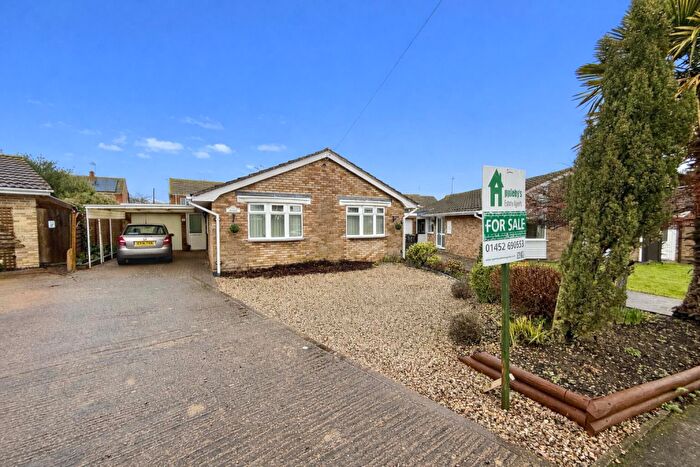
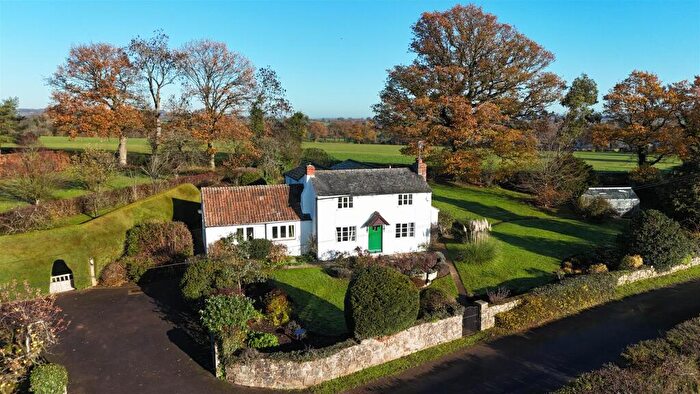
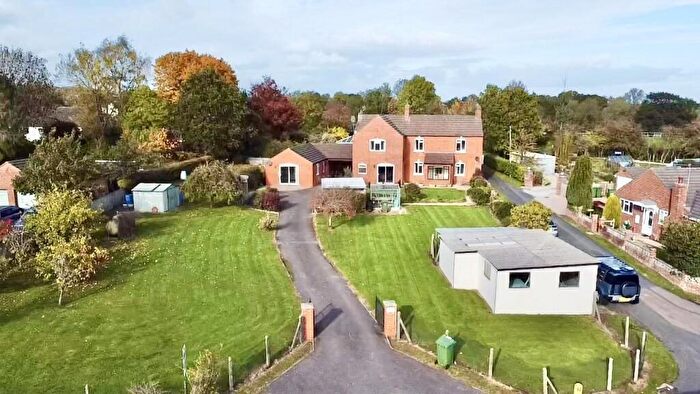
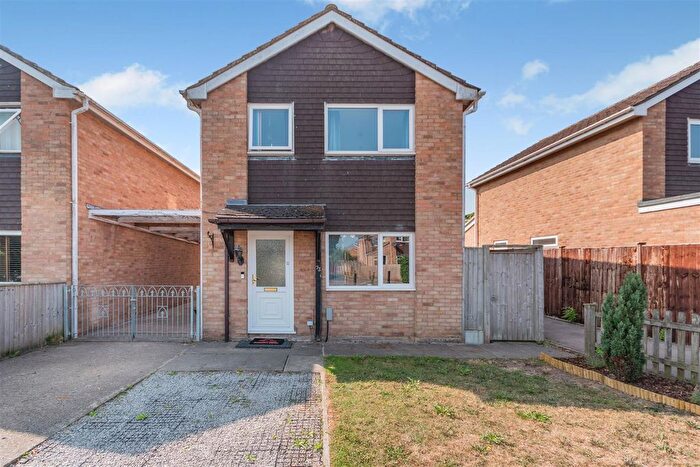
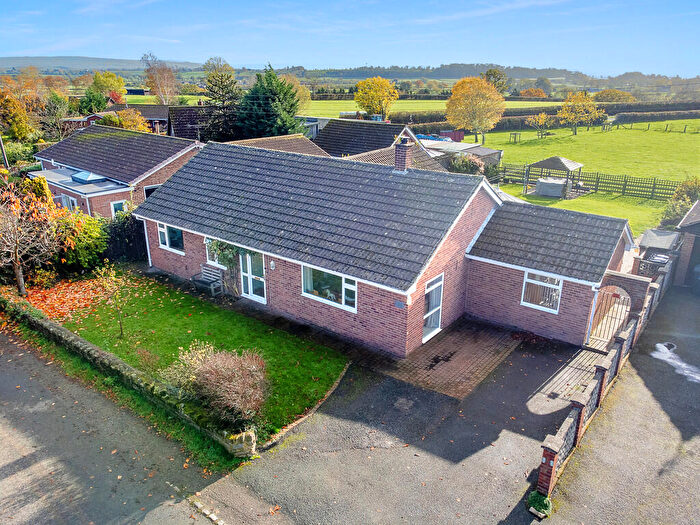
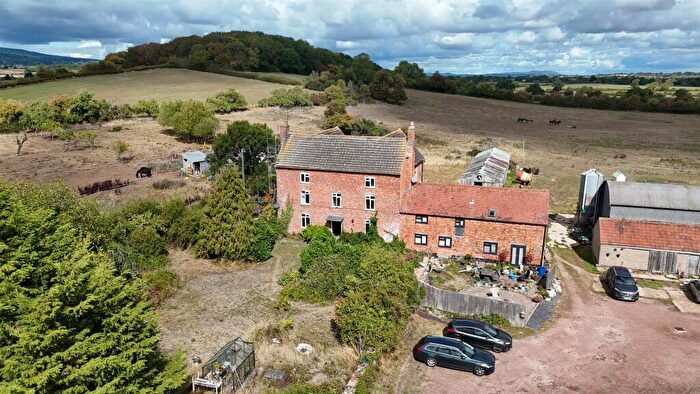
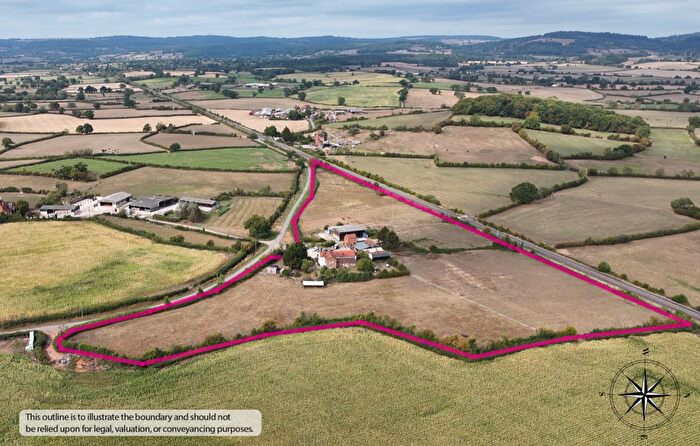
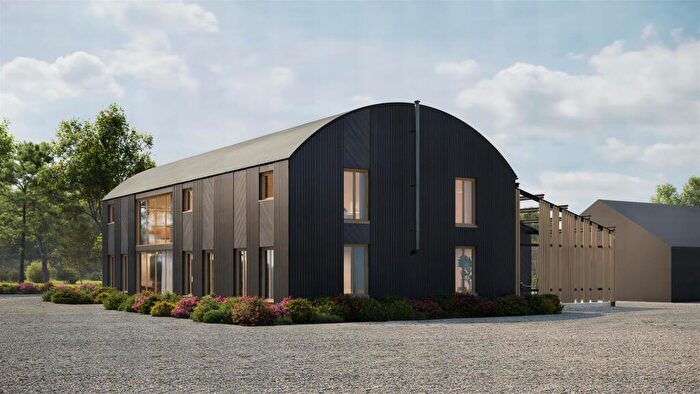
Previously listed properties in Churcham And Huntley
Roads and Postcodes in Churcham And Huntley
Navigate through our locations to find the location of your next house in Churcham And Huntley, Gloucester for sale or to rent.
| Streets | Postcodes |
|---|---|
| Bramley Drive | GL19 3HR |
| Broom Hill | GL19 3HA |
| Bulley | GL2 8BJ |
| Bulley Lane | GL2 8BQ |
| Byfords Close | GL19 3SA |
| Byfords Road | GL19 3EL |
| Chapel Lane | GL2 8AR |
| Church Lane | GL2 8AF |
| Elm Grove | GL19 3SB |
| Frogmore Road | GL19 3EP |
| Grange Court Lane | GL19 3DT |
| Hamlen Close | GL19 3DR |
| High Street | GL19 3DS GL19 3ET |
| Hinders Lane | GL19 3EZ |
| Kites Nest Lane | GL2 8BL |
| Lake Lane | GL2 8BG |
| Lambourne Avenue | GL19 3HW |
| Main Road | GL19 3DZ GL19 3EA |
| Newent Lane | GL19 3HG GL19 3HH GL19 3SE |
| Newton Close | GL19 3HN |
| North Road | GL19 3DU |
| Oak Way | GL19 3SD |
| Oakle Street | GL2 8AG |
| Orchard Way | GL19 3HP |
| Pauls Walk | GL19 3SF |
| Picked Acre | GL2 8BE |
| Ross Road | GL19 3EU GL19 3EX |
| Sainthill Cottages | GL2 8AW |
| Solomons Tump | GL19 3EB |
| Spring Dale | GL2 8AS |
| Sunset Place | GL19 3ER |
| The Fairways | GL19 3AY |
| The Square | GL19 3SG |
| Tibberton Lane | GL19 3DL GL19 3DX GL19 3DY GL19 3EN |
| Tithe Farm Lane | GL19 3ED |
| Westwick Road | GL19 3EW |
| GL19 3EF GL19 3EG GL19 3EH GL2 8AA GL2 8AB GL2 8AL GL2 8BB GL2 8BD GL2 8BW |
Transport near Churcham And Huntley
-
Gloucester Station
-
Stonehouse Station
-
Cam and Dursley Station
-
Stroud Station
-
Ledbury Station
-
Cheltenham Spa Station
-
Lydney Station
-
Colwall Station
-
Ashchurch Station
- FAQ
- Price Paid By Year
- Property Type Price
Frequently asked questions about Churcham And Huntley
What is the average price for a property for sale in Churcham And Huntley?
The average price for a property for sale in Churcham And Huntley is £437,455. This amount is 55% higher than the average price in Gloucester. There are 219 property listings for sale in Churcham And Huntley.
What streets have the most expensive properties for sale in Churcham And Huntley?
The streets with the most expensive properties for sale in Churcham And Huntley are Newent Lane at an average of £815,000, Solomons Tump at an average of £730,000 and Broom Hill at an average of £662,500.
What streets have the most affordable properties for sale in Churcham And Huntley?
The streets with the most affordable properties for sale in Churcham And Huntley are Elm Grove at an average of £271,250, Oak Way at an average of £290,000 and Newton Close at an average of £290,625.
Which train stations are available in or near Churcham And Huntley?
Some of the train stations available in or near Churcham And Huntley are Gloucester, Stonehouse and Cam and Dursley.
Property Price Paid in Churcham And Huntley by Year
The average sold property price by year was:
| Year | Average Sold Price | Price Change |
Sold Properties
|
|---|---|---|---|
| 2025 | £431,382 | -2% |
17 Properties |
| 2024 | £440,509 | 0,4% |
27 Properties |
| 2023 | £438,611 | 3% |
18 Properties |
| 2022 | £423,602 | 20% |
24 Properties |
| 2021 | £338,891 | -23% |
37 Properties |
| 2020 | £418,142 | 39% |
21 Properties |
| 2019 | £253,393 | -27% |
15 Properties |
| 2018 | £321,192 | 8% |
29 Properties |
| 2017 | £295,508 | 16% |
27 Properties |
| 2016 | £249,375 | -3% |
32 Properties |
| 2015 | £256,197 | 0,1% |
27 Properties |
| 2014 | £256,065 | 3% |
29 Properties |
| 2013 | £248,343 | 10% |
16 Properties |
| 2012 | £223,229 | -3% |
24 Properties |
| 2011 | £229,019 | -2% |
13 Properties |
| 2010 | £233,132 | 7% |
26 Properties |
| 2009 | £215,812 | -39% |
27 Properties |
| 2008 | £299,014 | 14% |
18 Properties |
| 2007 | £257,045 | -3% |
21 Properties |
| 2006 | £264,638 | 12% |
27 Properties |
| 2005 | £231,892 | -0,1% |
14 Properties |
| 2004 | £232,136 | -10% |
38 Properties |
| 2003 | £255,317 | 36% |
14 Properties |
| 2002 | £164,469 | 13% |
30 Properties |
| 2001 | £143,662 | 25% |
36 Properties |
| 2000 | £107,713 | 4% |
30 Properties |
| 1999 | £103,679 | -5% |
27 Properties |
| 1998 | £108,715 | 25% |
30 Properties |
| 1997 | £82,054 | 8% |
30 Properties |
| 1996 | £75,137 | -2% |
27 Properties |
| 1995 | £76,603 | - |
28 Properties |
Property Price per Property Type in Churcham And Huntley
Here you can find historic sold price data in order to help with your property search.
The average Property Paid Price for specific property types in the last three years are:
| Property Type | Average Sold Price | Sold Properties |
|---|---|---|
| Semi Detached House | £298,157.00 | 19 Semi Detached Houses |
| Detached House | £506,315.00 | 42 Detached Houses |
| Flat | £192,000.00 | 1 Flat |

