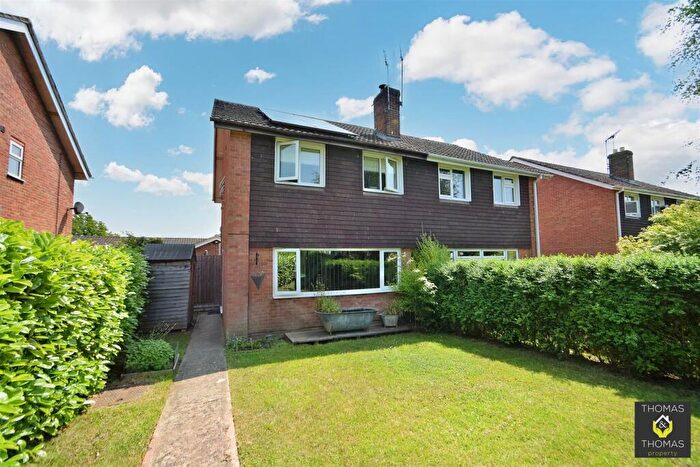
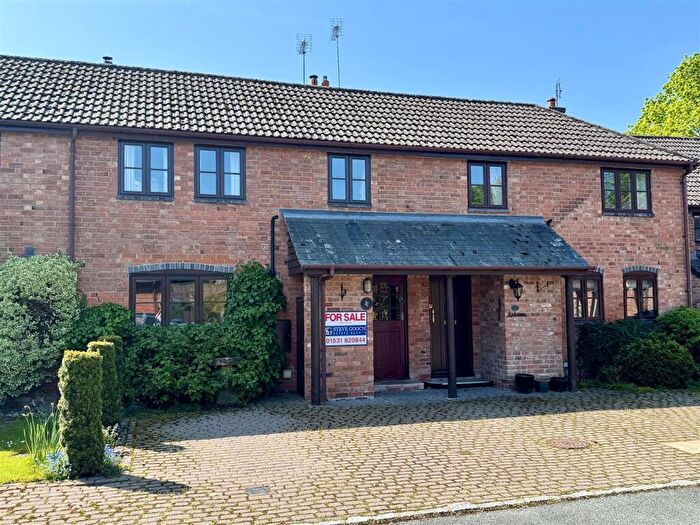
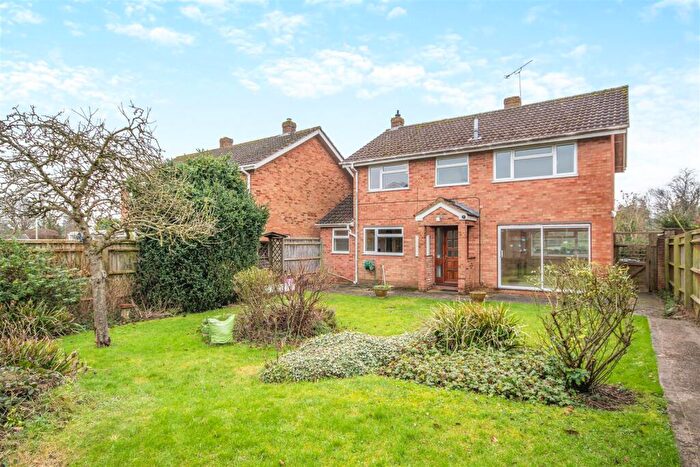
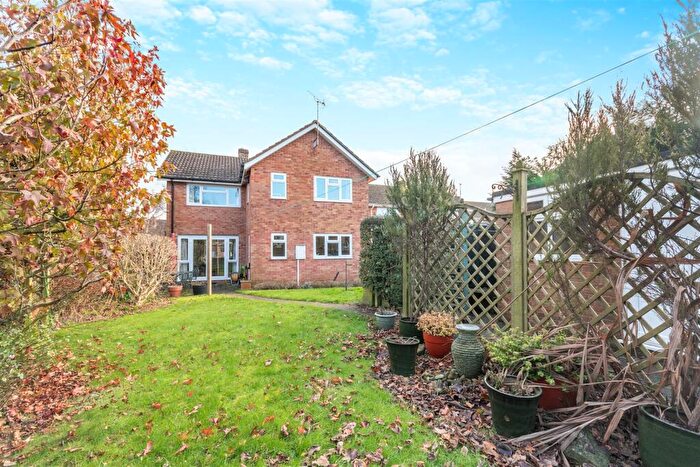
Houses for sale & to rent in Tibberton, Gloucester
House Prices in Tibberton
Properties in Tibberton have an average house price of £436,694.00 and had 23 Property Transactions within the last 3 years¹.
Tibberton is an area in Gloucester, Gloucestershire with 382 households², where the most expensive property was sold for £1,450,000.00.
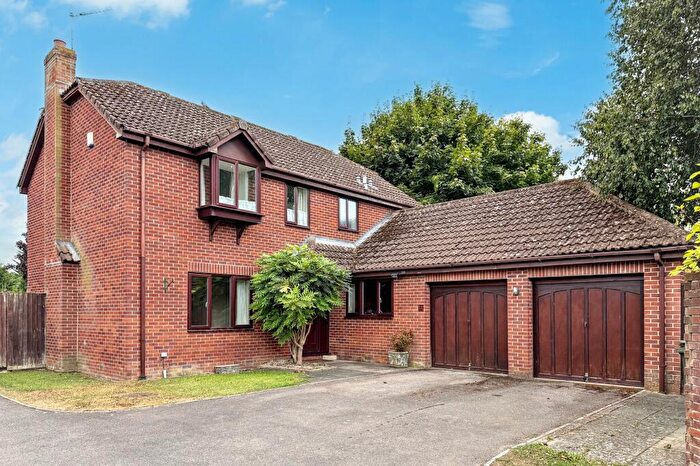
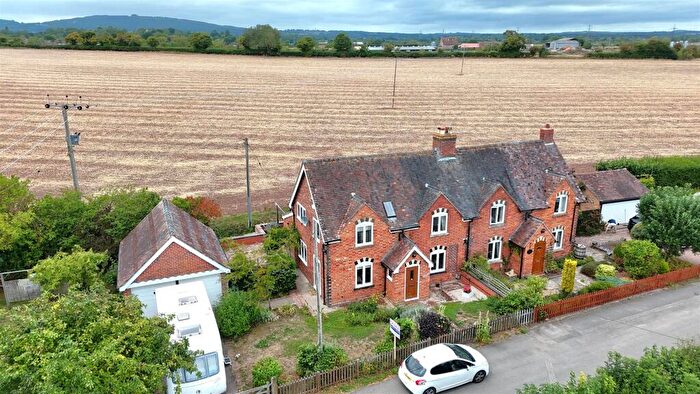
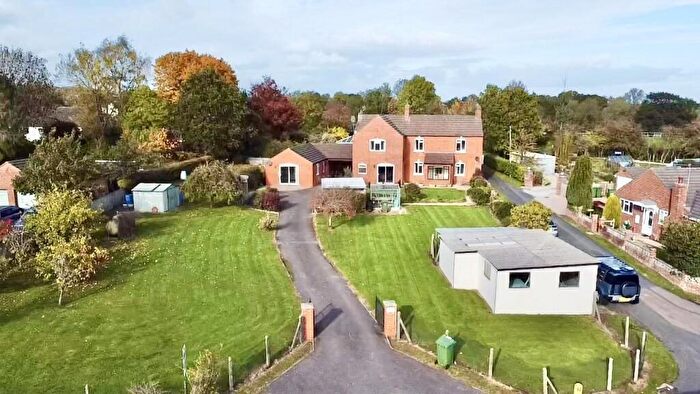
Properties for sale in Tibberton
Previously listed properties in Tibberton
Roads and Postcodes in Tibberton
Navigate through our locations to find the location of your next house in Tibberton, Gloucester for sale or to rent.
| Streets | Postcodes |
|---|---|
| Bovone Cottages | GL2 8DX |
| Bovone Lane | GL2 8EA |
| Buttermilk Lane | GL2 8DY |
| Church Lane | GL2 8DT |
| Huntley Road | GL19 3AA GL19 3AB GL19 3AD GL19 3AE GL19 3AF |
| Kents Green | GL19 3AJ |
| Lower Orchard | GL19 3AX |
| Lynes Cottage | GL19 3AP |
| Moat Lane | GL19 3AR |
| Muzzle Patch | GL2 8EE |
| Orchard Rise | GL19 3AT |
| Phelps Way | GL19 3AU |
| Tibberton Lane | GL19 3AG |
| Whitehall Lane | GL2 8ED |
| Woodside Cottages | GL2 8DS |
| Wynford Villas | GL19 3AL |
| GL19 3AN GL19 3AQ GL19 3AW GL19 3HL GL2 8DZ GL2 8EB |
Transport near Tibberton
-
Gloucester Station
-
Stonehouse Station
-
Ledbury Station
-
Cheltenham Spa Station
-
Stroud Station
-
Cam and Dursley Station
-
Colwall Station
-
Ashchurch Station
-
Lydney Station
-
Great Malvern Station
- FAQ
- Price Paid By Year
- Property Type Price
Frequently asked questions about Tibberton
What is the average price for a property for sale in Tibberton?
The average price for a property for sale in Tibberton is £436,694. This amount is 54% higher than the average price in Gloucester. There are 133 property listings for sale in Tibberton.
What streets have the most expensive properties for sale in Tibberton?
The streets with the most expensive properties for sale in Tibberton are Kents Green at an average of £875,000, Church Lane at an average of £775,000 and Buttermilk Lane at an average of £577,500.
What streets have the most affordable properties for sale in Tibberton?
The streets with the most affordable properties for sale in Tibberton are Huntley Road at an average of £270,762, Muzzle Patch at an average of £290,983 and Orchard Rise at an average of £324,083.
Which train stations are available in or near Tibberton?
Some of the train stations available in or near Tibberton are Gloucester, Stonehouse and Ledbury.
Property Price Paid in Tibberton by Year
The average sold property price by year was:
| Year | Average Sold Price | Price Change |
Sold Properties
|
|---|---|---|---|
| 2025 | £466,237 | 18% |
4 Properties |
| 2024 | £382,724 | -24% |
9 Properties |
| 2023 | £473,450 | 7% |
10 Properties |
| 2022 | £438,388 | -24% |
9 Properties |
| 2021 | £545,222 | 18% |
18 Properties |
| 2020 | £449,161 | 36% |
9 Properties |
| 2019 | £287,909 | -10% |
11 Properties |
| 2018 | £317,875 | -16% |
10 Properties |
| 2017 | £369,718 | 5% |
11 Properties |
| 2016 | £352,813 | 19% |
19 Properties |
| 2015 | £286,045 | -6% |
11 Properties |
| 2014 | £304,040 | 14% |
10 Properties |
| 2013 | £260,607 | -8% |
14 Properties |
| 2012 | £281,627 | -24% |
11 Properties |
| 2011 | £347,928 | 43% |
7 Properties |
| 2010 | £196,583 | -54% |
6 Properties |
| 2009 | £302,857 | 14% |
7 Properties |
| 2008 | £259,833 | -21% |
6 Properties |
| 2007 | £315,445 | -3% |
11 Properties |
| 2006 | £326,423 | 17% |
13 Properties |
| 2005 | £271,530 | 22% |
15 Properties |
| 2004 | £212,856 | 11% |
9 Properties |
| 2003 | £190,187 | -16% |
8 Properties |
| 2002 | £220,500 | 14% |
11 Properties |
| 2001 | £190,563 | 26% |
11 Properties |
| 2000 | £140,305 | 2% |
10 Properties |
| 1999 | £137,304 | -28% |
23 Properties |
| 1998 | £175,450 | 23% |
10 Properties |
| 1997 | £135,508 | 13% |
12 Properties |
| 1996 | £117,651 | 21% |
13 Properties |
| 1995 | £92,406 | - |
8 Properties |
Property Price per Property Type in Tibberton
Here you can find historic sold price data in order to help with your property search.
The average Property Paid Price for specific property types in the last three years are:
| Property Type | Average Sold Price | Sold Properties |
|---|---|---|
| Semi Detached House | £300,416.00 | 6 Semi Detached Houses |
| Terraced House | £228,294.00 | 5 Terraced Houses |
| Detached House | £591,666.00 | 12 Detached Houses |

