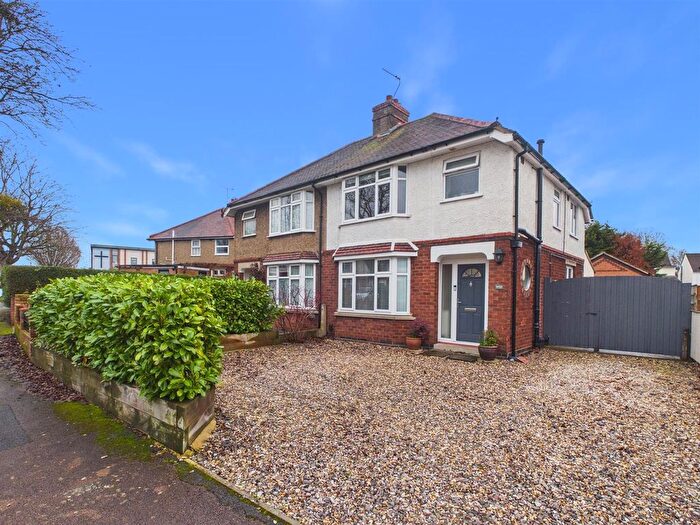
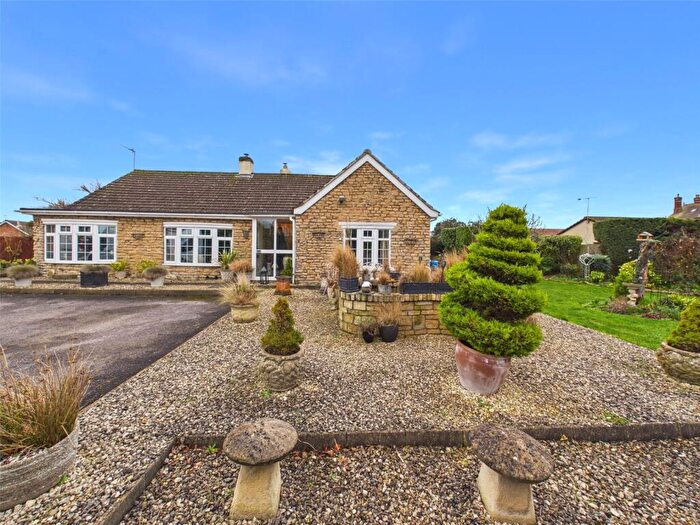
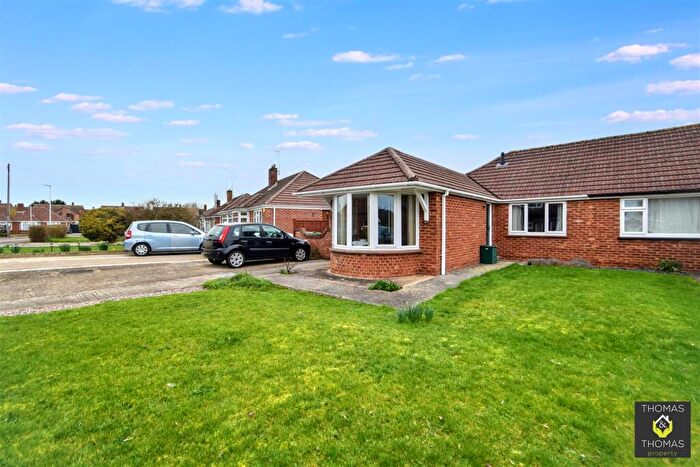
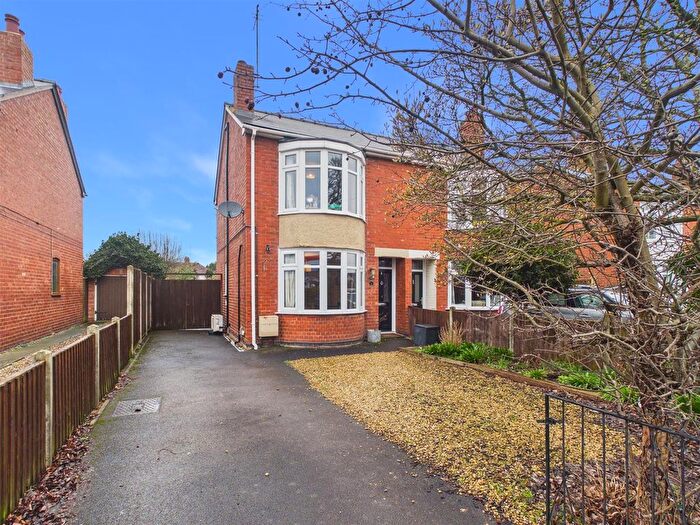
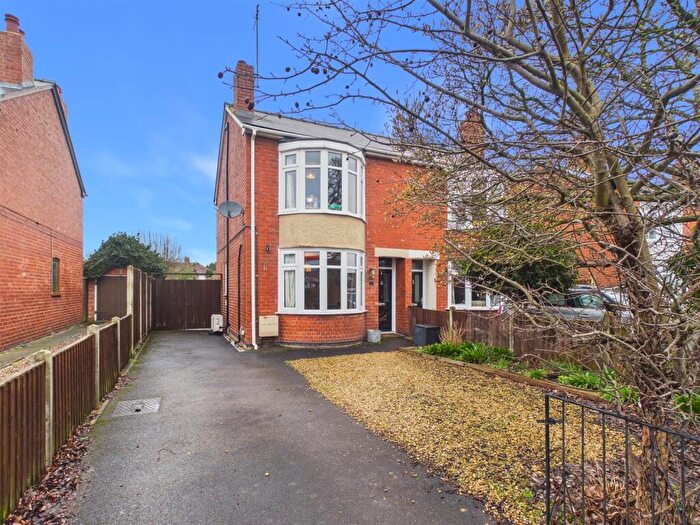
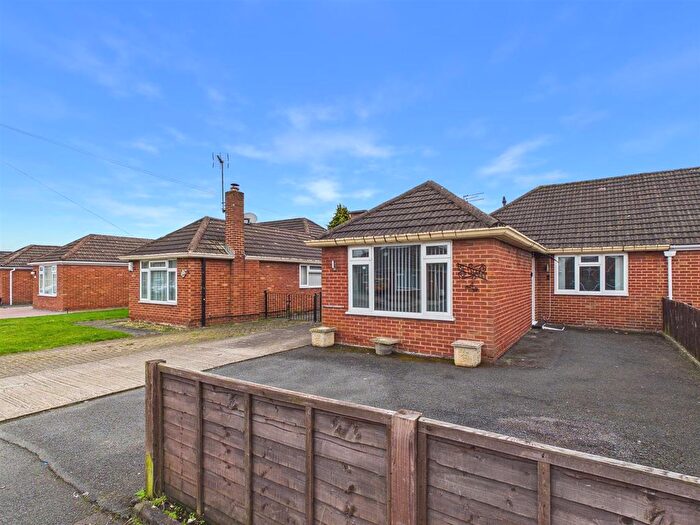
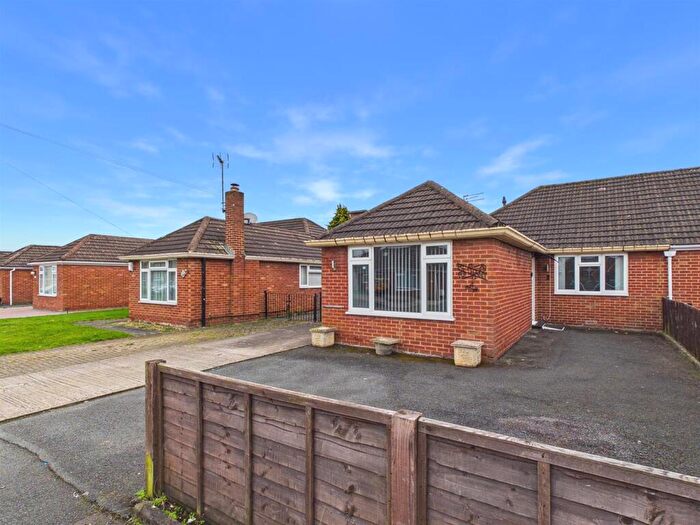
Houses for sale & to rent in Elmbridge, Gloucester
House Prices in Elmbridge
Properties in Elmbridge have an average house price of £320,682.00 and had 212 Property Transactions within the last 3 years¹.
Elmbridge is an area in Gloucester, Gloucestershire with 2,313 households², where the most expensive property was sold for £900,000.00.
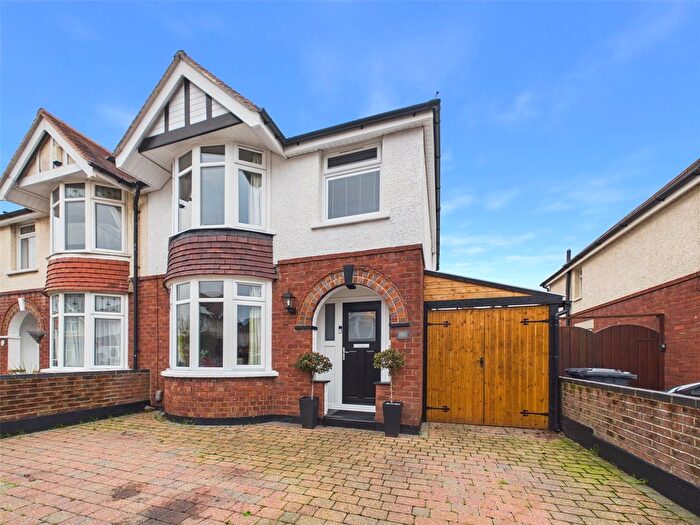
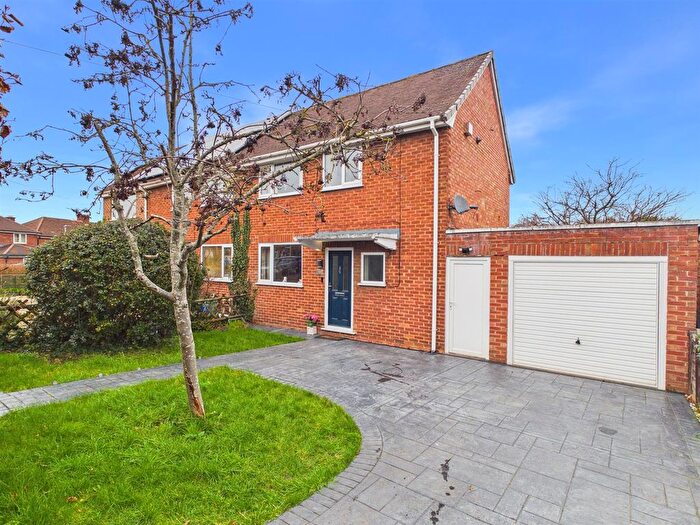
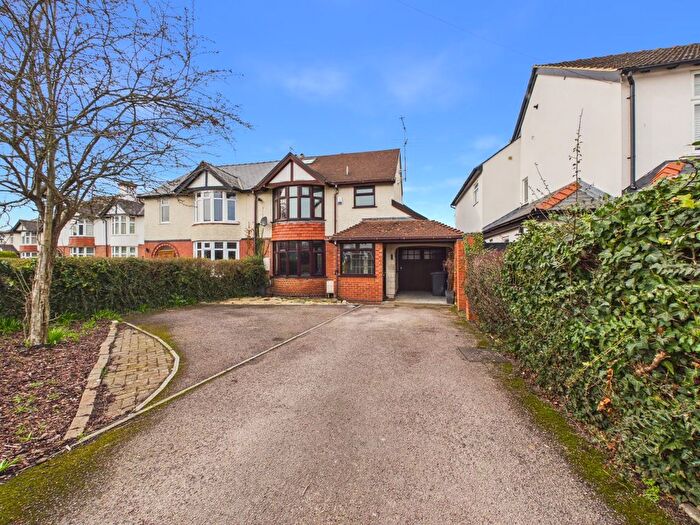
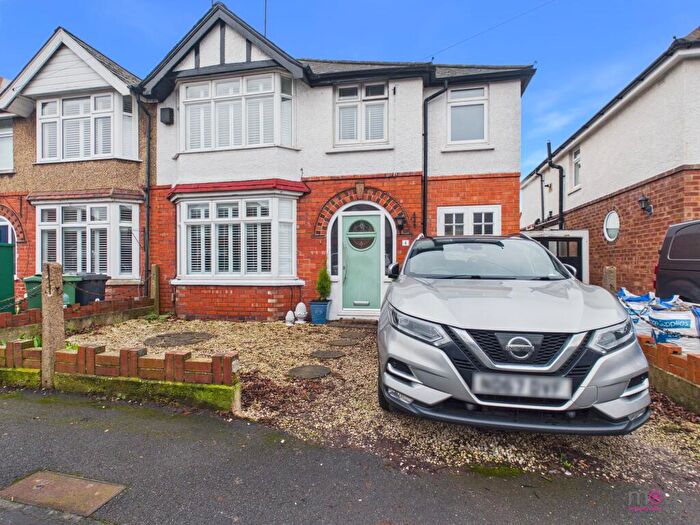
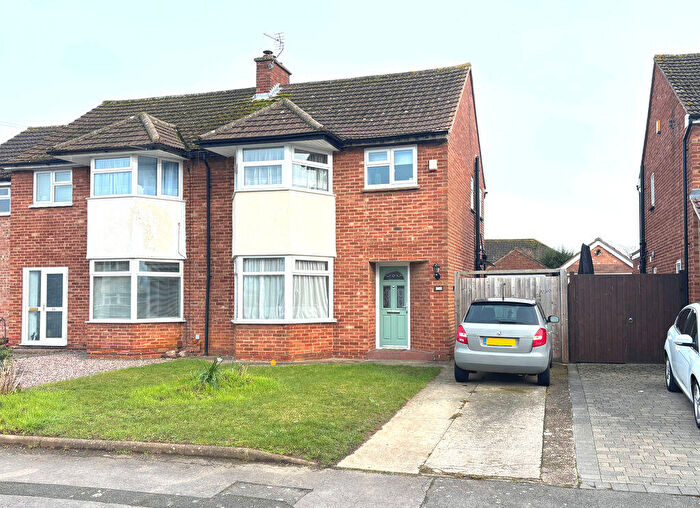
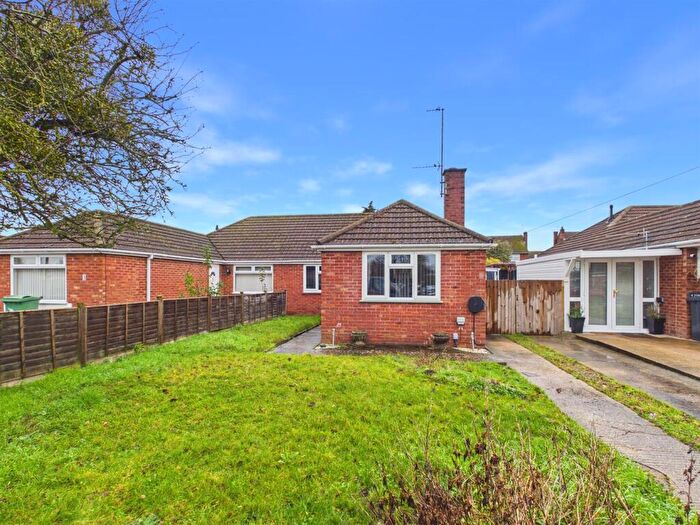
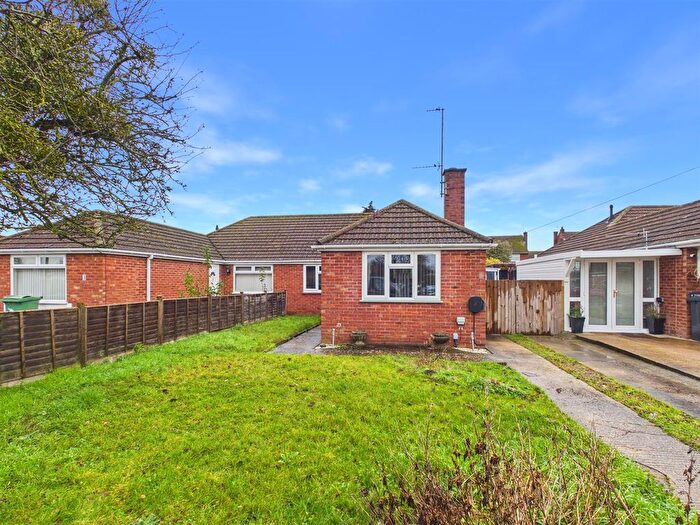
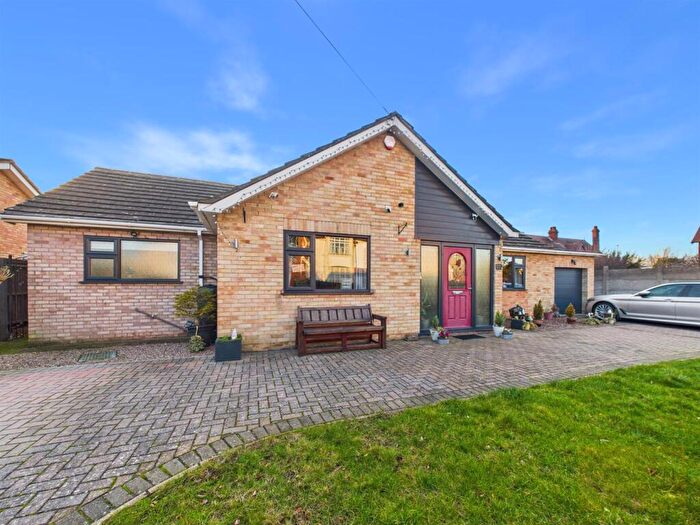
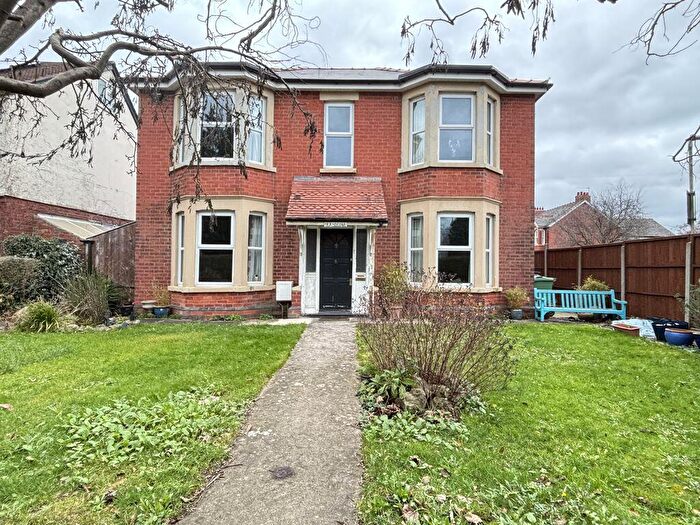
Properties for sale in Elmbridge
Roads and Postcodes in Elmbridge
Navigate through our locations to find the location of your next house in Elmbridge, Gloucester for sale or to rent.
| Streets | Postcodes |
|---|---|
| Addington Court | GL2 0SN |
| Argyll Place | GL2 0QS |
| Argyll Road | GL2 0QR |
| Armscroft Court | GL2 0TE |
| Armscroft Crescent | GL2 0SU |
| Armscroft Gardens | GL2 0RT |
| Armscroft Place | GL2 0SP GL2 0SW |
| Armscroft Road | GL2 0SJ GL2 0SQ GL2 0TF |
| Armscroft Way | GL2 0ST |
| Barnwood Road | GL2 0RU GL2 0RX GL2 0RY GL2 0RZ GL2 0SD GL2 0SF GL2 0SG |
| Blinkhorns Bridge Lane | GL2 0BT GL2 0SL |
| Bradford Road | GL2 0SY |
| Braeburn Close | GL2 0NS |
| Brookside Villas | GL2 0SS GL2 0SX |
| Brunel Close | GL2 0TB |
| Cheltenham Road | GL2 0JN GL2 0JR GL2 0JW GL2 0LS GL2 0LU GL2 0LX GL2 0LY |
| Colebridge Avenue | GL2 0RG GL2 0RH GL2 0RQ |
| Colebridge Gardens | GL2 0LW |
| Coronation Grove | GL2 0SR |
| Derby Road | GL1 4AD |
| Ebor Road | GL2 0SH |
| Elmbridge Road | GL2 0NU GL2 0NX GL2 0NY GL2 0NZ GL2 0PB GL2 0PD GL2 0PF GL2 0PG GL2 0PH GL2 0PQ GL2 0QD GL2 0PE |
| Elmleaze | GL2 0JS GL2 0JT GL2 0JU GL2 0JX GL2 0JY GL2 0JZ GL2 0LA GL2 0LB GL2 0LD |
| Estcourt Road | GL1 3BE |
| Grafton Road | GL2 0QP GL2 0QW |
| Green Pippin Close | GL2 0PA |
| Grosvenor Road | GL2 0SA GL2 0SB |
| Horton Road | GL1 3PY GL1 3QA |
| Kenilworth Avenue | GL2 0QN |
| Kimberley Close | GL2 0LH |
| Lambourn Close | GL2 0HN |
| Lavington Drive | GL2 0HP GL2 0HR GL2 0HS GL2 0HT GL2 0HW |
| Liddington Road | GL2 0HJ GL2 0HL |
| Little Elmbridge | GL2 0HH |
| Lonsdale Road | GL2 0TA |
| Manor Park | GL2 0HG |
| Meadowleaze | GL2 0PL GL2 0PN GL2 0PR GL2 0PS GL2 0PT GL2 0PW |
| Merevale Road | GL2 0QX GL2 0QY GL2 0QZ GL2 0RF |
| Nine Elms Road | GL2 0HA GL2 0HB GL2 0HD GL2 0HF |
| Oakleaze | GL2 0LE GL2 0LG GL2 0LQ GL2 0LF |
| Ogbourne Close | GL2 0HU |
| Orchard Road | GL2 0HX |
| Pickwick Close | GL2 0PP |
| Riversley Road | GL2 0QT GL2 0QU |
| Sandyleaze | GL2 0PU GL2 0PX GL2 0PY |
| Sisson End | GL2 0RL |
| Sisson Road | GL2 0RA GL2 0RJ GL2 0GR GL2 0RE |
| The Parade | GL2 0HE |
| Triangle Park | GL1 1AJ |
| Triangle Way | GL1 1AH |
| Waverley Road | GL2 0SZ |
| Willowleaze | GL2 0PZ GL2 0QA GL2 0QB |
| Windfall Way | GL2 0RP |
| Wishford Close | GL2 0HQ |
| Wolseley Road | GL2 0PJ |
| Wotton Elms Court | GL2 0TD |
| GL2 0LJ |
Transport near Elmbridge
- FAQ
- Price Paid By Year
- Property Type Price
Frequently asked questions about Elmbridge
What is the average price for a property for sale in Elmbridge?
The average price for a property for sale in Elmbridge is £320,682. This amount is 13% higher than the average price in Gloucester. There are 391 property listings for sale in Elmbridge.
What streets have the most expensive properties for sale in Elmbridge?
The streets with the most expensive properties for sale in Elmbridge are Braeburn Close at an average of £537,500, Grosvenor Road at an average of £471,666 and Argyll Road at an average of £452,500.
What streets have the most affordable properties for sale in Elmbridge?
The streets with the most affordable properties for sale in Elmbridge are The Parade at an average of £87,500, Armscroft Court at an average of £175,500 and Oakleaze at an average of £190,833.
Which train stations are available in or near Elmbridge?
Some of the train stations available in or near Elmbridge are Gloucester, Cheltenham Spa and Stroud.
Property Price Paid in Elmbridge by Year
The average sold property price by year was:
| Year | Average Sold Price | Price Change |
Sold Properties
|
|---|---|---|---|
| 2025 | £333,055 | 4% |
50 Properties |
| 2024 | £320,076 | 2% |
92 Properties |
| 2023 | £312,642 | 2% |
70 Properties |
| 2022 | £307,026 | 11% |
90 Properties |
| 2021 | £274,436 | -0,1% |
113 Properties |
| 2020 | £274,579 | 16% |
87 Properties |
| 2019 | £231,847 | -12% |
96 Properties |
| 2018 | £258,570 | 7% |
96 Properties |
| 2017 | £239,369 | -4% |
76 Properties |
| 2016 | £249,561 | 11% |
99 Properties |
| 2015 | £221,979 | 11% |
96 Properties |
| 2014 | £197,839 | -0,2% |
101 Properties |
| 2013 | £198,272 | 9% |
87 Properties |
| 2012 | £179,798 | 8% |
60 Properties |
| 2011 | £165,989 | -16% |
62 Properties |
| 2010 | £192,559 | 11% |
73 Properties |
| 2009 | £170,800 | -2% |
71 Properties |
| 2008 | £174,845 | -10% |
46 Properties |
| 2007 | £193,068 | -1% |
120 Properties |
| 2006 | £195,155 | 8% |
153 Properties |
| 2005 | £178,628 | 6% |
102 Properties |
| 2004 | £167,130 | 16% |
83 Properties |
| 2003 | £140,353 | 11% |
91 Properties |
| 2002 | £124,809 | 9% |
113 Properties |
| 2001 | £114,109 | 17% |
136 Properties |
| 2000 | £94,701 | 16% |
102 Properties |
| 1999 | £79,957 | 4% |
109 Properties |
| 1998 | £76,713 | 17% |
115 Properties |
| 1997 | £63,834 | 1% |
108 Properties |
| 1996 | £63,045 | 14% |
104 Properties |
| 1995 | £54,221 | - |
78 Properties |
Property Price per Property Type in Elmbridge
Here you can find historic sold price data in order to help with your property search.
The average Property Paid Price for specific property types in the last three years are:
| Property Type | Average Sold Price | Sold Properties |
|---|---|---|
| Semi Detached House | £321,621.00 | 123 Semi Detached Houses |
| Detached House | £451,060.00 | 38 Detached Houses |
| Terraced House | £254,735.00 | 34 Terraced Houses |
| Flat | £154,352.00 | 17 Flats |

