
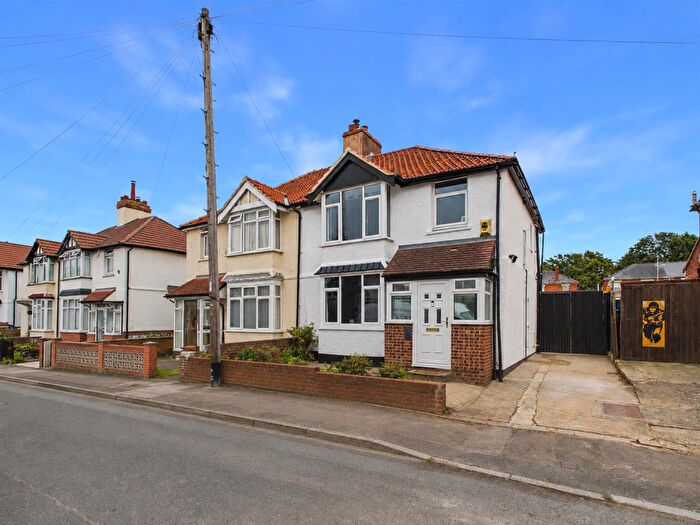
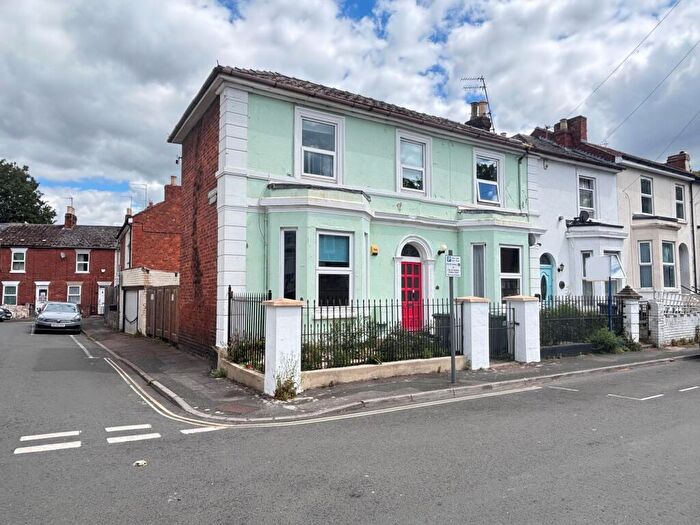
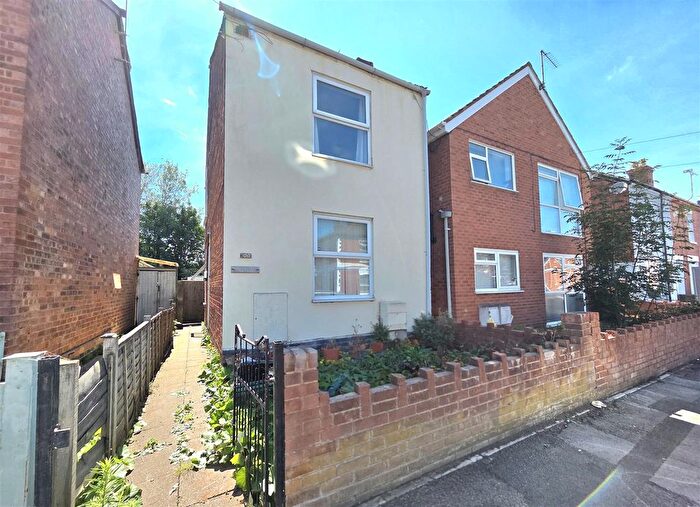
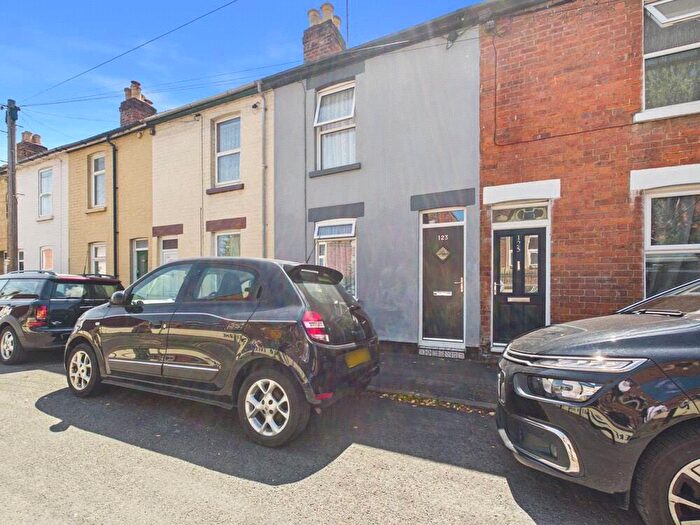
Houses for sale in Moreland, Gloucester
House Prices in Moreland
Properties in Moreland have an average house price of £221k and had 429 Property Transactions within the last 3 years¹.
Moreland is an area in Gloucester, Gloucestershire with 4,263 households², where the most expensive property was sold for £758k.
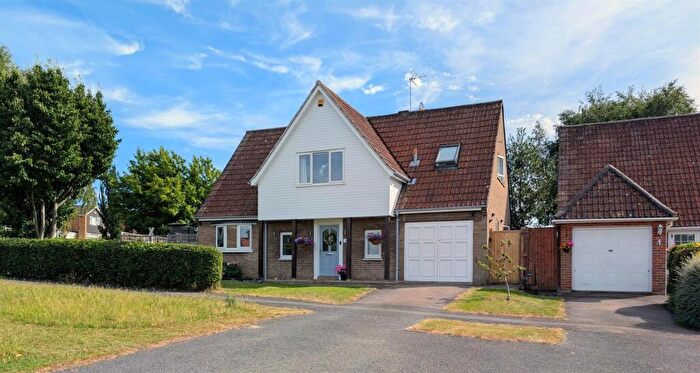
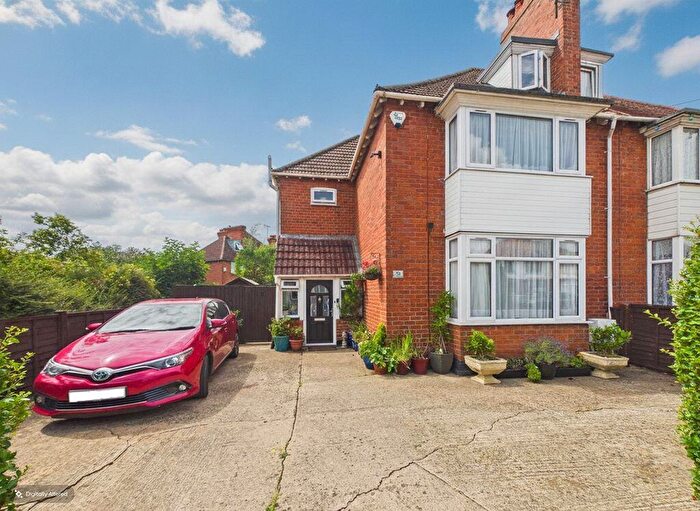
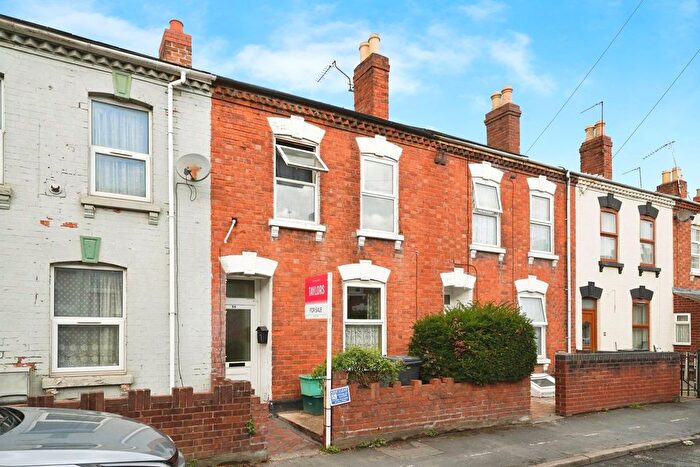
Properties for sale in Moreland
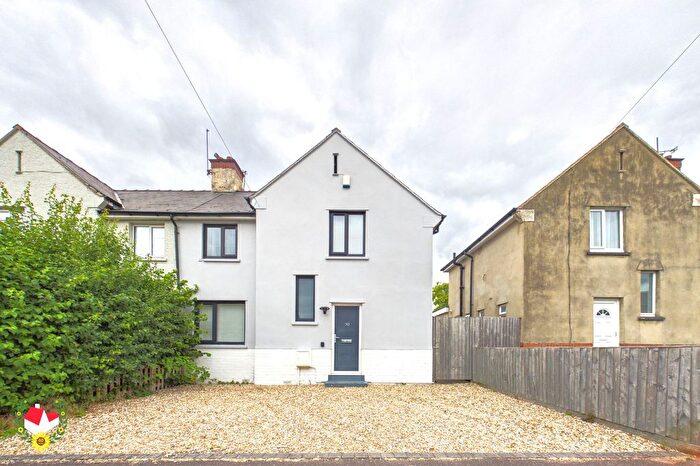
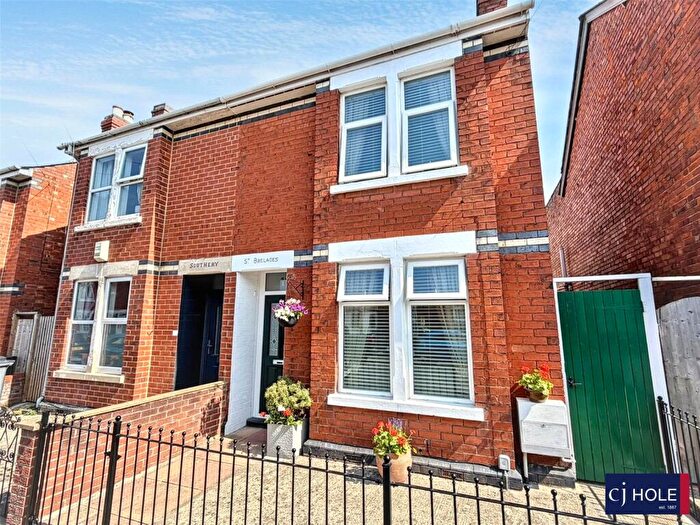
![]()
If you are looking to sell your house, let it out, or receive a property valuation, an expert can help you.
Click the button below to get started.

Roads and Postcodes in Moreland
Navigate through our locations to find the location of your next house in Moreland, Gloucester for sale or to rent.
Property price trends in Moreland
According to the latest Land Registry data, the average home in Moreland sold for £200,666 in 2026. That figure comes from a substantial record of 6,111 sales logged over the past 31 years.
Prices have fallen back over the last three years. Compared with 2023, when the typical sale came in around £223,845, that's a fall of roughly 10.4%.
Looking back five years, average prices are up about 4.7% since 2021, a gain of around £9,018 in cash terms.
Zoom out to the past decade for the fuller picture. Back in 2016, homes here averaged £158,129, so the typical sold price has climbed about 26.9% since then, roughly 2.4% a year. Stretch the view to fifteen years and that annual pace edges up closer to 3.2%.
Frequently asked questions about Moreland
What is the average price for a property for sale in Moreland?
The average price for a property for sale in Moreland is £221,077. This amount is 22% lower than the average price in Gloucester. There are 1,540 property listings for sale in Moreland.
What streets have the most expensive properties for sale in Moreland?
The streets with the most expensive properties for sale in Moreland are King Edwards Avenue at an average of £346,500, Stroud Road at an average of £336,000 and Henley Place at an average of £331,666.
What streets have the most affordable properties for sale in Moreland?
The streets with the most affordable properties for sale in Moreland are Barnaby Close at an average of £129,250, Robinhood Street at an average of £156,244 and Theresa Street at an average of £156,250.
Which train stations are available in or near Moreland?
Some of the train stations available in or near Moreland are Gloucester, Cheltenham Spa and Stonehouse.
Property Price Paid in Moreland by Year
The average sold property price by year was:
| Year | Average Sold Price | Price Change |
Sold Properties
|
|---|---|---|---|
| 2026 | £200,666 | -11% |
18 Properties |
| 2025 | £223,661 | 2% |
151 Properties |
| 2024 | £218,862 | -2% |
149 Properties |
| 2023 | £223,845 | 3% |
111 Properties |
| 2022 | £216,678 | 12% |
165 Properties |
| 2021 | £191,648 | 0,3% |
229 Properties |
| 2020 | £190,998 | 6% |
129 Properties |
| 2019 | £178,658 | 0,2% |
154 Properties |
| 2018 | £178,249 | 6% |
185 Properties |
| 2017 | £168,421 | 6% |
177 Properties |
Property Price per Property Type in Moreland
Here you can find historic sold price data in order to help with your property search.
The average Property Paid Price for specific property types in the last three years are:
| Property Type | Average Sold Price | Sold Properties |
|---|---|---|
| Flat | £122,007.00 | 32 Flats |
| Semi Detached House | £253,285.00 | 188 Semi Detached Houses |
| Detached House | £353,947.00 | 23 Detached Houses |
| Terraced House | £189,136.00 | 186 Terraced Houses |
