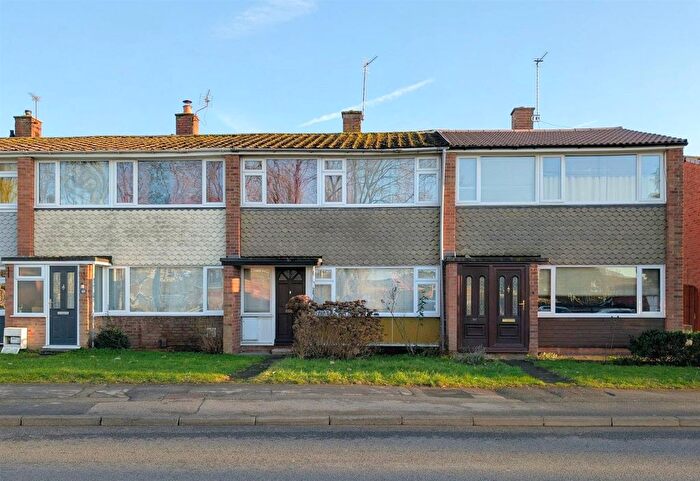
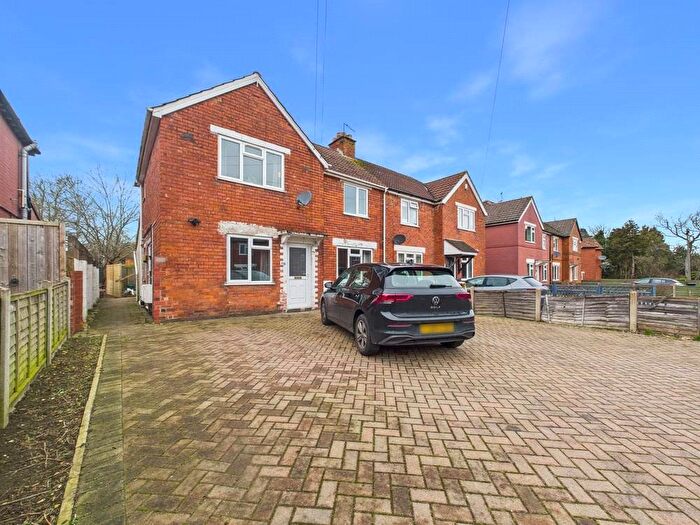
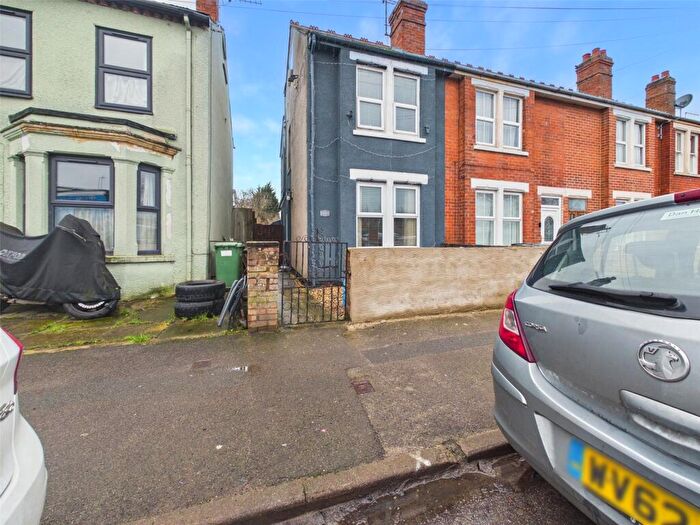
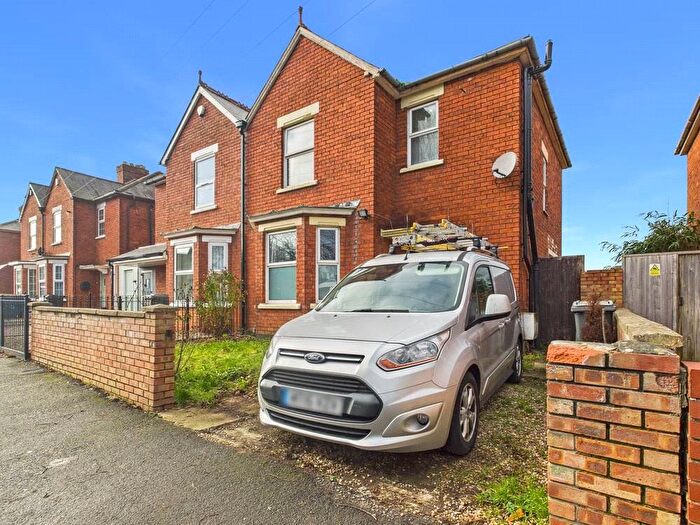
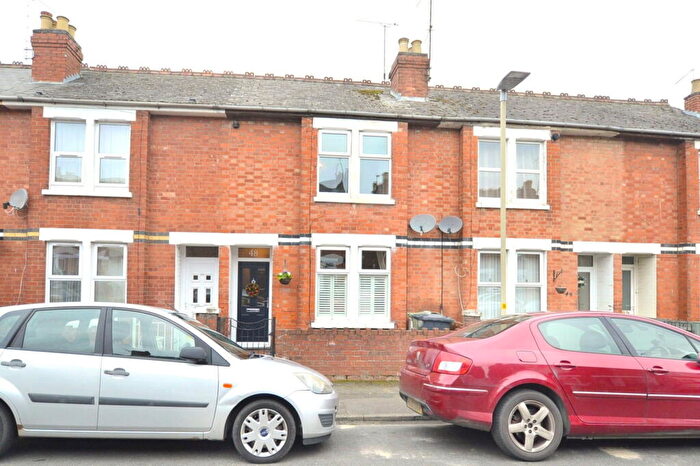
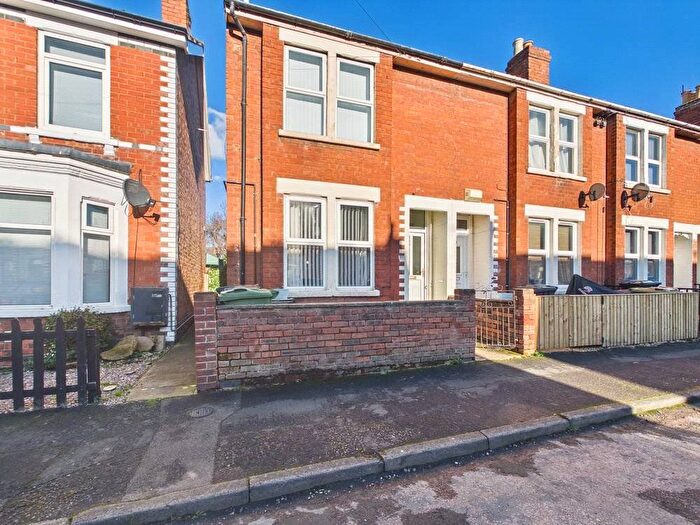
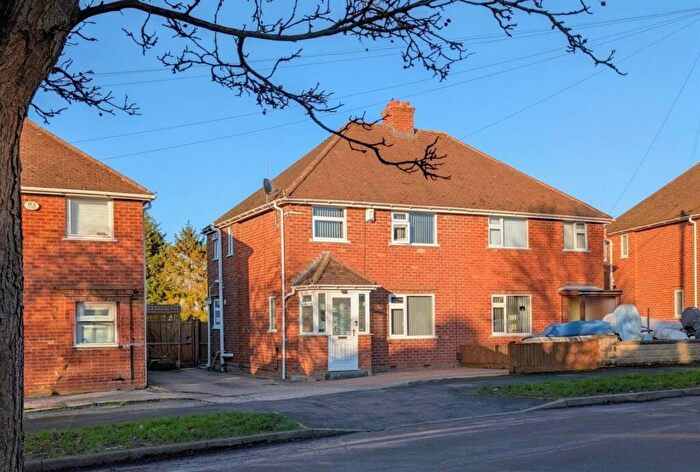
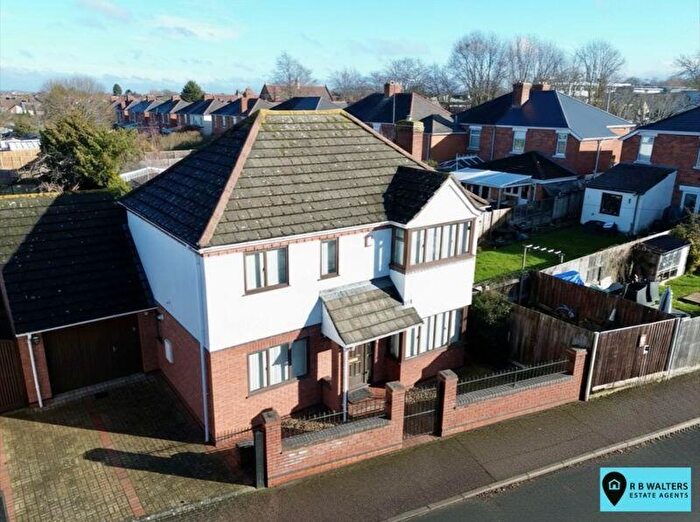
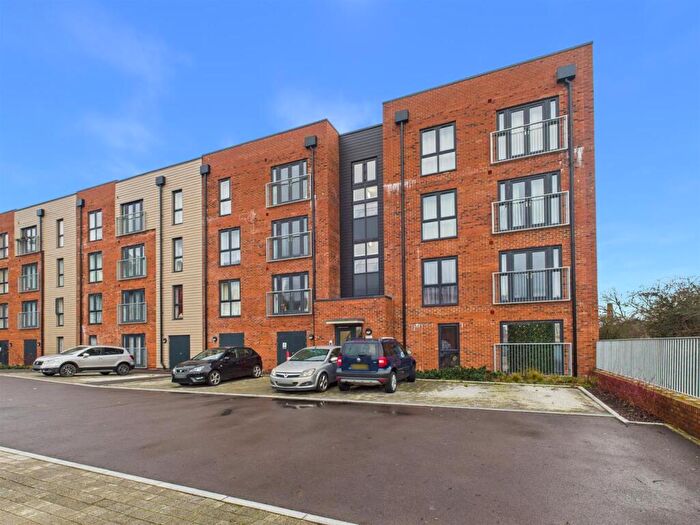
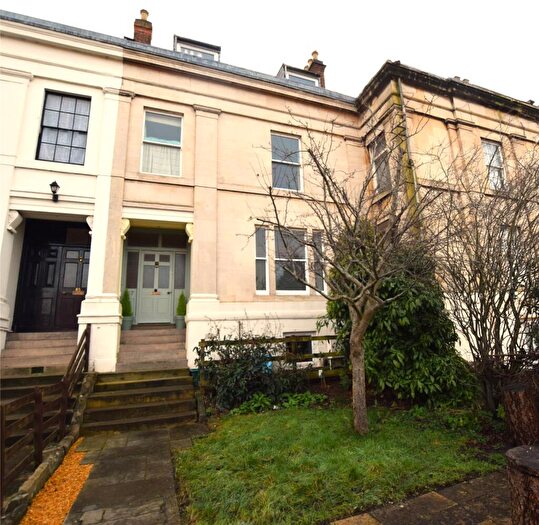
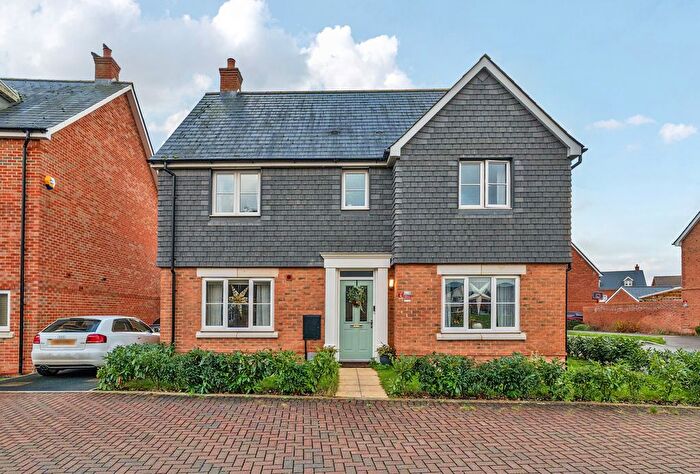
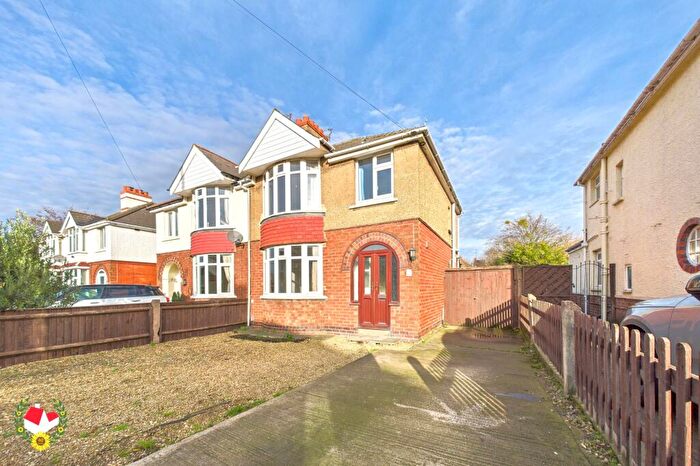
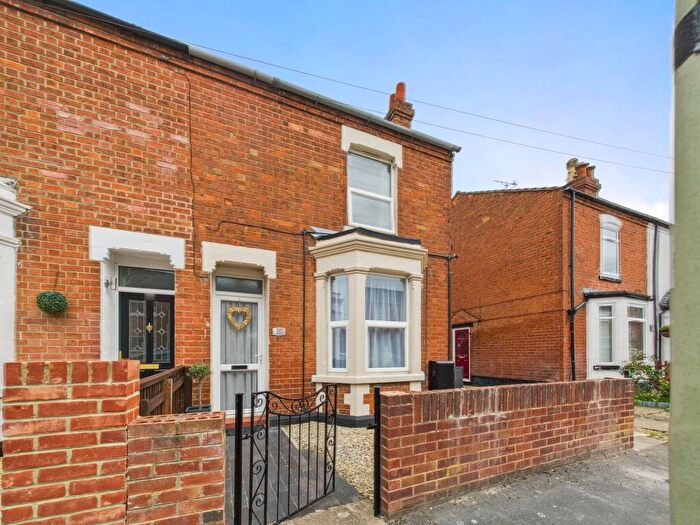
Houses for sale & to rent in Podsmead, Gloucester
House Prices in Podsmead
Properties in Podsmead have an average house price of £294,626.00 and had 144 Property Transactions within the last 3 years¹.
Podsmead is an area in Gloucester, Gloucestershire with 1,283 households², where the most expensive property was sold for £600,000.00.
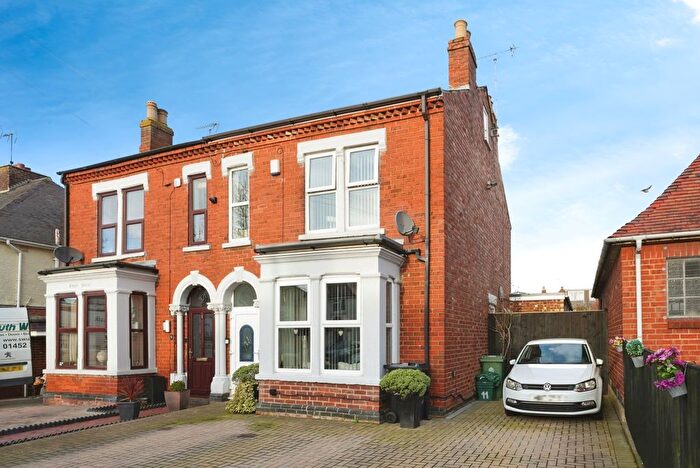
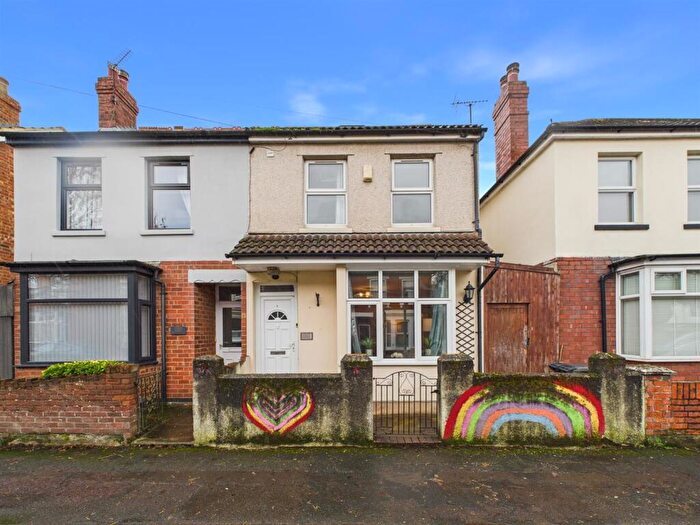
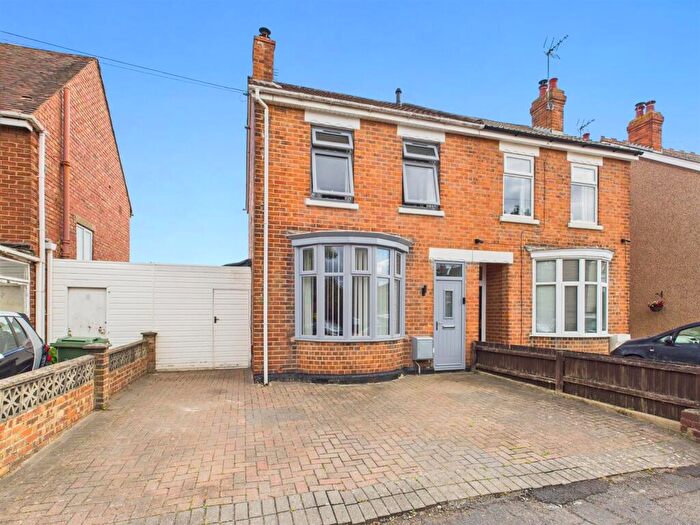
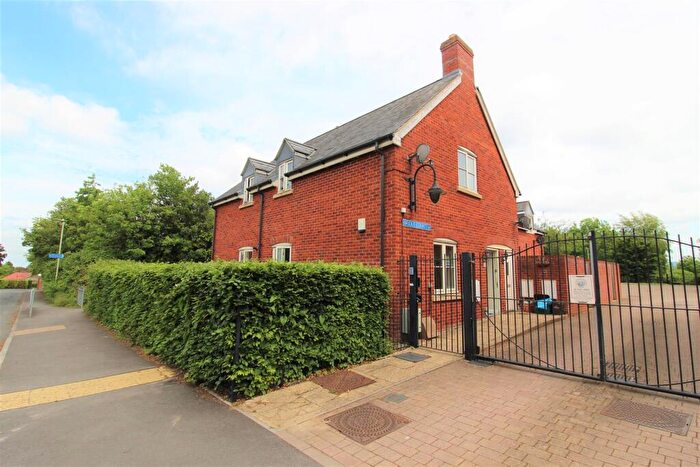
Properties for sale in Podsmead
Roads and Postcodes in Podsmead
Navigate through our locations to find the location of your next house in Podsmead, Gloucester for sale or to rent.
| Streets | Postcodes |
|---|---|
| Ashville Road | GL2 5DA GL2 5ET GL2 5EU |
| Badger Vale Court | GL2 5FQ |
| Barron Way | GL1 5NY |
| Betjeman Close | GL2 5BP |
| Bristol Road | GL1 5TL GL1 5TD GL2 5DB GL2 5DD GL2 5DH GL2 5DN GL2 5YB GL2 5GR |
| Burns Avenue | GL2 5BJ |
| Byard Road | GL2 5DF |
| Byron Avenue | GL2 5AF GL2 5AG |
| Canada Wharf | GL1 5TE |
| Chaucer Close | GL1 5PF |
| Cooke Close | GL1 5DN |
| Corolin Road | GL2 5DQ |
| Dreadnaught Drive | GL1 5RA |
| Duke Of Beaufort Court | GL1 5UB |
| Eliot Close | GL2 5BS |
| Emery Avenue | GL1 5QN GL1 5QP GL1 5QU |
| Empire Way | GL2 5HY |
| French Burr Place | GL1 5PH |
| Harvey Close | GL2 5FL |
| Hathaway Close | GL2 5AJ |
| Keats Avenue | GL2 5BG GL2 5BH GL2 5BQ |
| Kipling Close | GL2 5HP |
| Laburnum Road | GL1 5PG GL1 5PQ |
| Lime Tree Court | GL1 5NX |
| Lower Tuffley Lane | GL2 5AQ GL2 5DE GL2 5AZ GL2 5DP GL2 5DT GL2 5EE |
| Mansell Close | GL2 5FN |
| Manu Marble Way | GL1 5QZ |
| Masefield Avenue | GL2 5AY GL2 5BA |
| Millstone Way | GL1 5QW GL1 5QX GL1 5RB GL1 5QY |
| Milton Avenue | GL2 5AP GL2 5AR GL2 5AS |
| Neven Place | GL1 5NF |
| New Dawn View | GL1 5PJ |
| Newark Road | GL1 5TW |
| Partridge Close | GL2 5FG |
| Pearce Way | GL2 5YD |
| Podsmead Place | GL1 5PD |
| Podsmead Road | GL1 5PA GL1 5PB GL2 5AB GL2 5AD GL2 5BW GL1 5UA GL2 5AA GL2 5AE |
| Poplar Close | GL1 5TX |
| Ramsdale Road | GL2 5FE |
| Redwood Close | GL1 5TZ |
| Romney Close | GL1 5NT |
| Scott Avenue | GL2 5BD GL2 5BE GL2 5BB |
| Shakespeare Avenue | GL2 5AH GL2 5AL GL2 5AW GL2 5BL GL2 5BN |
| Shelley Avenue | GL2 5AT |
| St Albans Road | GL2 5FW |
| Stratford Close | GL2 5AN |
| Stroud Road | GL1 5LQ |
| Sunnycroft Mews | GL1 5LP |
| Sycamore Close | GL1 5TY |
| Tennyson Avenue | GL2 5AU GL2 5AX |
| The Greenway | GL1 5NU |
| Thornhill Close | GL1 5NQ |
| Tuffley Avenue | GL1 5LT GL1 5LX GL1 5LZ GL1 5NS |
| Tuffley Crescent | GL1 5ND GL1 5NE |
| Uphill Place | GL1 5PE |
| Woodpecker Road | GL2 5FF |
| Woodrow Way | GL2 5DX |
| Woodrow Way Trade Park | GL2 5GL |
Transport near Podsmead
- FAQ
- Price Paid By Year
- Property Type Price
Frequently asked questions about Podsmead
What is the average price for a property for sale in Podsmead?
The average price for a property for sale in Podsmead is £294,626. This amount is 4% higher than the average price in Gloucester. There are 889 property listings for sale in Podsmead.
What streets have the most expensive properties for sale in Podsmead?
The streets with the most expensive properties for sale in Podsmead are Lime Tree Court at an average of £560,000, Sunnycroft Mews at an average of £525,000 and Podsmead Road at an average of £416,875.
What streets have the most affordable properties for sale in Podsmead?
The streets with the most affordable properties for sale in Podsmead are Byron Avenue at an average of £93,750, Shakespeare Avenue at an average of £129,833 and Burns Avenue at an average of £131,000.
Which train stations are available in or near Podsmead?
Some of the train stations available in or near Podsmead are Gloucester, Stonehouse and Stroud.
Property Price Paid in Podsmead by Year
The average sold property price by year was:
| Year | Average Sold Price | Price Change |
Sold Properties
|
|---|---|---|---|
| 2025 | £273,071 | -10% |
42 Properties |
| 2024 | £301,140 | -2% |
57 Properties |
| 2023 | £306,492 | 2% |
45 Properties |
| 2022 | £299,455 | 10% |
69 Properties |
| 2021 | £270,353 | -2% |
92 Properties |
| 2020 | £275,289 | -9% |
56 Properties |
| 2019 | £299,340 | 19% |
79 Properties |
| 2018 | £243,459 | 14% |
63 Properties |
| 2017 | £210,022 | 2% |
42 Properties |
| 2016 | £205,512 | 14% |
19 Properties |
| 2015 | £176,833 | 2% |
33 Properties |
| 2014 | £173,698 | 15% |
30 Properties |
| 2013 | £148,247 | -3% |
22 Properties |
| 2012 | £153,214 | 22% |
24 Properties |
| 2011 | £120,051 | -27% |
34 Properties |
| 2010 | £151,933 | 8% |
15 Properties |
| 2009 | £139,879 | -21% |
22 Properties |
| 2008 | £168,593 | 10% |
16 Properties |
| 2007 | £150,939 | 8% |
43 Properties |
| 2006 | £138,935 | -4% |
42 Properties |
| 2005 | £144,094 | -1% |
37 Properties |
| 2004 | £146,219 | 12% |
35 Properties |
| 2003 | £128,789 | 21% |
41 Properties |
| 2002 | £101,813 | 18% |
48 Properties |
| 2001 | £83,643 | -5% |
39 Properties |
| 2000 | £87,633 | 8% |
28 Properties |
| 1999 | £80,302 | 11% |
37 Properties |
| 1998 | £71,171 | 21% |
33 Properties |
| 1997 | £56,170 | 15% |
32 Properties |
| 1996 | £47,661 | -31% |
21 Properties |
| 1995 | £62,425 | - |
14 Properties |
Property Price per Property Type in Podsmead
Here you can find historic sold price data in order to help with your property search.
The average Property Paid Price for specific property types in the last three years are:
| Property Type | Average Sold Price | Sold Properties |
|---|---|---|
| Semi Detached House | £301,060.00 | 81 Semi Detached Houses |
| Detached House | £385,444.00 | 18 Detached Houses |
| Terraced House | £263,218.00 | 40 Terraced Houses |
| Flat | £114,700.00 | 5 Flats |

