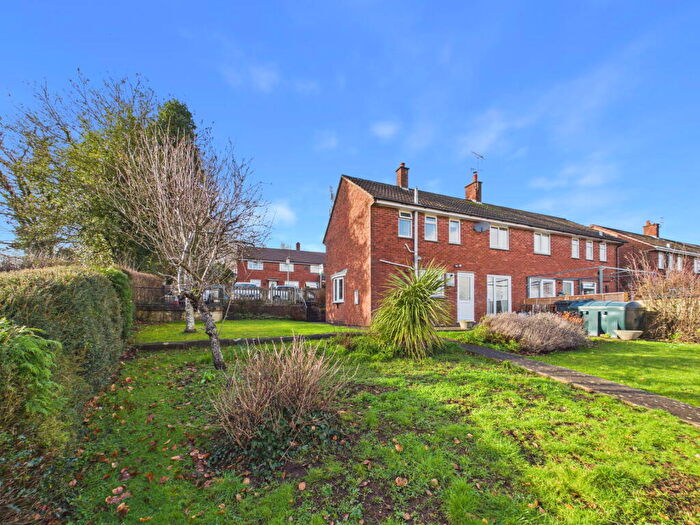
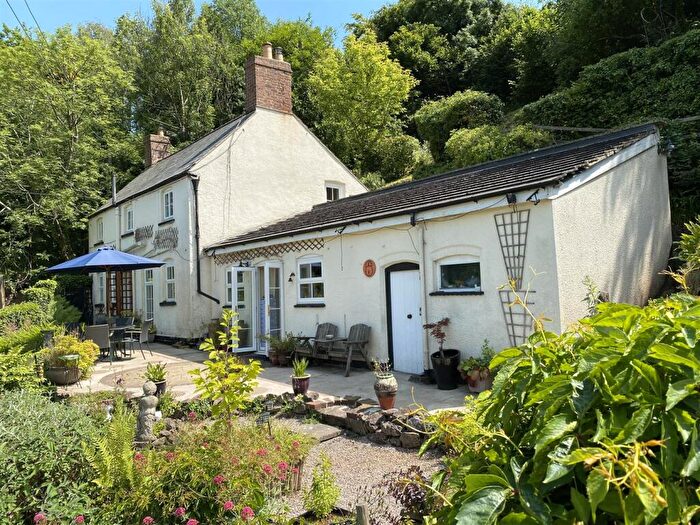
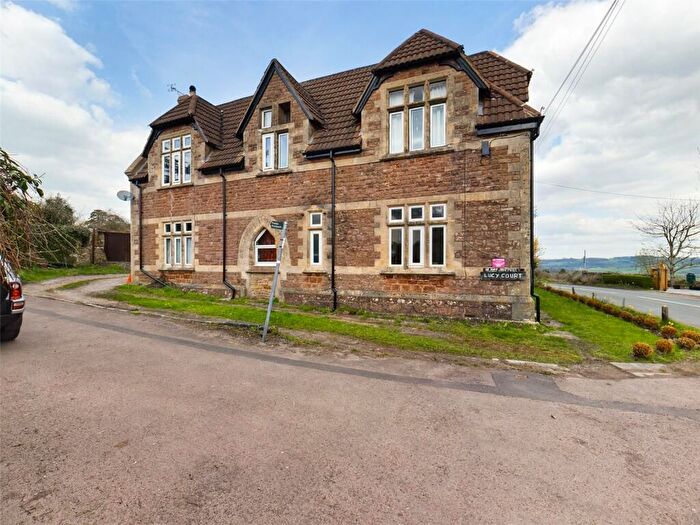
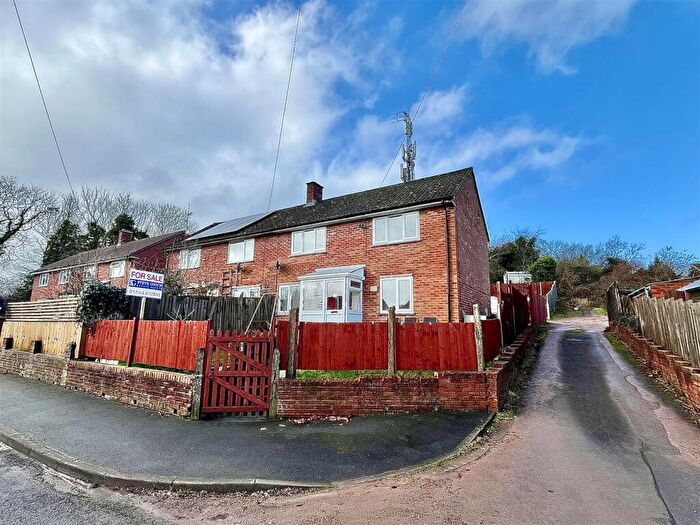
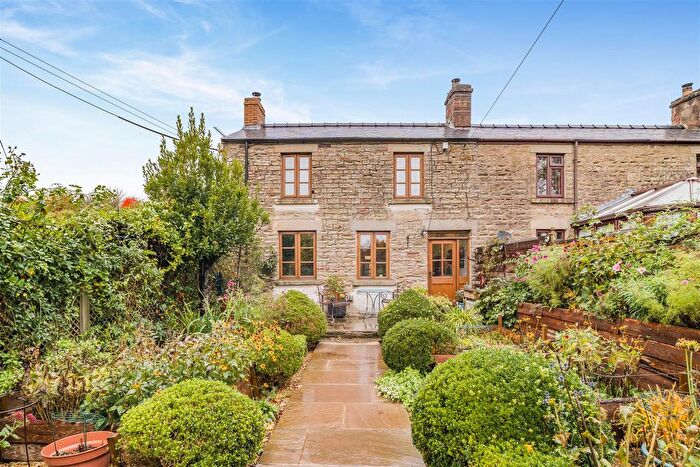
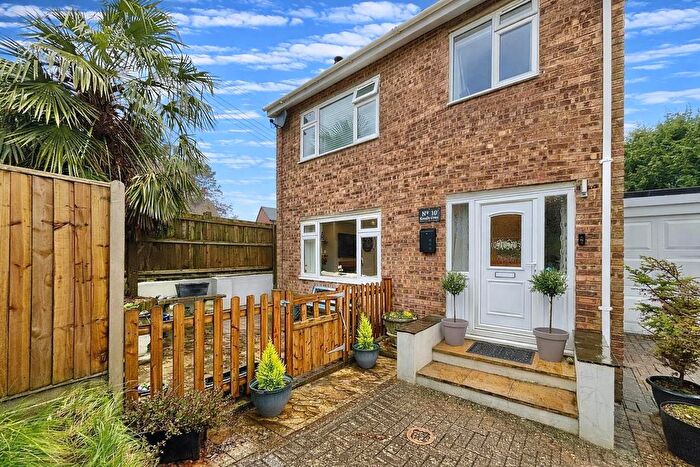
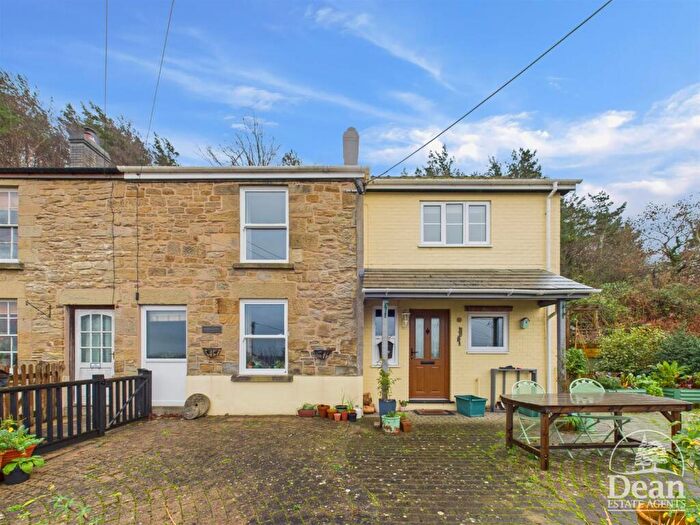
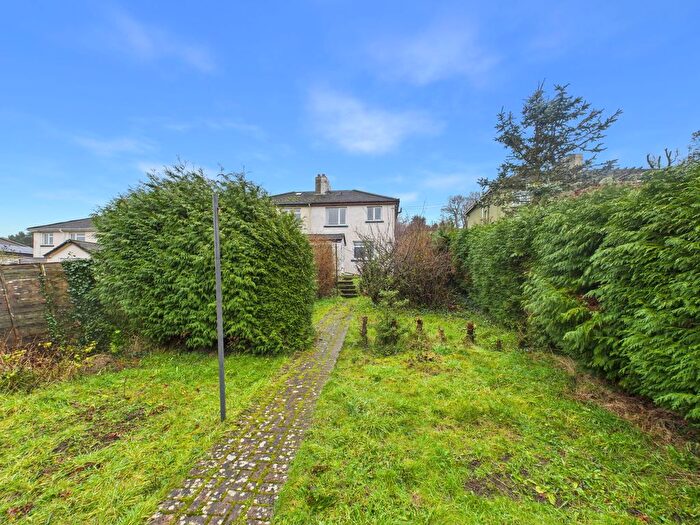
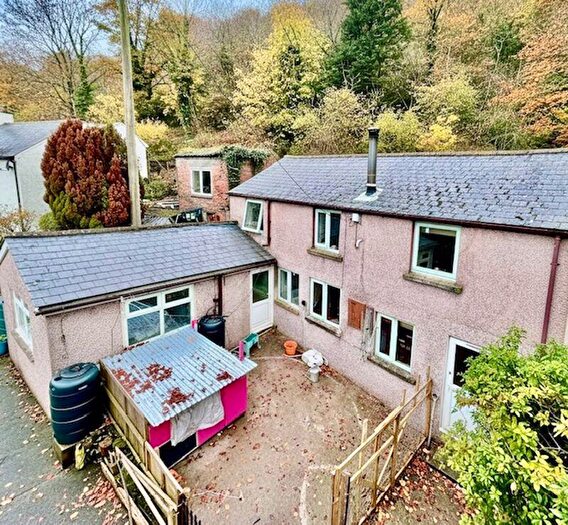
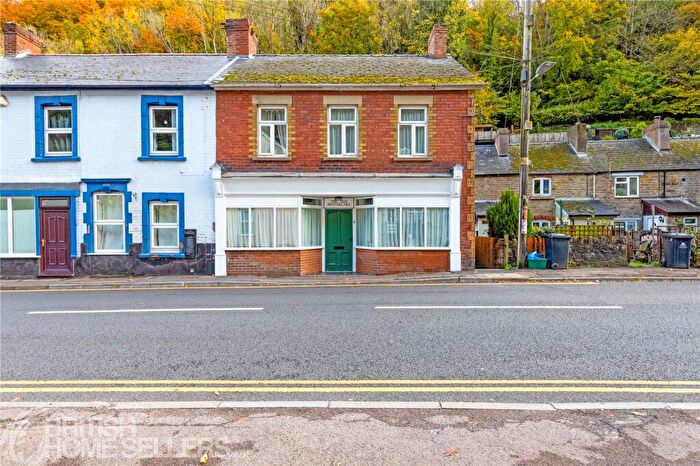
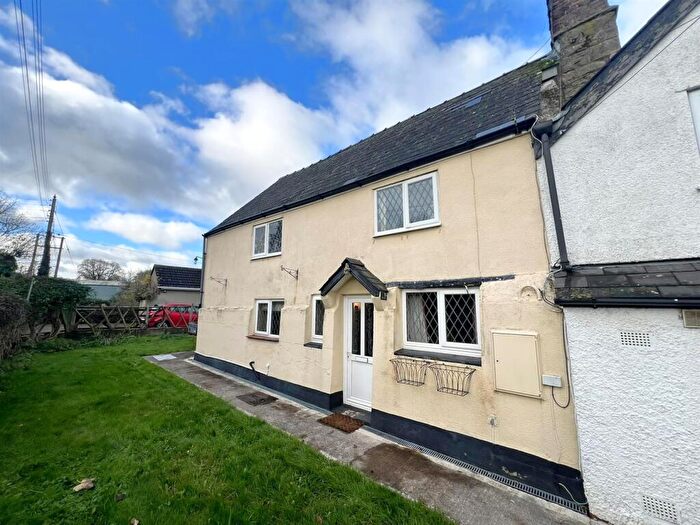
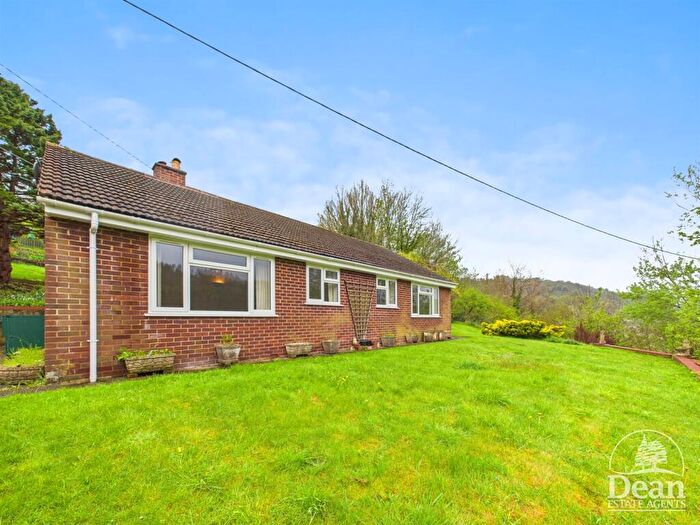
Houses for sale & to rent in Lydbrook And Ruardean, Lydbrook
House Prices in Lydbrook And Ruardean
Properties in Lydbrook And Ruardean have an average house price of £316,736.00 and had 88 Property Transactions within the last 3 years¹.
Lydbrook And Ruardean is an area in Lydbrook, Gloucestershire with 930 households², where the most expensive property was sold for £815,000.00.
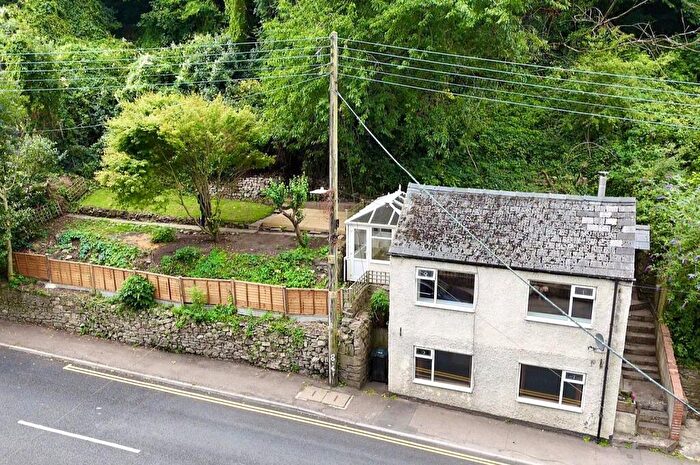
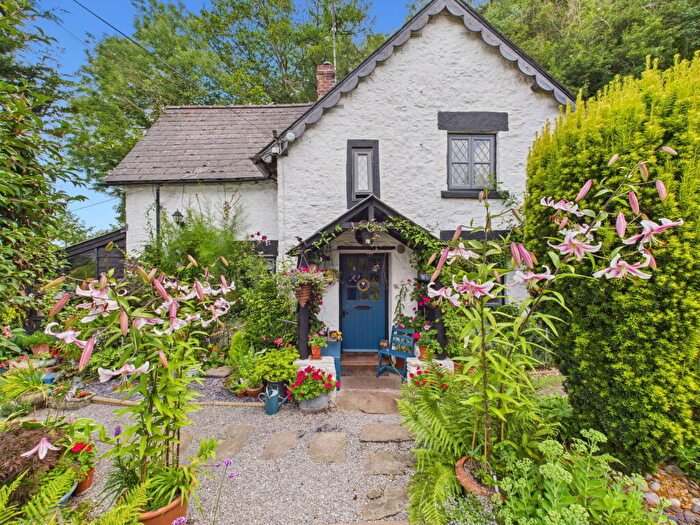
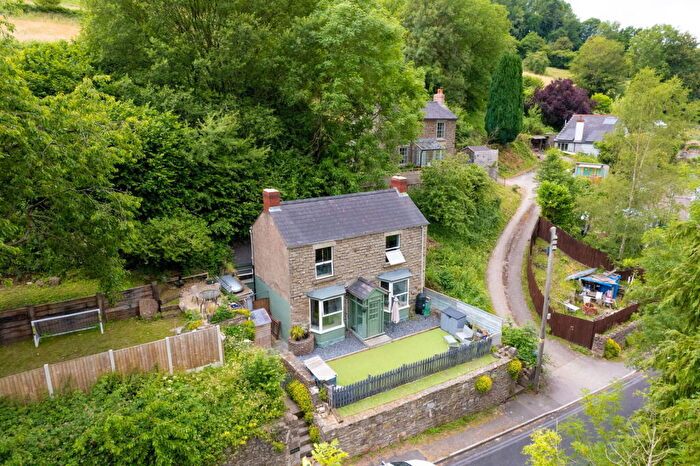
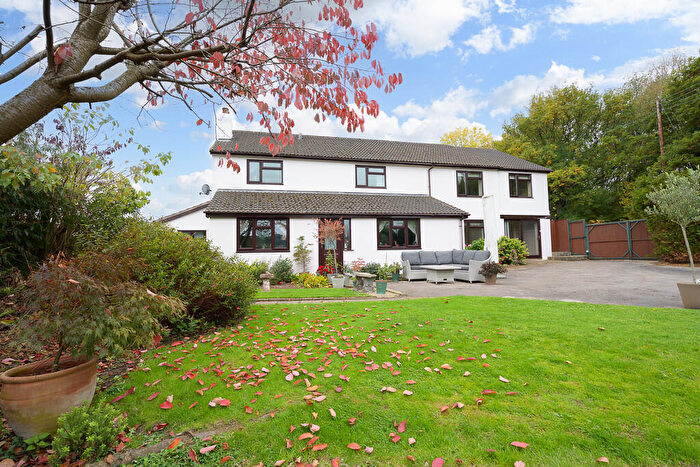
Properties for sale in Lydbrook And Ruardean
Roads and Postcodes in Lydbrook And Ruardean
Navigate through our locations to find the location of your next house in Lydbrook And Ruardean, Lydbrook for sale or to rent.
| Streets | Postcodes |
|---|---|
| Bell Hill | GL17 9SA |
| Bishopwood | GL17 9NY |
| Camomile Green | GL17 9LN GL17 9QA |
| Church Hill | GL17 9SN GL17 9SW |
| Church Road | GL17 9SH |
| Coppice Road | GL17 9RJ |
| Edwards Close | GL17 9SY |
| Forest Rise | GL17 9SQ |
| Forge Hill | GL17 9QS GL17 9QT |
| Forge Row | GL17 9NP |
| Garage Cottage | GL17 9QU |
| Greenfield Close | GL17 9RD |
| Greenfield Road | GL17 9RB GL17 9RE |
| Hangerberry | GL17 9PU GL17 9QG |
| Harveys Meadow | GL17 9SF |
| Hatton Close | GL17 9QJ |
| Hawsley | GL17 9SR GL17 9SS |
| High Row | GL17 9PH |
| Hillside Terrace | GL17 9QZ |
| Joys Green Road | GL17 9SX |
| Lower Lydbrook | GL17 9NU |
| Main Road | GL17 9QE |
| Merthyr Terrace | GL17 9PT |
| Mill Row | GL17 9NR |
| New Road | GL17 9PS |
| Orchard Road | GL17 9RA |
| Proberts Barn Lane | GL17 9NE |
| Ridge Place | GL17 9QQ |
| Robinsons Lane | GL17 9QN |
| Rocks Road | GL17 9RG GL17 9RQ |
| School Crescent | GL17 9RN |
| School Road | GL17 9QX GL17 9QY |
| Squires Road | GL17 9QL |
| Stowfield | GL17 9NF GL17 9PD |
| Stowfield Road | GL17 9NJ |
| The Boarts | GL17 9QB |
| The Branch | GL17 9SD |
| The Forge | GL17 9PG |
| The Incline | GL17 9QR |
| The Moorwood | GL17 9SU |
| The Reddings | GL17 9ST |
| The Rocks | GL17 9RF |
| Timber Tump | GL17 9SP |
| Uphill Road | GL17 9QW |
| Upper Lydbrook | GL17 9PX GL17 9PY |
| Upper Stowfield Road | GL17 9PB |
| Valley Road | GL17 9QH |
| Vention Lane | GL17 9RL |
| Viaduct Villas | GL17 9NT |
| West View | GL17 9RW |
| Woodland View | GL17 9SZ |
| Worrall Hill | GL17 9QD GL17 9QF |
| Wye View Road | GL17 9RY |
| GL17 9LG GL17 9LH GL17 9LJ GL17 9LL GL17 9LP GL17 9LQ GL17 9LW GL17 9NA GL17 9NS GL17 9NW GL17 9PP GL17 9PZ GL17 9SB GL17 9SE |
Transport near Lydbrook And Ruardean
- FAQ
- Price Paid By Year
- Property Type Price
Frequently asked questions about Lydbrook And Ruardean
What is the average price for a property for sale in Lydbrook And Ruardean?
The average price for a property for sale in Lydbrook And Ruardean is £316,736. This amount is 0.88% lower than the average price in Lydbrook. There are 394 property listings for sale in Lydbrook And Ruardean.
What streets have the most expensive properties for sale in Lydbrook And Ruardean?
The streets with the most expensive properties for sale in Lydbrook And Ruardean are Church Hill at an average of £629,833, The Boarts at an average of £560,000 and Woodland View at an average of £485,500.
What streets have the most affordable properties for sale in Lydbrook And Ruardean?
The streets with the most affordable properties for sale in Lydbrook And Ruardean are The Branch at an average of £128,000, Orchard Road at an average of £149,950 and Greenfield Close at an average of £160,000.
Which train stations are available in or near Lydbrook And Ruardean?
Some of the train stations available in or near Lydbrook And Ruardean are Lydney, Cam and Dursley and Stonehouse.
Property Price Paid in Lydbrook And Ruardean by Year
The average sold property price by year was:
| Year | Average Sold Price | Price Change |
Sold Properties
|
|---|---|---|---|
| 2025 | £350,410 | 17% |
24 Properties |
| 2024 | £290,095 | -11% |
36 Properties |
| 2023 | £322,124 | -6% |
28 Properties |
| 2022 | £342,165 | 29% |
30 Properties |
| 2021 | £244,534 | -24% |
50 Properties |
| 2020 | £302,843 | 34% |
32 Properties |
| 2019 | £200,254 | -36% |
31 Properties |
| 2018 | £271,738 | 19% |
26 Properties |
| 2017 | £219,940 | 15% |
46 Properties |
| 2016 | £187,623 | 2% |
39 Properties |
| 2015 | £183,090 | 3% |
30 Properties |
| 2014 | £177,048 | -5% |
39 Properties |
| 2013 | £185,803 | 4% |
26 Properties |
| 2012 | £179,039 | -6% |
24 Properties |
| 2011 | £189,881 | -6% |
19 Properties |
| 2010 | £201,384 | 19% |
26 Properties |
| 2009 | £162,884 | -11% |
19 Properties |
| 2008 | £180,201 | -5% |
26 Properties |
| 2007 | £188,411 | 1% |
45 Properties |
| 2006 | £186,803 | 9% |
55 Properties |
| 2005 | £170,426 | 3% |
45 Properties |
| 2004 | £165,917 | 11% |
51 Properties |
| 2003 | £147,820 | 21% |
43 Properties |
| 2002 | £116,730 | 15% |
70 Properties |
| 2001 | £99,137 | 15% |
53 Properties |
| 2000 | £84,043 | 10% |
44 Properties |
| 1999 | £75,921 | -6% |
56 Properties |
| 1998 | £80,198 | 33% |
45 Properties |
| 1997 | £53,710 | 3% |
50 Properties |
| 1996 | £52,312 | - |
37 Properties |
| 1995 | £52,327 | - |
29 Properties |
Property Price per Property Type in Lydbrook And Ruardean
Here you can find historic sold price data in order to help with your property search.
The average Property Paid Price for specific property types in the last three years are:
| Property Type | Average Sold Price | Sold Properties |
|---|---|---|
| Semi Detached House | £246,841.00 | 36 Semi Detached Houses |
| Detached House | £392,522.00 | 44 Detached Houses |
| Terraced House | £214,437.00 | 8 Terraced Houses |

