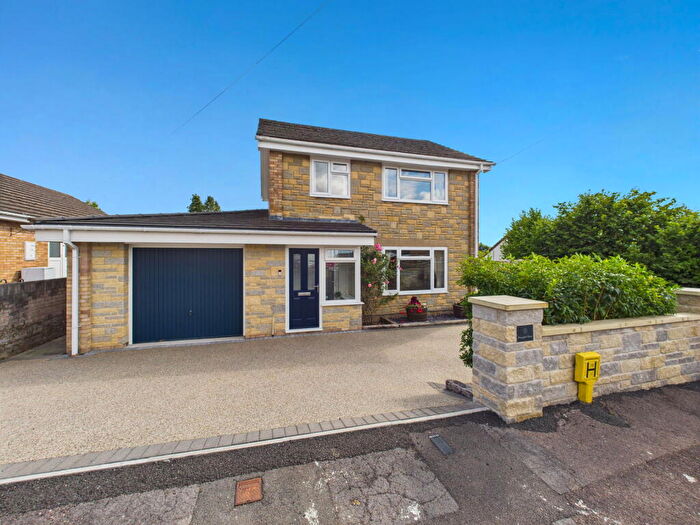
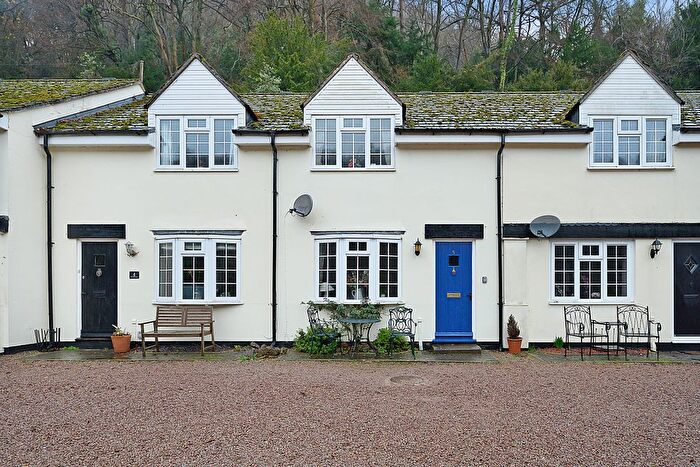
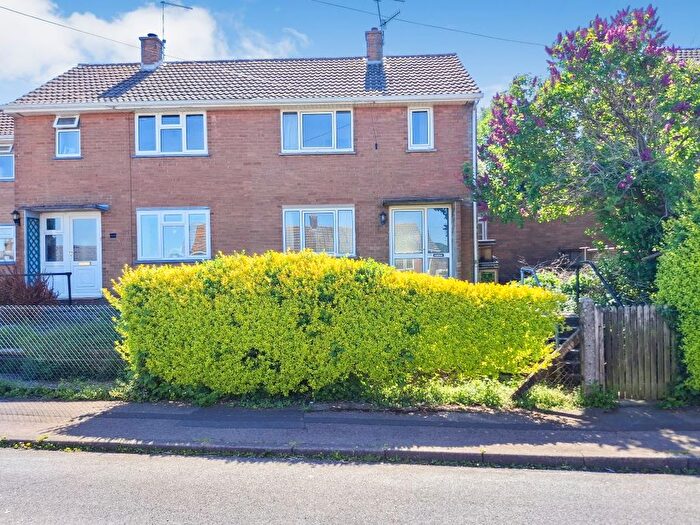
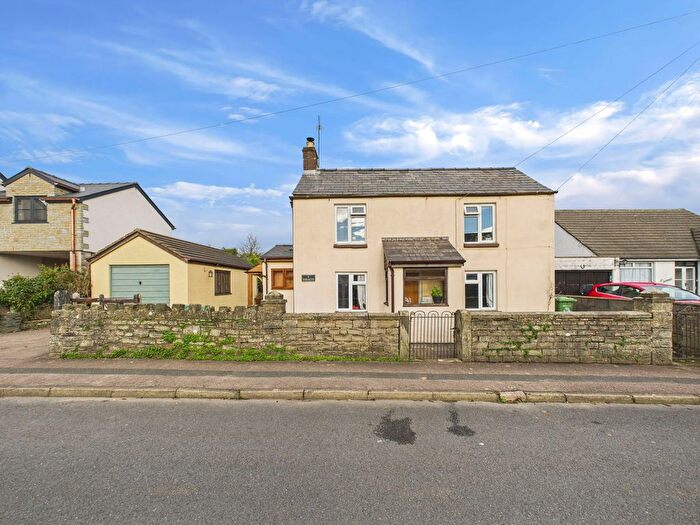
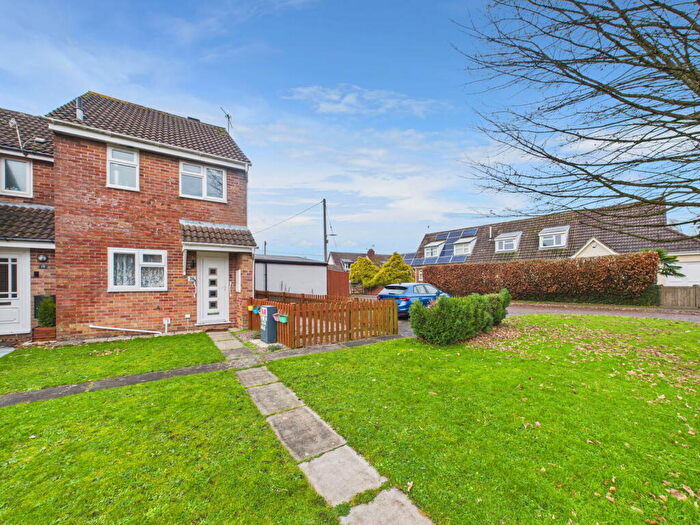
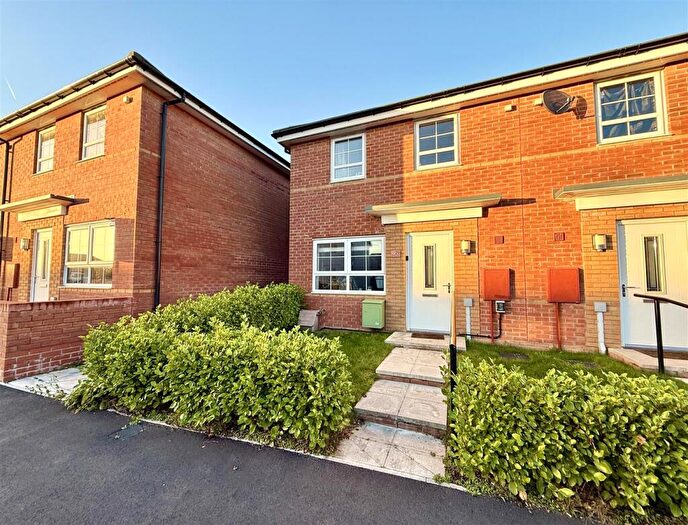
Houses for sale & to rent in Christchurch And English Bicknor, Coleford
House Prices in Christchurch And English Bicknor
Properties in Christchurch And English Bicknor have an average house price of £403,646.00 and had 63 Property Transactions within the last 3 years¹.
Christchurch And English Bicknor is an area in Coleford, Gloucestershire with 599 households², where the most expensive property was sold for £850,000.00.
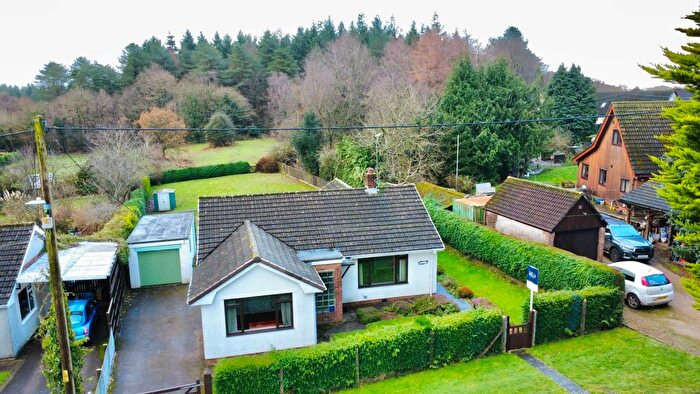
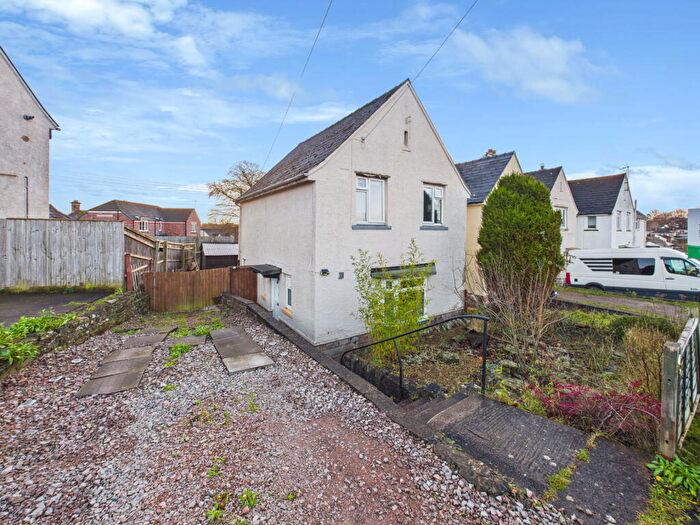
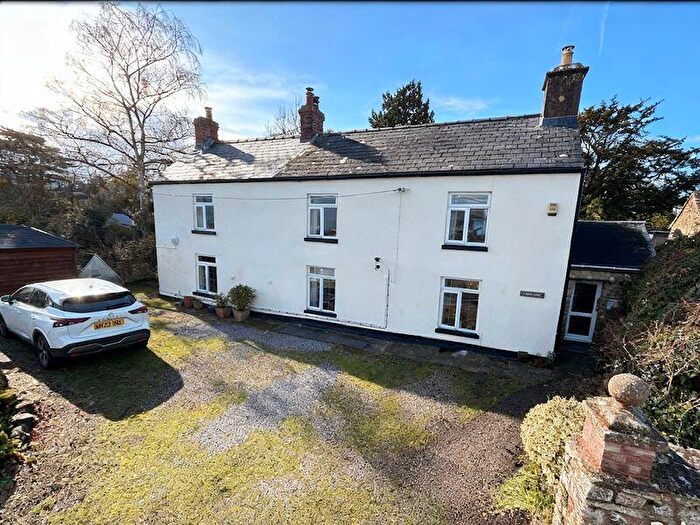
Properties for sale in Christchurch And English Bicknor
Roads and Postcodes in Christchurch And English Bicknor
Navigate through our locations to find the location of your next house in Christchurch And English Bicknor, Coleford for sale or to rent.
| Streets | Postcodes |
|---|---|
| Alm Cottages | GL16 7PG |
| Ambrey Cottages | GL16 7PF |
| Beech Well Lane | GL16 7HA |
| Belmont Lane | GL16 7AX GL16 7FA |
| Bicknor Street | GL16 7PH |
| Braceland | GL16 7NP |
| Bracelands Drive | GL16 7NN |
| Brecon Way | GL16 7EW |
| Brindsey Lane | GL16 8PE |
| Brummels Drive | GL16 7AY |
| Cannop Villas | GL16 7EH |
| Carters Piece | GL16 7ES |
| Chapel Walk | GL16 7EP |
| Church Hill Close | GL16 7PN |
| Conway Court | GL16 7DY |
| Coopers Road | GL16 7AL |
| Council Villas | GL16 7PA |
| Cross Barn | GL16 7PP |
| Crown Cottages | GL16 7EQ |
| Eastbach | GL16 7ET GL16 7EU |
| Forest Close | GL16 8PG |
| Highbeech Road | GL16 7EZ |
| Hillersland | GL16 7NY |
| Hillersland Lane | GL16 7NU |
| Hoarthorn Road | GL16 7EY |
| Joyford Hill | GL16 7AH |
| Lucy Court | GL16 7PQ |
| Malvern Way | GL16 7DZ |
| Maze Walk | GL16 7AW |
| Mile End | GL16 7EN |
| Monmouth Road | GL16 7HB |
| Murrells Road | GL16 7PL |
| Newland | GL16 8NR |
| Nine Wells Close | GL16 7BZ |
| Nine Wells Road | GL16 7AT |
| Orchard Close | GL16 7PD |
| Orchard Way | GL16 7AQ |
| Park Road | GL16 7AZ GL16 7BB |
| Ready Penny | GL16 7NX |
| Reddings Lane | GL16 8NZ |
| Redhouse Lane | GL16 7PB |
| Speech House Road | GL16 7EG |
| The Lonk | GL16 7AJ |
| The Oaks | GL16 7NE |
| Tillis View | GL16 8PH |
| Wellmeadow | GL16 8PQ |
| Whippingtons Corner | GL16 8NT |
| Woodland Road | GL16 7NR |
| GL16 7AR GL16 7AS GL16 7NS GL16 7NT GL16 7NZ GL16 8NU GL16 8NX GL16 8NY GL16 8PA GL16 8PD |
Transport near Christchurch And English Bicknor
- FAQ
- Price Paid By Year
- Property Type Price
Frequently asked questions about Christchurch And English Bicknor
What is the average price for a property for sale in Christchurch And English Bicknor?
The average price for a property for sale in Christchurch And English Bicknor is £403,646. This amount is 42% higher than the average price in Coleford. There are 1,452 property listings for sale in Christchurch And English Bicknor.
What streets have the most expensive properties for sale in Christchurch And English Bicknor?
The streets with the most expensive properties for sale in Christchurch And English Bicknor are Ready Penny at an average of £655,000, Nine Wells Road at an average of £640,000 and Newland at an average of £617,500.
What streets have the most affordable properties for sale in Christchurch And English Bicknor?
The streets with the most affordable properties for sale in Christchurch And English Bicknor are Conway Court at an average of £126,312, Redhouse Lane at an average of £190,000 and Whippingtons Corner at an average of £226,250.
Which train stations are available in or near Christchurch And English Bicknor?
Some of the train stations available in or near Christchurch And English Bicknor are Lydney, Chepstow and Cam and Dursley.
Property Price Paid in Christchurch And English Bicknor by Year
The average sold property price by year was:
| Year | Average Sold Price | Price Change |
Sold Properties
|
|---|---|---|---|
| 2025 | £392,500 | -1% |
6 Properties |
| 2024 | £396,771 | -10% |
22 Properties |
| 2023 | £435,886 | 9% |
11 Properties |
| 2022 | £397,958 | 4% |
24 Properties |
| 2021 | £381,461 | 8% |
27 Properties |
| 2020 | £351,178 | 7% |
25 Properties |
| 2019 | £326,990 | 6% |
22 Properties |
| 2018 | £306,550 | 15% |
29 Properties |
| 2017 | £262,093 | -15% |
23 Properties |
| 2016 | £300,704 | 8% |
31 Properties |
| 2015 | £277,307 | 6% |
21 Properties |
| 2014 | £260,886 | 10% |
22 Properties |
| 2013 | £235,335 | 3% |
17 Properties |
| 2012 | £227,922 | -19% |
18 Properties |
| 2011 | £270,633 | -11% |
15 Properties |
| 2010 | £300,375 | 9% |
12 Properties |
| 2009 | £273,305 | -8% |
19 Properties |
| 2008 | £295,791 | -6% |
12 Properties |
| 2007 | £314,077 | 11% |
27 Properties |
| 2006 | £279,590 | 20% |
33 Properties |
| 2005 | £222,689 | -3% |
22 Properties |
| 2004 | £229,201 | 30% |
41 Properties |
| 2003 | £161,242 | -10% |
33 Properties |
| 2002 | £176,633 | 15% |
31 Properties |
| 2001 | £150,942 | 30% |
19 Properties |
| 2000 | £106,381 | 14% |
30 Properties |
| 1999 | £91,136 | 6% |
29 Properties |
| 1998 | £85,263 | -2% |
26 Properties |
| 1997 | £87,360 | 22% |
33 Properties |
| 1996 | £67,803 | -26% |
13 Properties |
| 1995 | £85,705 | - |
17 Properties |
Property Price per Property Type in Christchurch And English Bicknor
Here you can find historic sold price data in order to help with your property search.
The average Property Paid Price for specific property types in the last three years are:
| Property Type | Average Sold Price | Sold Properties |
|---|---|---|
| Semi Detached House | £281,964.00 | 14 Semi Detached Houses |
| Detached House | £474,682.00 | 41 Detached Houses |
| Terraced House | £378,750.00 | 4 Terraced Houses |
| Flat | £126,312.00 | 4 Flats |

