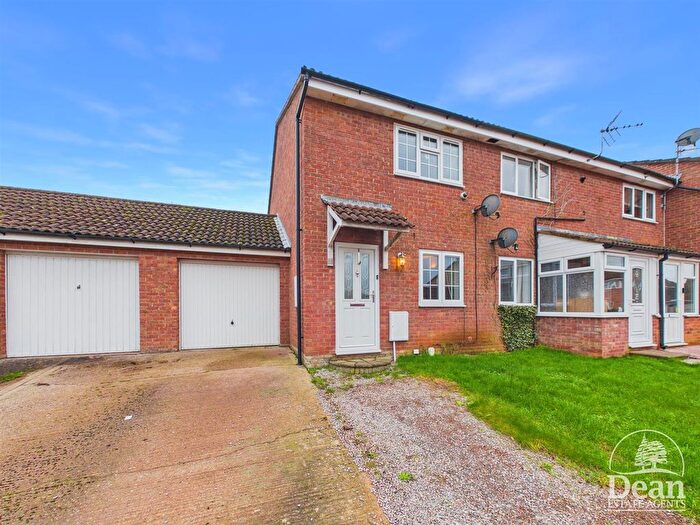
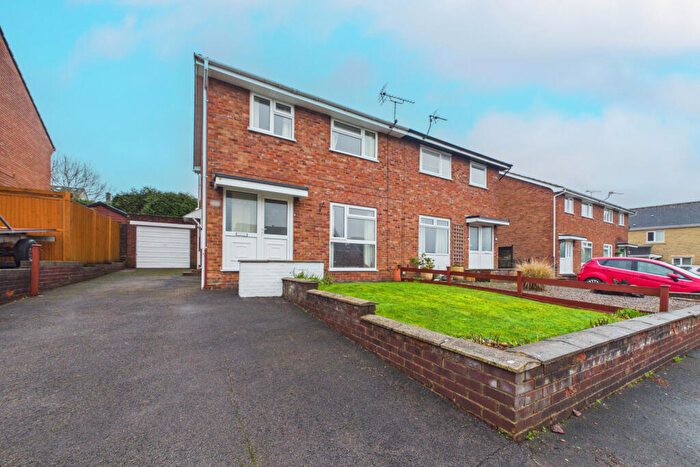
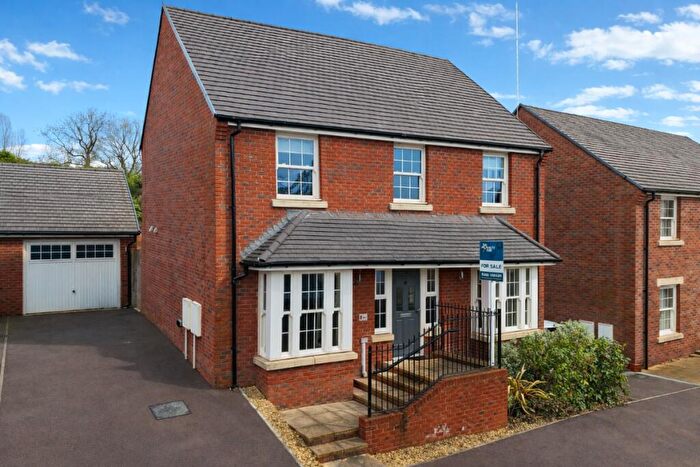
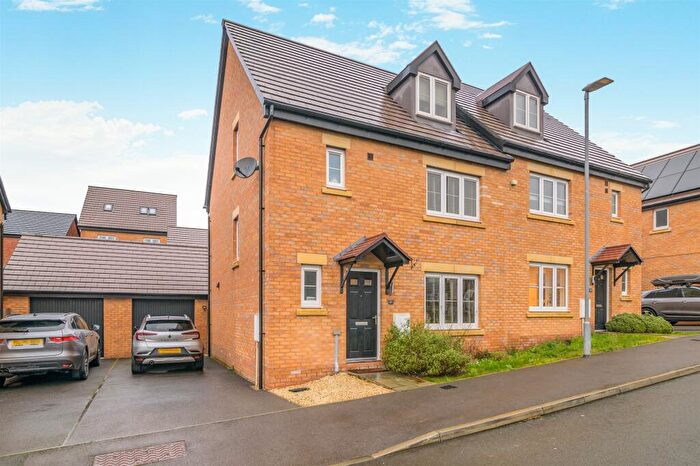
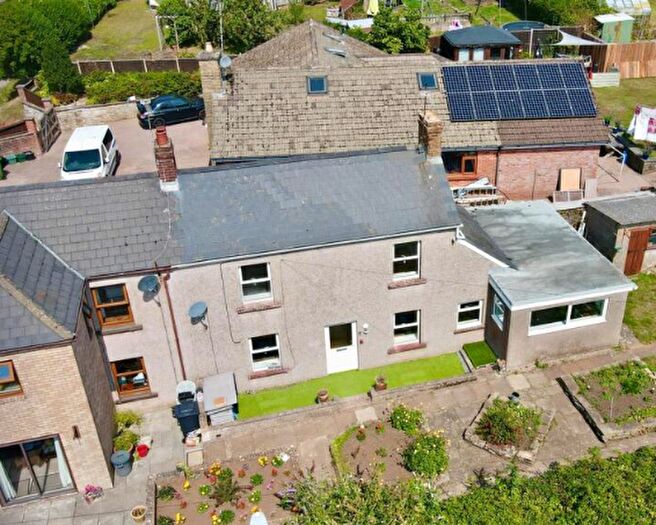
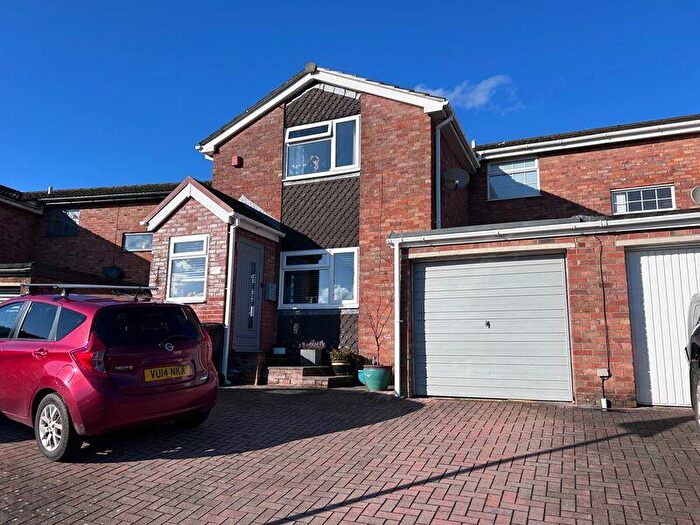
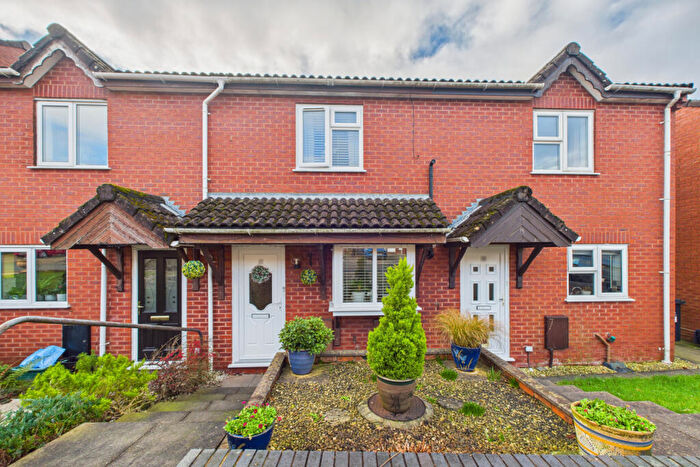
Houses for sale & to rent in Pillowell, Lydney
House Prices in Pillowell
Properties in Pillowell have an average house price of £341,333.00 and had 93 Property Transactions within the last 3 years¹.
Pillowell is an area in Lydney, Gloucestershire with 1,429 households², where the most expensive property was sold for £830,000.00.
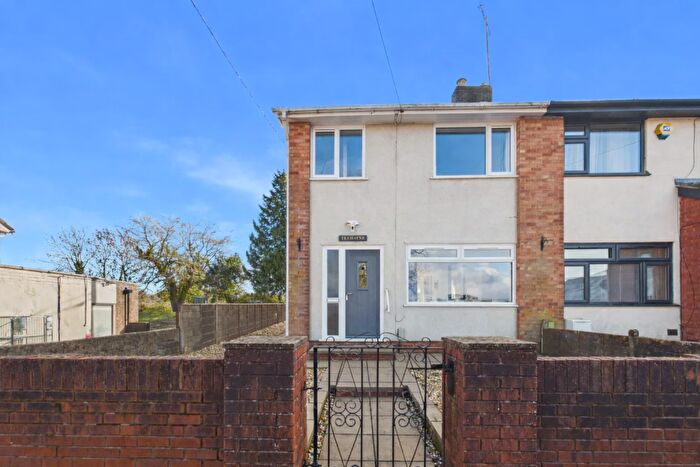
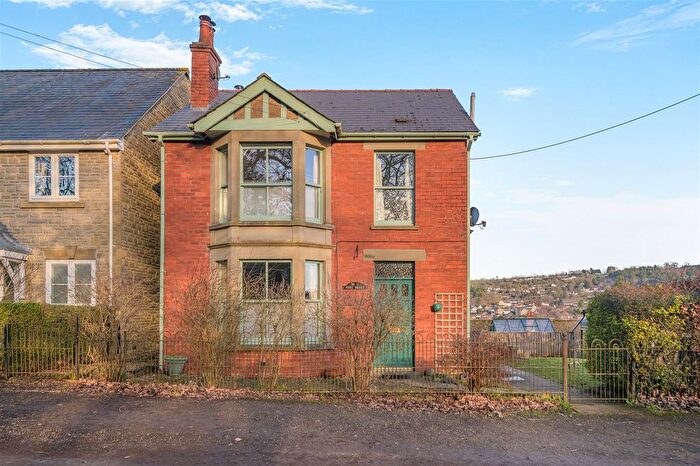
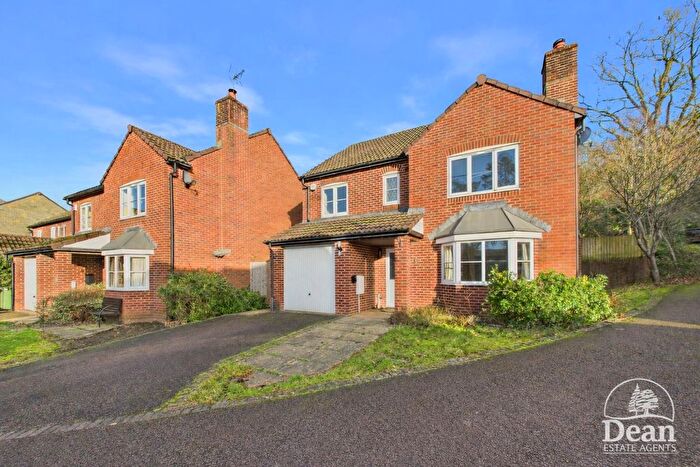
Properties for sale in Pillowell
Roads and Postcodes in Pillowell
Navigate through our locations to find the location of your next house in Pillowell, Lydney for sale or to rent.
| Streets | Postcodes |
|---|---|
| Ashgrove Place | GL15 4RY |
| Bailey Hill | GL15 4RP GL15 4RS GL15 4RT |
| Bath Crescent | GL15 4RN |
| Beech Road | GL15 4TJ |
| Blimeshire | GL15 4RH |
| Brandicks Green | GL15 4HP |
| Brockaditches | GL15 4HU |
| Cannop Road | GL15 4JR |
| Captains Green Road | GL15 4TW |
| Castlemain | GL15 4HH |
| Chapel Road | GL15 4NU |
| Charleswood Road | GL15 4QH |
| Church Drive | GL15 4HJ |
| Church Walk | GL15 4NY |
| City Lane | GL15 4TB |
| Corner Road | GL15 4QU |
| Council Villas | GL15 4TR |
| Crown Lane | GL15 4TP |
| Danby Road | GL15 4SH |
| Deer Park | GL15 4UB |
| Fairmoor Close | GL15 4HA GL15 4HB |
| Fancy Hill | GL15 4JN GL15 4JW |
| Fancy Road | GL15 4JP |
| Folly Road | GL15 4JF |
| George Road | GL15 4TL |
| Grove Park | GL15 4SS |
| Grove Road | GL15 4QJ GL15 4QL |
| Harold Road | GL15 4SD |
| Herberts Way | GL15 4NS |
| High Delf Way | GL15 4RW |
| Highview Road | GL15 4UA |
| Holly Tree Place | GL15 4LQ |
| Hughes Terrace | GL15 4JL |
| Johnsons Way | GL15 4RZ |
| Kidnalls Drive | GL15 4UE |
| Kidnalls Road | GL15 4ST |
| Lower Road | GL15 4TH GL15 4TN GL15 4TQ |
| Lower Yorkley | GL15 4TS |
| Lydney Road | GL15 4PU GL15 4RR |
| Main Road | GL15 4QB GL15 4QX GL15 4QY GL15 4SX |
| Meadow Close | GL15 4NX |
| Morcroft Place | GL15 4RJ GL15 4RQ |
| Morris Close | GL15 4SP |
| Moseley Green | GL15 4HN GL15 4HS |
| Mount Pleasant | GL15 4JY |
| Neds Top | GL15 4NQ |
| New Road | GL15 4QF |
| Oakfield Gardens | GL15 4HQ |
| Oaklands Park | GL15 4PX |
| Oaklea Road | GL15 4RU |
| Parkend | GL15 4JA GL15 4JD GL15 4JH GL15 4JJ |
| Parkend Road | GL15 4PA GL15 4PB GL15 4TE GL15 4TG |
| Parkhill | GL15 4PF GL15 4PG GL15 4PQ |
| Phillips Close | GL15 4LG |
| Pillowell Road | GL15 4RL |
| Pine Tree Way | GL15 4NT |
| Ridgeway | GL15 4SE |
| School Road | GL15 4QT |
| Severn View Road | GL15 4SF |
| Slade Road | GL15 4SG |
| St Swithins Road | GL15 4NF |
| Stag Hill | GL15 4TD |
| The Barracks | GL15 4HR |
| The Folly | GL15 4JQ |
| The Row | GL15 4TF |
| The Rudge | GL15 4SY |
| The Terrace | GL15 4PH |
| Tomlin Place | GL15 4SR |
| Tower Road | GL15 4SJ |
| Tylers Way | GL15 4SN |
| Upper Road | GL15 4QZ GL15 4RA GL15 4RB GL15 4RD |
| Viney Hill | GL15 4LZ GL15 4NA GL15 4NB GL15 4ND |
| Wesley Court | GL15 4RF |
| Wesley Road | GL15 4RE GL15 4RG |
| Whitecroft Road | GL15 4HG |
| Woodland Close | GL15 4PL |
| Woodland Place | GL15 4SA |
| Woodland Rise | GL15 4JX |
| Woodland Road | GL15 4JU |
| Yorkley Road | GL15 4HL |
| Yorkley Slade | GL15 4RX GL15 4SB GL15 4SW |
| Yorkley Wood | GL15 4TU |
| Yorkley Wood Road | GL15 4TT GL15 4TY |
| GL15 4NJ GL15 4NL GL15 4NN GL15 4NR GL15 4NW GL15 4PE GL15 4QE GL15 4QP GL15 4QQ GL15 4QW GL15 4SL GL15 4TA GL15 4TZ |
Transport near Pillowell
-
Lydney Station
-
Cam and Dursley Station
-
Chepstow Station
-
Stonehouse Station
-
Stroud Station
-
Pilning Station
-
Gloucester Station
-
Severn Beach Station
- FAQ
- Price Paid By Year
- Property Type Price
Frequently asked questions about Pillowell
What is the average price for a property for sale in Pillowell?
The average price for a property for sale in Pillowell is £341,333. This amount is 17% higher than the average price in Lydney. There are 1,612 property listings for sale in Pillowell.
What streets have the most expensive properties for sale in Pillowell?
The streets with the most expensive properties for sale in Pillowell are Folly Road at an average of £830,000, St Swithins Road at an average of £585,000 and Ashgrove Place at an average of £565,000.
What streets have the most affordable properties for sale in Pillowell?
The streets with the most affordable properties for sale in Pillowell are Beech Road at an average of £123,000, Parkend Road at an average of £152,800 and Slade Road at an average of £172,000.
Which train stations are available in or near Pillowell?
Some of the train stations available in or near Pillowell are Lydney, Cam and Dursley and Chepstow.
Property Price Paid in Pillowell by Year
The average sold property price by year was:
| Year | Average Sold Price | Price Change |
Sold Properties
|
|---|---|---|---|
| 2025 | £366,673 | 13% |
26 Properties |
| 2024 | £319,786 | -7% |
34 Properties |
| 2023 | £343,568 | -15% |
33 Properties |
| 2022 | £396,273 | 10% |
42 Properties |
| 2021 | £356,111 | 17% |
66 Properties |
| 2020 | £293,888 | 14% |
49 Properties |
| 2019 | £252,507 | 2% |
51 Properties |
| 2018 | £248,380 | 6% |
62 Properties |
| 2017 | £233,192 | -6% |
70 Properties |
| 2016 | £247,313 | 15% |
43 Properties |
| 2015 | £210,667 | -5% |
87 Properties |
| 2014 | £220,820 | 11% |
56 Properties |
| 2013 | £195,759 | 3% |
48 Properties |
| 2012 | £190,046 | -15% |
35 Properties |
| 2011 | £218,524 | 8% |
29 Properties |
| 2010 | £200,529 | 18% |
49 Properties |
| 2009 | £165,151 | -20% |
36 Properties |
| 2008 | £197,866 | -23% |
37 Properties |
| 2007 | £244,288 | 12% |
68 Properties |
| 2006 | £214,288 | 9% |
61 Properties |
| 2005 | £195,708 | 15% |
54 Properties |
| 2004 | £167,269 | 3% |
68 Properties |
| 2003 | £162,204 | 20% |
61 Properties |
| 2002 | £130,134 | 10% |
79 Properties |
| 2001 | £116,766 | 23% |
59 Properties |
| 2000 | £89,415 | 13% |
51 Properties |
| 1999 | £77,527 | 3% |
82 Properties |
| 1998 | £75,118 | 10% |
68 Properties |
| 1997 | £67,421 | 10% |
59 Properties |
| 1996 | £60,387 | -4% |
50 Properties |
| 1995 | £62,632 | - |
32 Properties |
Property Price per Property Type in Pillowell
Here you can find historic sold price data in order to help with your property search.
The average Property Paid Price for specific property types in the last three years are:
| Property Type | Average Sold Price | Sold Properties |
|---|---|---|
| Semi Detached House | £248,160.00 | 25 Semi Detached Houses |
| Detached House | £400,946.00 | 56 Detached Houses |
| Flat | £196,000.00 | 3 Flats |
| Terraced House | £277,666.00 | 9 Terraced Houses |

