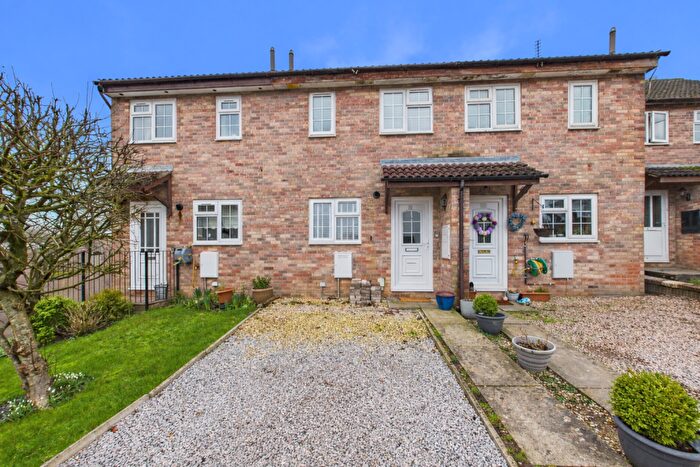
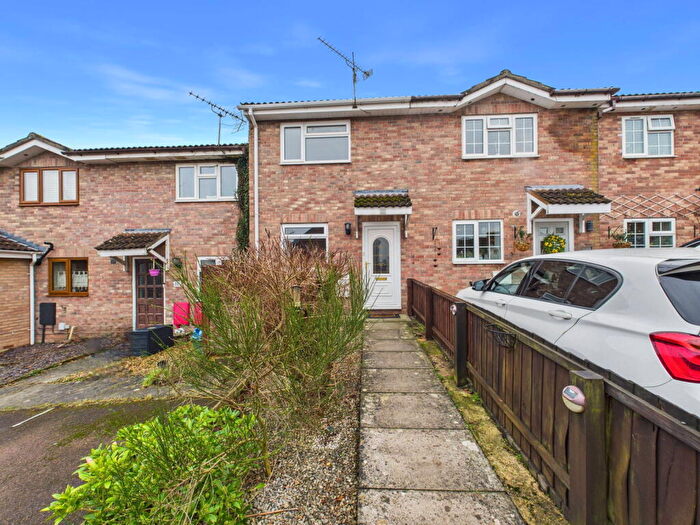
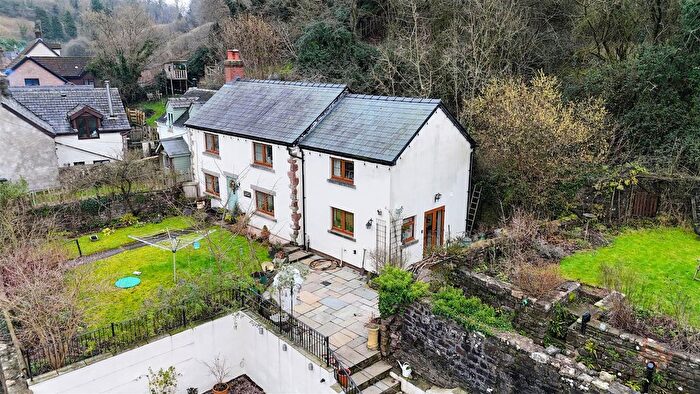
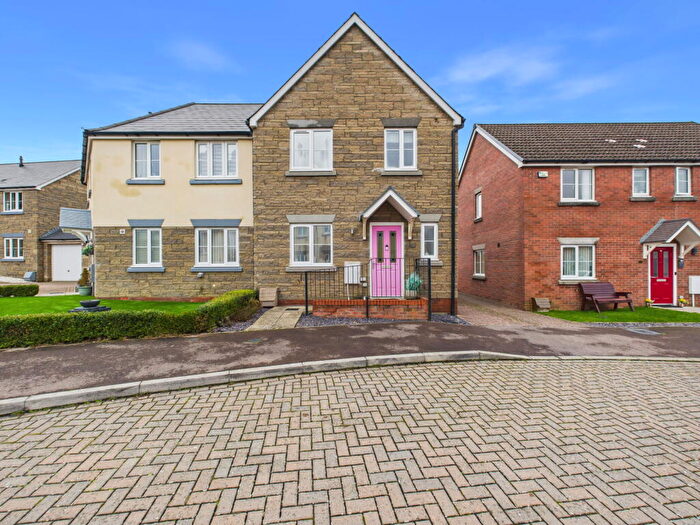
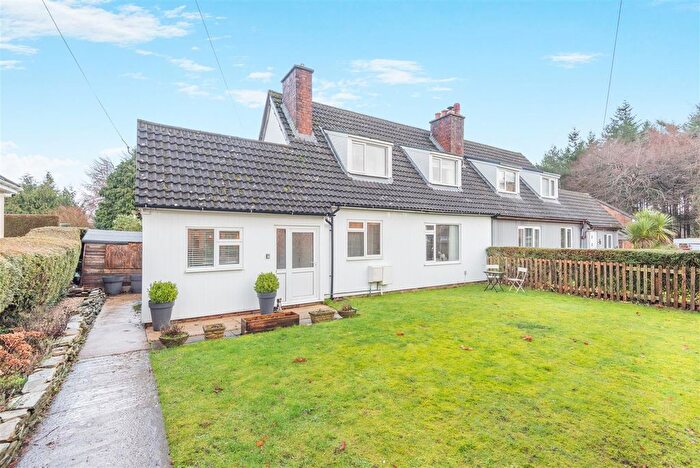
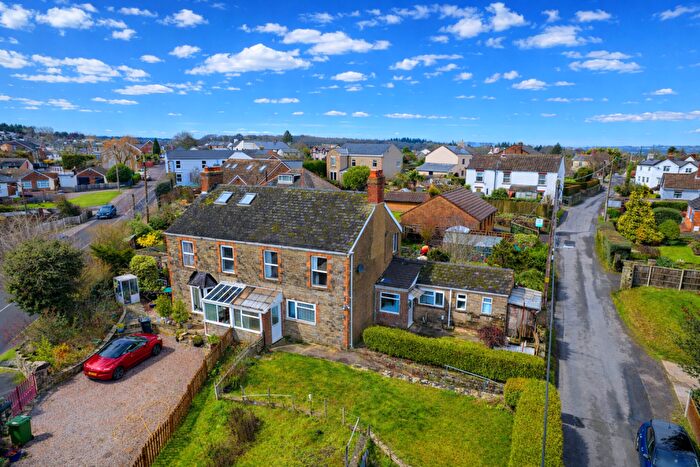
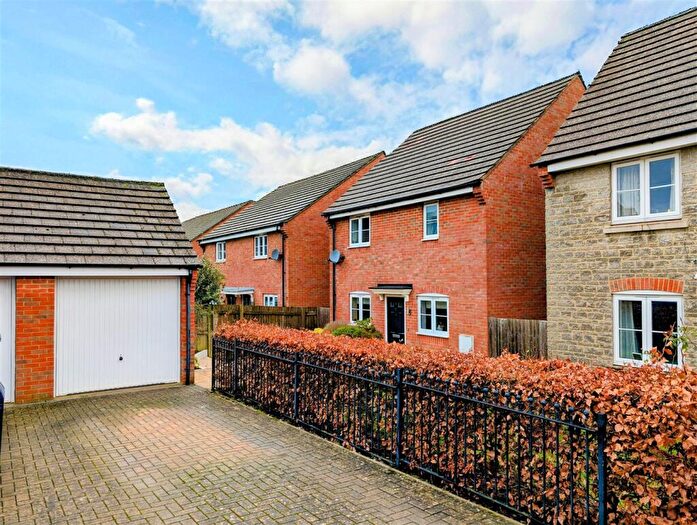
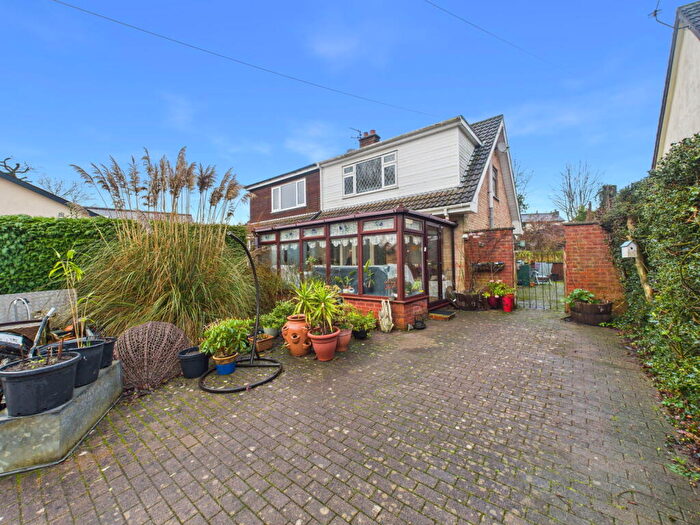
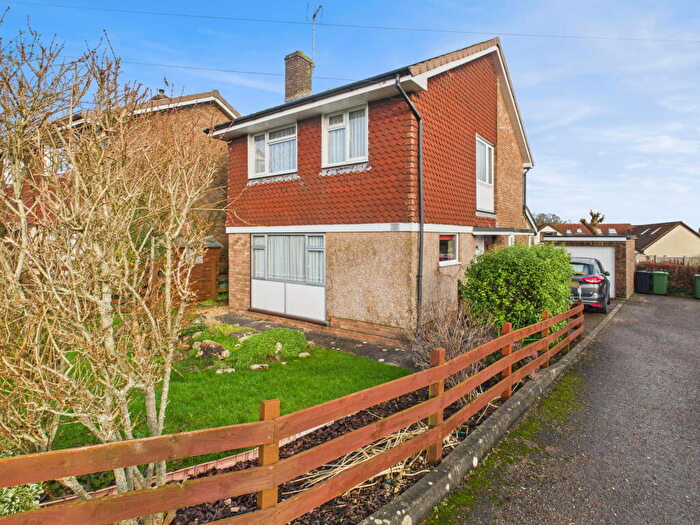
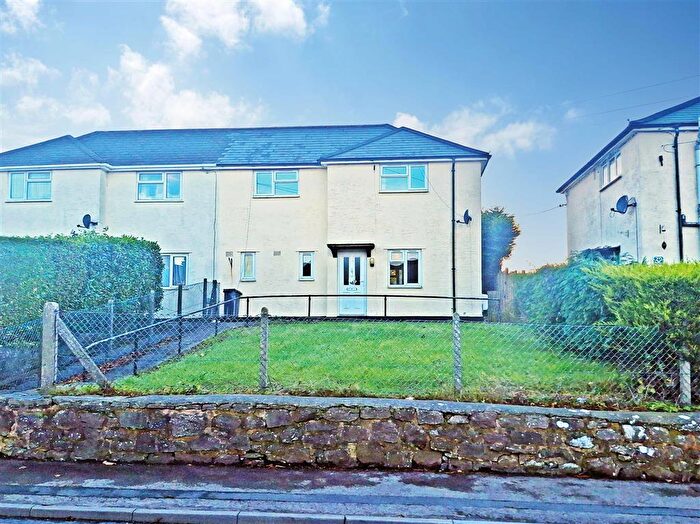
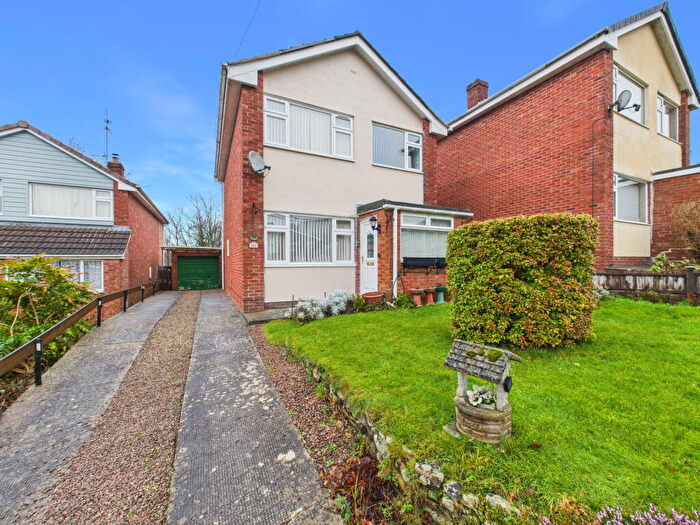
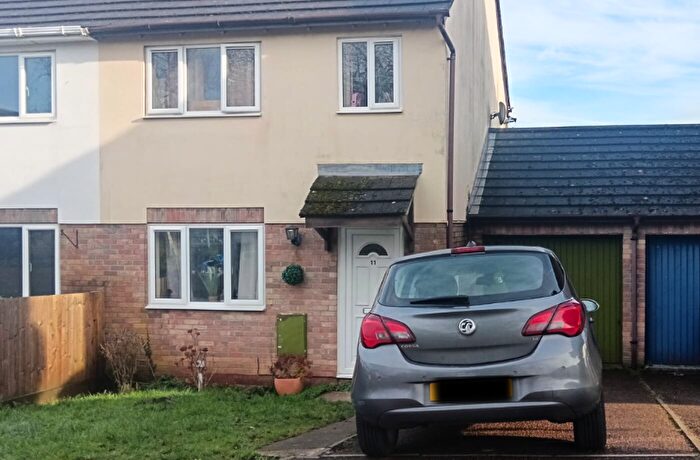
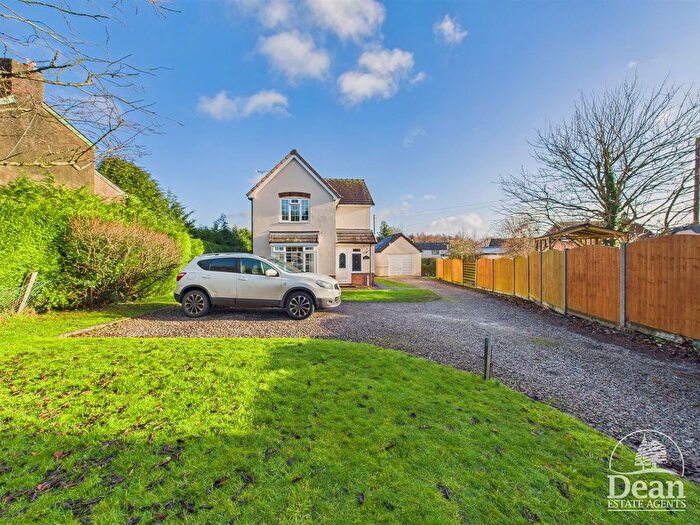
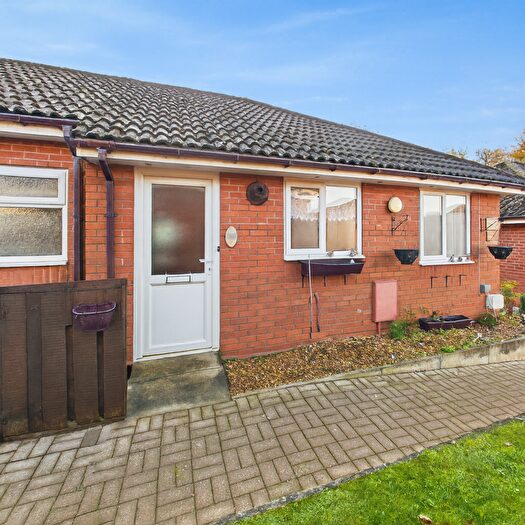
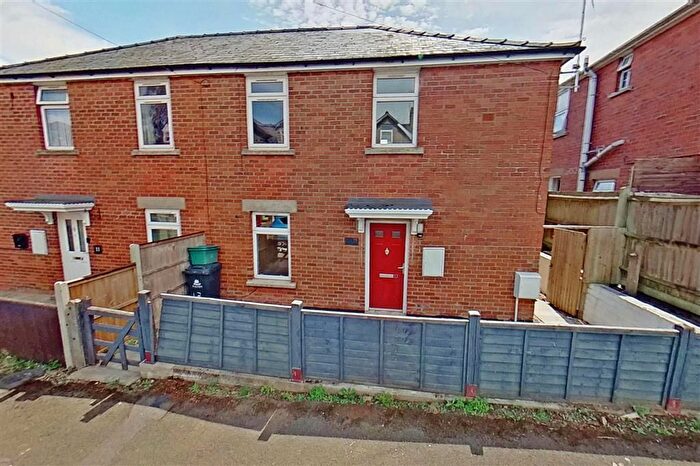
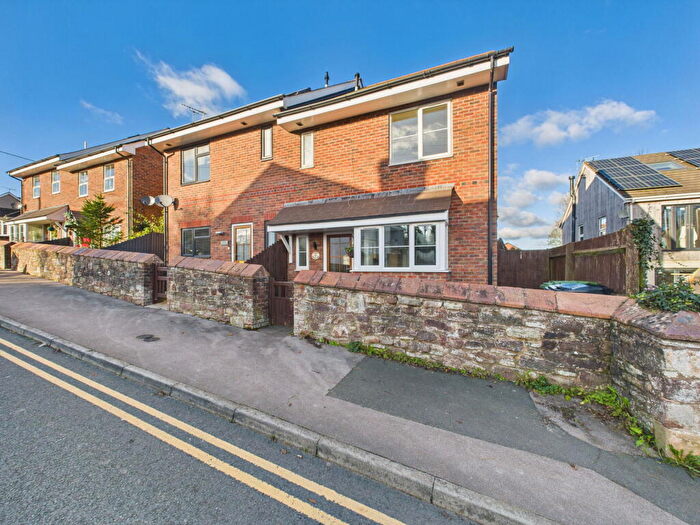
Houses for sale & to rent in Newland And St Briavels, Coleford
House Prices in Newland And St Briavels
Properties in Newland And St Briavels have an average house price of £302,691.00 and had 56 Property Transactions within the last 3 years¹.
Newland And St Briavels is an area in Coleford, Gloucestershire with 662 households², where the most expensive property was sold for £580,000.00.
Properties for sale in Newland And St Briavels
Roads and Postcodes in Newland And St Briavels
Navigate through our locations to find the location of your next house in Newland And St Briavels, Coleford for sale or to rent.
| Streets | Postcodes |
|---|---|
| Almshouse Road | GL16 8NL |
| Carpenters Cottages | GL16 8JX |
| Chepstow Road | GL16 8JA GL16 8JE GL16 8JF GL16 8LH |
| Church Road | GL16 8LF GL16 8LG |
| Clays Road | GL16 8LJ |
| Clements End | GL16 8LL |
| Clements End Road | GL16 8JL |
| Council Villas | GL16 8JH GL16 8JP GL16 8LE |
| Fetter Hill | GL16 7LU |
| Gorse Lane | GL16 8LT |
| Hawthorn Drive | GL16 8LS |
| High Street | GL16 8JS |
| Jubilee Close | GL16 8ES |
| Laundry Lane | GL16 8NQ |
| Laureldene | GL16 8LU |
| Lower Cross | GL16 8JZ GL16 8LB GL16 8LD |
| Marsh Hill | GL16 8JW |
| Marsh Lane | GL16 7NA |
| Marsh Way | GL16 8JN |
| Meadow Walk | GL16 8LR |
| Michaels Way | GL16 8LZ |
| Miles Cottages | GL16 8LY |
| Mill End | GL16 8NF |
| Newland | GL16 8NJ GL16 8NP GL16 8NW |
| Oakwood Road | GL16 8JG |
| Orchard Close | GL16 8LX |
| Parkend Walk | GL16 8JJ |
| Savage Hill | GL16 8NH |
| Smiths Hill | GL16 7LX |
| Strathmore Gardens | GL16 8JQ |
| Tannery Gardens | GL16 8JY |
| The Butts | GL16 8PW |
| The Cross | GL16 8JT GL16 8JU |
| The Rocks | GL16 8JR |
| Wainland Place | GL16 8LA |
| GL16 7LY GL16 7LZ |
Transport near Newland And St Briavels
-
Lydney Station
-
Chepstow Station
-
Cam and Dursley Station
-
Caldicot Station
-
Stonehouse Station
-
Severn Tunnel Junction Station
-
Severn Beach Station
-
Pilning Station
- FAQ
- Price Paid By Year
- Property Type Price
Frequently asked questions about Newland And St Briavels
What is the average price for a property for sale in Newland And St Briavels?
The average price for a property for sale in Newland And St Briavels is £302,691. This amount is 6% higher than the average price in Coleford. There are 505 property listings for sale in Newland And St Briavels.
What streets have the most expensive properties for sale in Newland And St Briavels?
The streets with the most expensive properties for sale in Newland And St Briavels are Marsh Way at an average of £441,666, Clements End at an average of £408,750 and Newland at an average of £391,933.
What streets have the most affordable properties for sale in Newland And St Briavels?
The streets with the most affordable properties for sale in Newland And St Briavels are Meadow Walk at an average of £189,000, Miles Cottages at an average of £208,000 and Carpenters Cottages at an average of £225,000.
Which train stations are available in or near Newland And St Briavels?
Some of the train stations available in or near Newland And St Briavels are Lydney, Chepstow and Cam and Dursley.
Property Price Paid in Newland And St Briavels by Year
The average sold property price by year was:
| Year | Average Sold Price | Price Change |
Sold Properties
|
|---|---|---|---|
| 2025 | £287,555 | -23% |
18 Properties |
| 2024 | £352,714 | 18% |
13 Properties |
| 2023 | £287,578 | 2% |
25 Properties |
| 2022 | £282,129 | -29% |
27 Properties |
| 2021 | £363,634 | 11% |
33 Properties |
| 2020 | £323,610 | 19% |
19 Properties |
| 2019 | £263,500 | 1% |
11 Properties |
| 2018 | £260,476 | 6% |
25 Properties |
| 2017 | £244,730 | 4% |
28 Properties |
| 2016 | £233,821 | 3% |
40 Properties |
| 2015 | £227,220 | 27% |
27 Properties |
| 2014 | £165,916 | -8% |
24 Properties |
| 2013 | £178,789 | -3% |
19 Properties |
| 2012 | £184,531 | 19% |
16 Properties |
| 2011 | £149,283 | -25% |
21 Properties |
| 2010 | £186,205 | -0,1% |
17 Properties |
| 2009 | £186,477 | 14% |
22 Properties |
| 2008 | £160,502 | -28% |
16 Properties |
| 2007 | £204,646 | 7% |
30 Properties |
| 2006 | £190,028 | -28% |
25 Properties |
| 2005 | £243,246 | 31% |
28 Properties |
| 2004 | £166,943 | 8% |
24 Properties |
| 2003 | £153,367 | 26% |
31 Properties |
| 2002 | £113,529 | 12% |
49 Properties |
| 2001 | £99,626 | 13% |
35 Properties |
| 2000 | £87,110 | 8% |
42 Properties |
| 1999 | £80,100 | 7% |
40 Properties |
| 1998 | £74,426 | 16% |
21 Properties |
| 1997 | £62,701 | 1% |
43 Properties |
| 1996 | £61,999 | 17% |
30 Properties |
| 1995 | £51,523 | - |
23 Properties |
Property Price per Property Type in Newland And St Briavels
Here you can find historic sold price data in order to help with your property search.
The average Property Paid Price for specific property types in the last three years are:
| Property Type | Average Sold Price | Sold Properties |
|---|---|---|
| Semi Detached House | £260,647.00 | 17 Semi Detached Houses |
| Detached House | £349,924.00 | 30 Detached Houses |
| Terraced House | £224,666.00 | 9 Terraced Houses |

