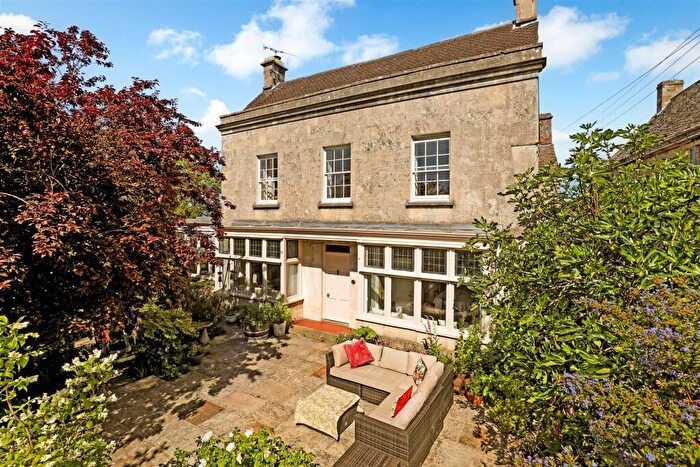
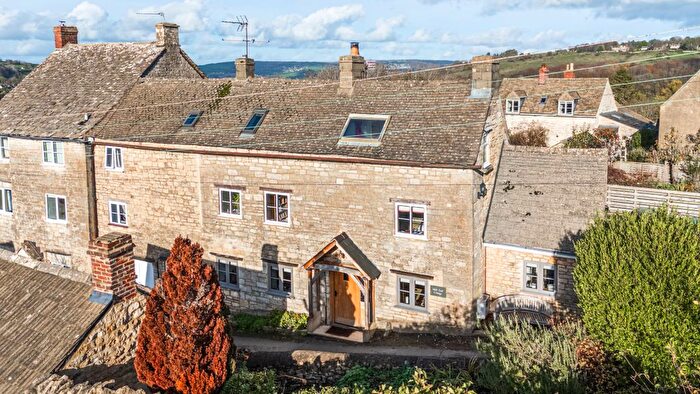
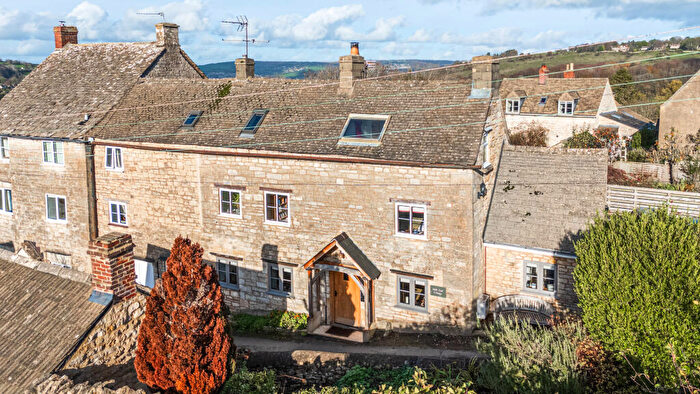
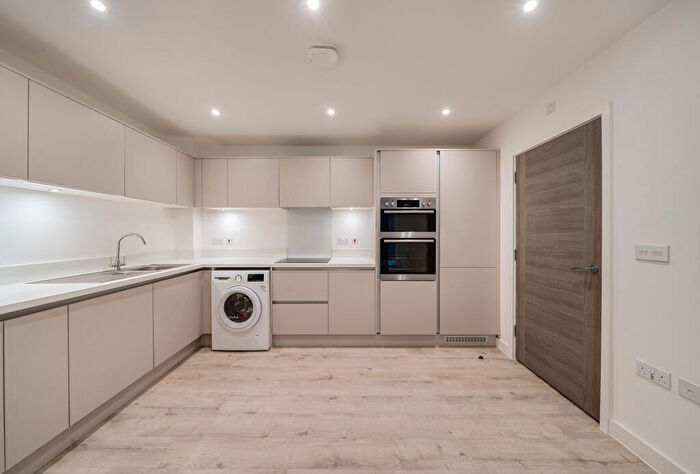
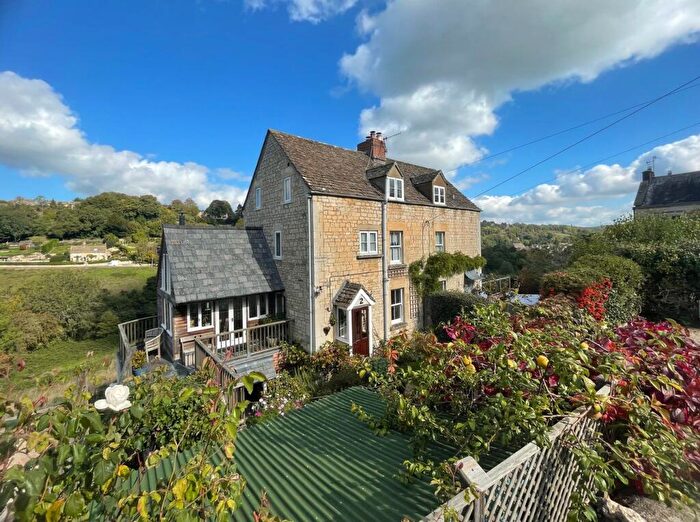
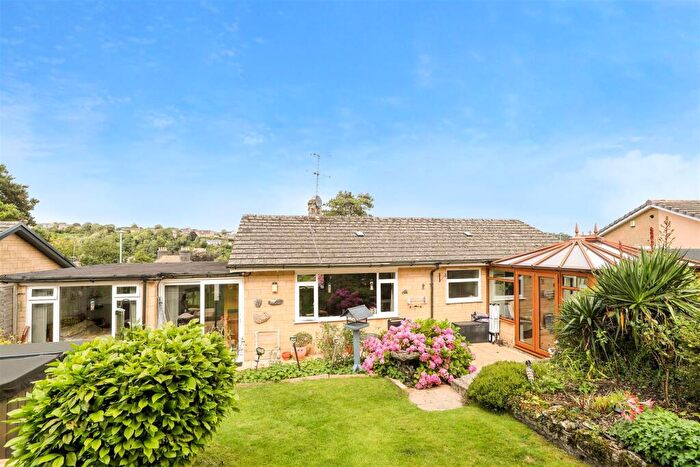
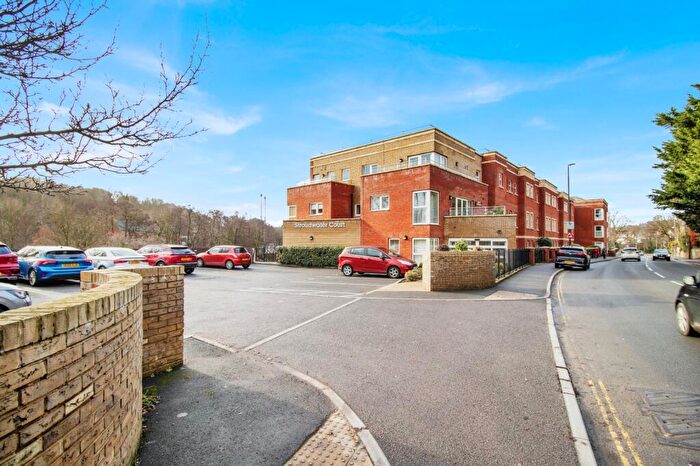
Houses for sale & to rent in Amberley And Woodchester, Stroud
House Prices in Amberley And Woodchester
Properties in Amberley And Woodchester have an average house price of £744,081.00 and had 81 Property Transactions within the last 3 years¹.
Amberley And Woodchester is an area in Stroud, Gloucestershire with 862 households², where the most expensive property was sold for £3,300,000.00.
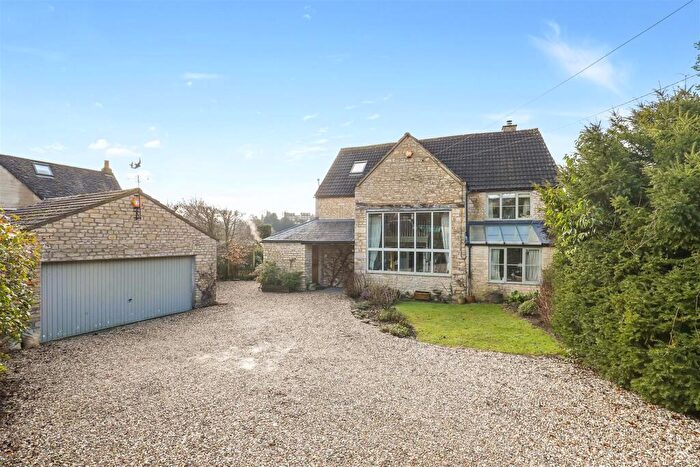
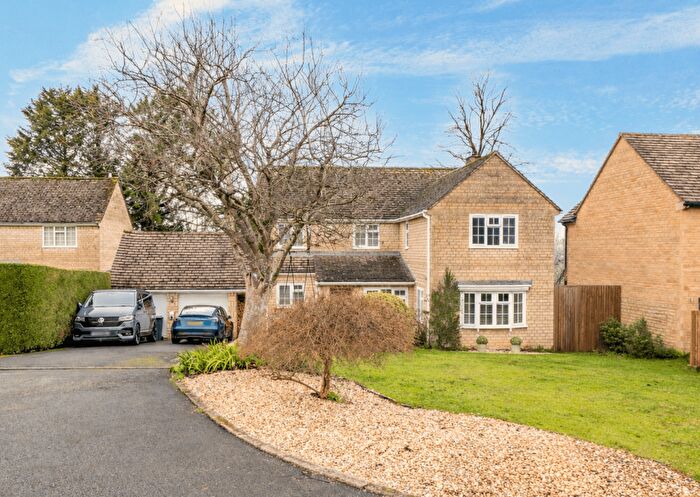
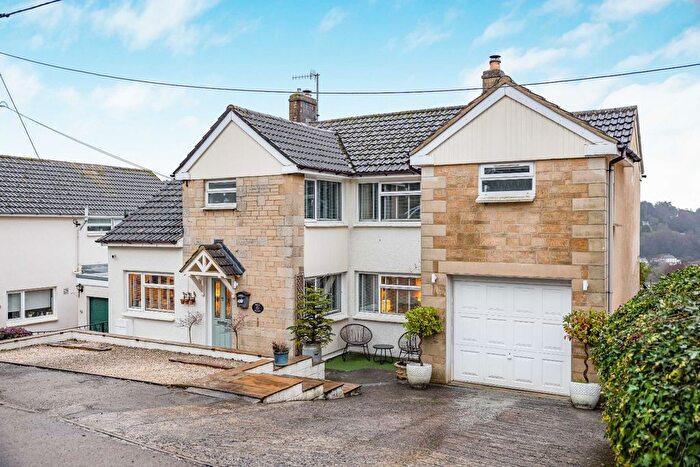
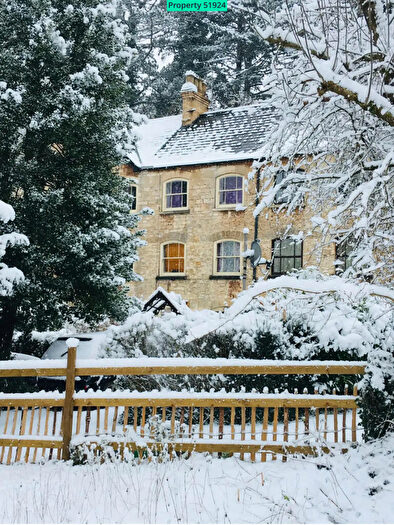
Properties for sale in Amberley And Woodchester
Roads and Postcodes in Amberley And Woodchester
Navigate through our locations to find the location of your next house in Amberley And Woodchester, Stroud for sale or to rent.
| Streets | Postcodes |
|---|---|
| Amberley Ridge | GL5 5DB |
| Atcombe Road | GL5 5EP GL5 5EW |
| Bath Road | GL5 5EY GL5 5NP GL5 5NR GL5 5NS GL5 5NT GL5 5NX GL5 5EG GL5 5EX GL5 5HT GL5 5ND |
| Beech Grove | GL5 5NL |
| Berryfield | GL5 5PR |
| Berrymore Road | GL5 5PG |
| Blacklow Close | GL5 5PT |
| Bospin Lane | GL5 5EH |
| Bownhill | GL5 5PW |
| Church Lane | GL5 5NF |
| Church Road | GL5 5PD GL5 5PF |
| Convent Lane | GL5 5HR |
| Cow Lane | GL5 5HN |
| Culver Hill | GL5 5BB |
| Epworth Terrace | GL5 5AJ |
| Frogmarsh Lane | GL5 5EN GL5 5ES |
| Frogmarsh Mills | GL5 5ET |
| Giddynap Lane | GL5 5BA |
| Grove Villas | GL5 5EZ |
| High Street | GL5 5EL |
| Houndscroft | GL5 5DG |
| Lagger Lane | GL5 5EJ |
| Lawns Park | GL5 5PP |
| Littleworth | GL5 5AG GL5 5AH GL5 5AL |
| Lower Littleworth | GL5 5AN GL5 5AW |
| Manor Drive | GL5 5NU |
| Manor Gardens | GL5 5PY |
| Marling Close | GL5 5AQ |
| Millpond End | GL5 5PB |
| Oak Villas | GL5 5PQ |
| Park Lane | GL5 5HW |
| Park View | GL5 5NJ |
| Pauls Rise | GL5 5PN |
| Pinfarthings | GL5 5JH GL5 5JJ GL5 5JQ |
| Rodborough Common | GL5 5DA GL5 5GA |
| Rooksmoor | GL5 5NB GL5 5NE |
| Rooksmoor Mills | GL5 5EF |
| Selsey Road | GL5 5NG |
| Selsley Common | GL5 5PL |
| Selsley Road | GL5 5NN GL5 5NQ GL5 5PH GL5 5PJ |
| Southbank | GL5 5PE |
| Southfield Road | GL5 5PA |
| St Chloe | GL5 5AP GL5 5AR GL5 5AS |
| Station Road | GL5 5EQ |
| The Avenue | GL5 5NH |
| The Garden | GL5 5PU |
| The Headlands | GL5 5PS |
| Theescombe | GL5 5AU GL5 5AY GL5 5AZ |
| Theescombe Hill | GL5 5AT |
| Tower House Drive | GL5 5NZ |
| Woodchester House Drive | GL5 5NY |
| GL5 5AA GL5 5AB GL5 5AD GL5 5AE GL5 5AF GL5 5ER GL5 5HS GL5 5JG GL5 5HP GL6 9AQ GL5 5BQ |
Transport near Amberley And Woodchester
- FAQ
- Price Paid By Year
- Property Type Price
Frequently asked questions about Amberley And Woodchester
What is the average price for a property for sale in Amberley And Woodchester?
The average price for a property for sale in Amberley And Woodchester is £744,081. This amount is 71% higher than the average price in Stroud. There are 1,290 property listings for sale in Amberley And Woodchester.
What streets have the most expensive properties for sale in Amberley And Woodchester?
The streets with the most expensive properties for sale in Amberley And Woodchester are Selsey Road at an average of £1,232,500, Rodborough Common at an average of £933,666 and Pinfarthings at an average of £913,750.
What streets have the most affordable properties for sale in Amberley And Woodchester?
The streets with the most affordable properties for sale in Amberley And Woodchester are Bath Road at an average of £204,708, Beech Grove at an average of £261,000 and The Garden at an average of £297,916.
Which train stations are available in or near Amberley And Woodchester?
Some of the train stations available in or near Amberley And Woodchester are Stroud, Stonehouse and Cam and Dursley.
Property Price Paid in Amberley And Woodchester by Year
The average sold property price by year was:
| Year | Average Sold Price | Price Change |
Sold Properties
|
|---|---|---|---|
| 2025 | £742,265 | 4% |
20 Properties |
| 2024 | £713,500 | -10% |
34 Properties |
| 2023 | £783,936 | 18% |
27 Properties |
| 2022 | £641,623 | - |
40 Properties |
| 2021 | £641,911 | 14% |
31 Properties |
| 2020 | £554,517 | -3% |
28 Properties |
| 2019 | £571,616 | 13% |
40 Properties |
| 2018 | £498,920 | -8% |
37 Properties |
| 2017 | £538,310 | 4% |
33 Properties |
| 2016 | £518,100 | 13% |
47 Properties |
| 2015 | £452,062 | -8% |
37 Properties |
| 2014 | £488,838 | 5% |
34 Properties |
| 2013 | £463,835 | -5% |
24 Properties |
| 2012 | £484,979 | 4% |
27 Properties |
| 2011 | £466,351 | 22% |
32 Properties |
| 2010 | £365,949 | -27% |
29 Properties |
| 2009 | £465,720 | 40% |
25 Properties |
| 2008 | £280,840 | -68% |
25 Properties |
| 2007 | £472,040 | 26% |
53 Properties |
| 2006 | £351,154 | -10% |
35 Properties |
| 2005 | £386,107 | -7% |
33 Properties |
| 2004 | £414,944 | 17% |
29 Properties |
| 2003 | £343,361 | 15% |
39 Properties |
| 2002 | £292,289 | 20% |
39 Properties |
| 2001 | £232,554 | 13% |
45 Properties |
| 2000 | £203,371 | 18% |
43 Properties |
| 1999 | £166,378 | 9% |
55 Properties |
| 1998 | £150,952 | -3% |
41 Properties |
| 1997 | £156,032 | 10% |
51 Properties |
| 1996 | £139,775 | 4% |
29 Properties |
| 1995 | £134,285 | - |
30 Properties |
Property Price per Property Type in Amberley And Woodchester
Here you can find historic sold price data in order to help with your property search.
The average Property Paid Price for specific property types in the last three years are:
| Property Type | Average Sold Price | Sold Properties |
|---|---|---|
| Semi Detached House | £599,833.00 | 18 Semi Detached Houses |
| Detached House | £887,494.00 | 48 Detached Houses |
| Terraced House | £501,451.00 | 13 Terraced Houses |
| Flat | £177,500.00 | 2 Flats |

