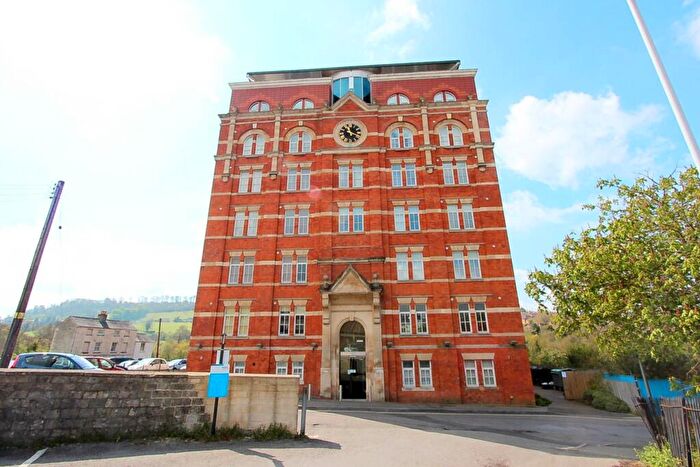
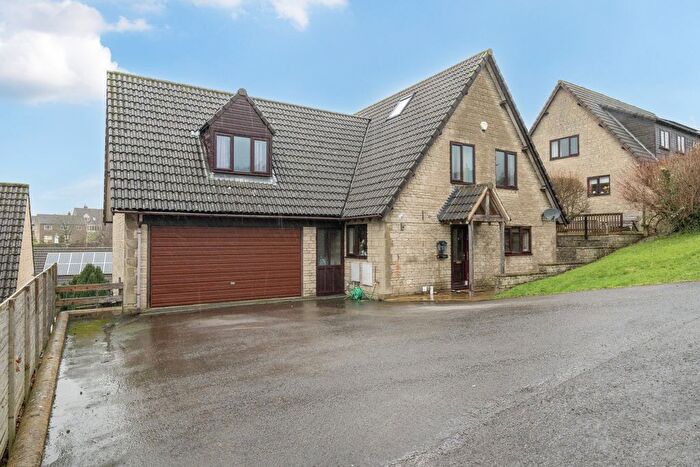
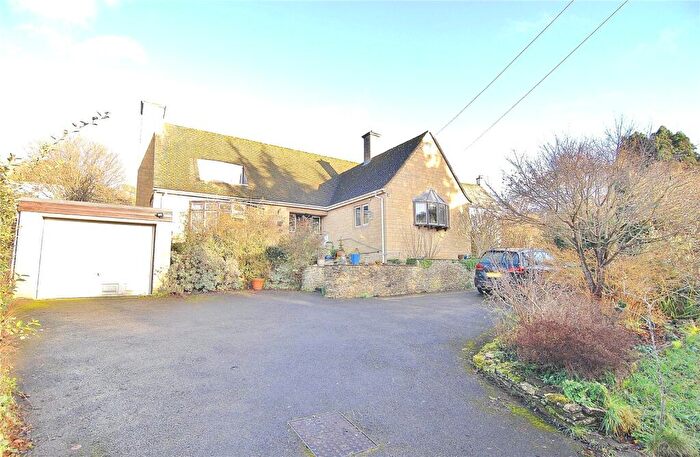
Houses for sale & to rent in Trinity, Stroud
House Prices in Trinity
Properties in Trinity have an average house price of £356,997.00 and had 103 Property Transactions within the last 3 years¹.
Trinity is an area in Stroud, Gloucestershire with 946 households², where the most expensive property was sold for £785,000.00.
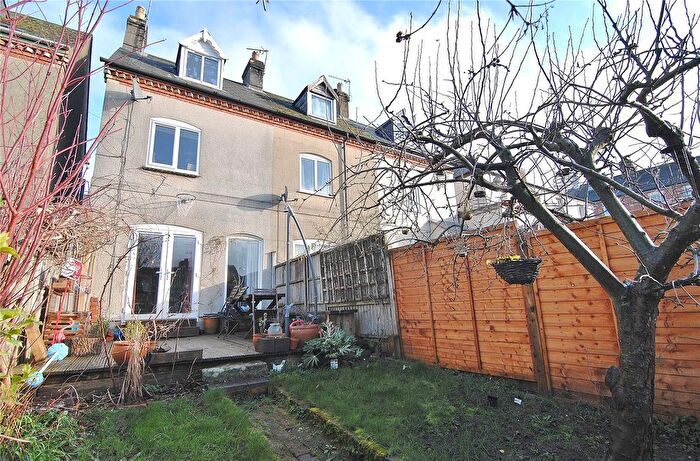
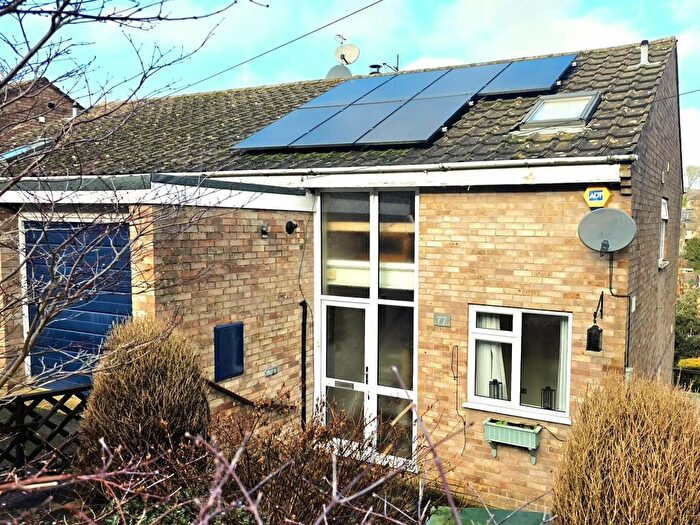
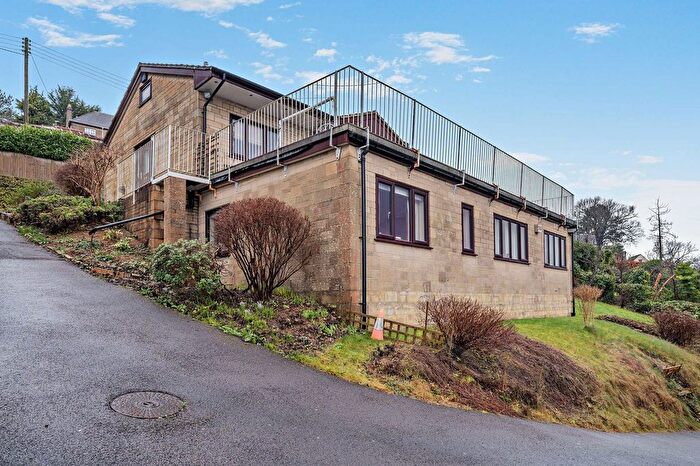
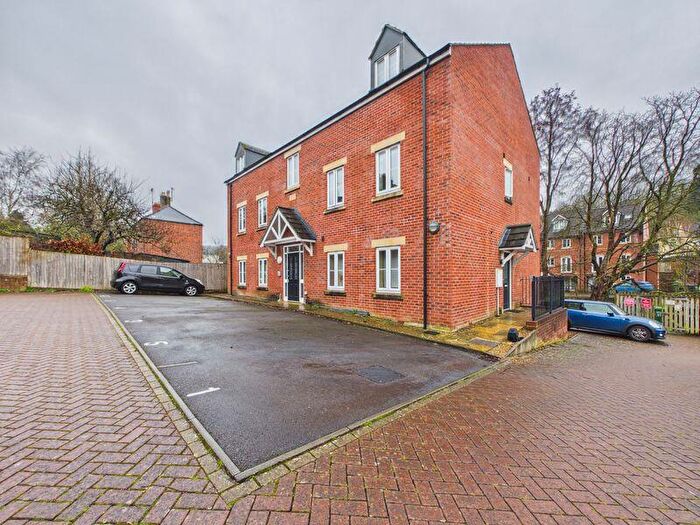
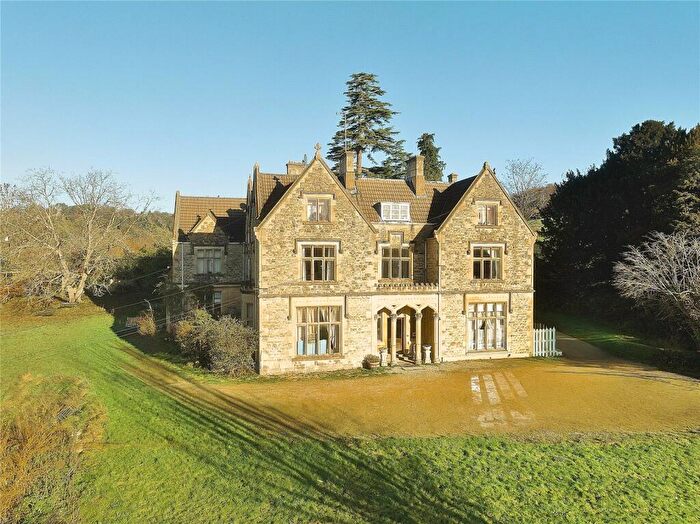
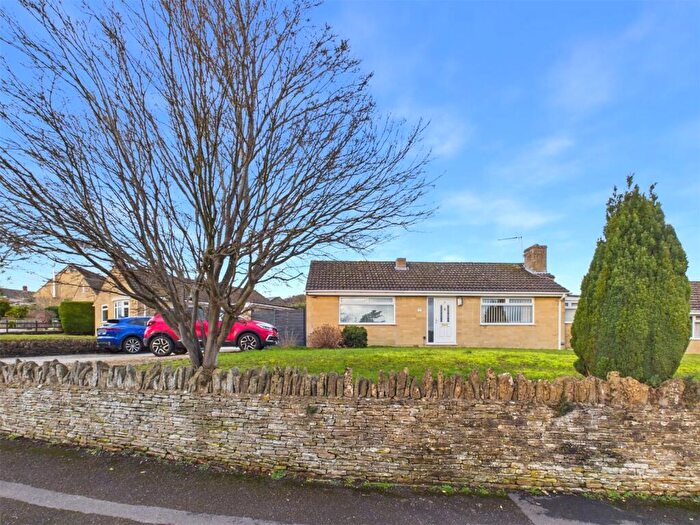
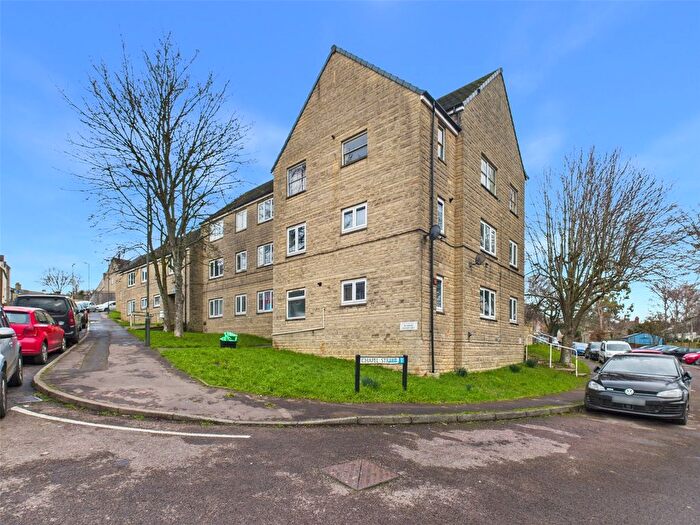
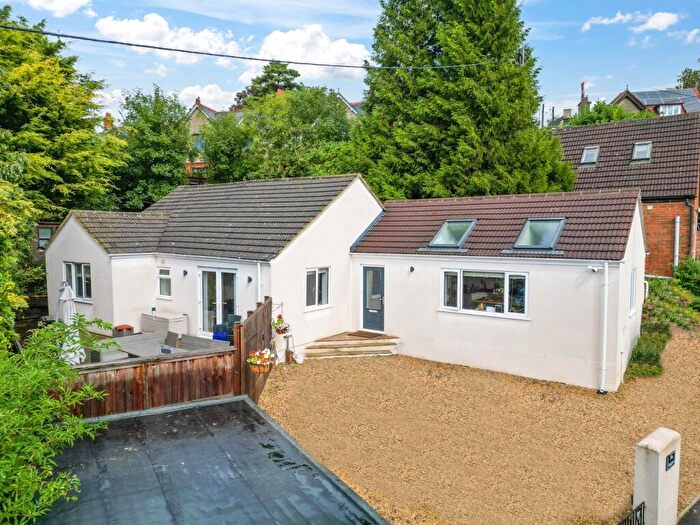
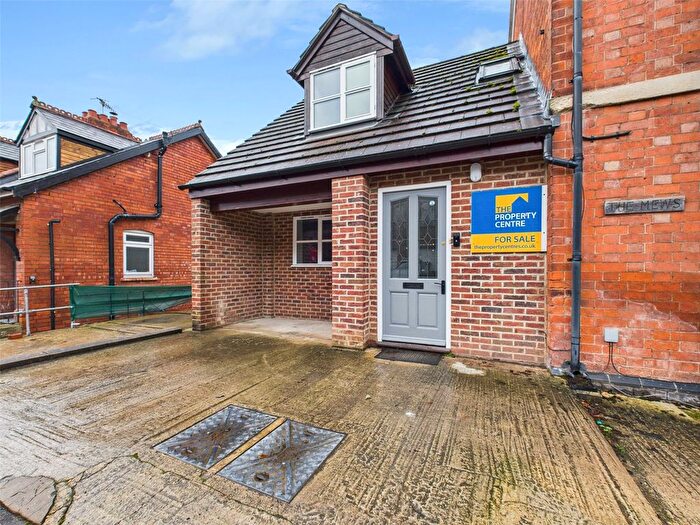
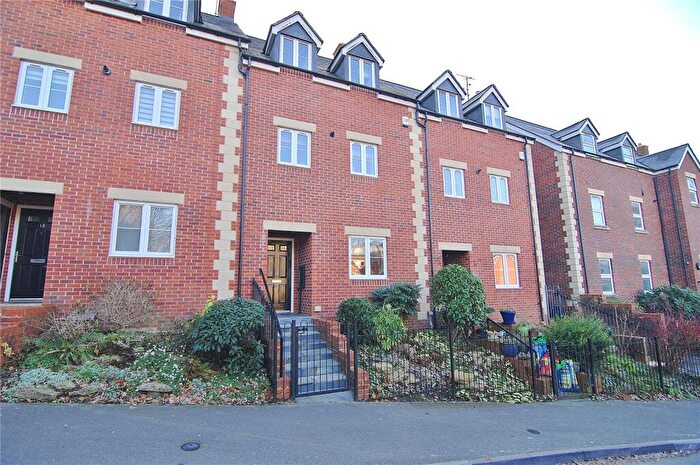
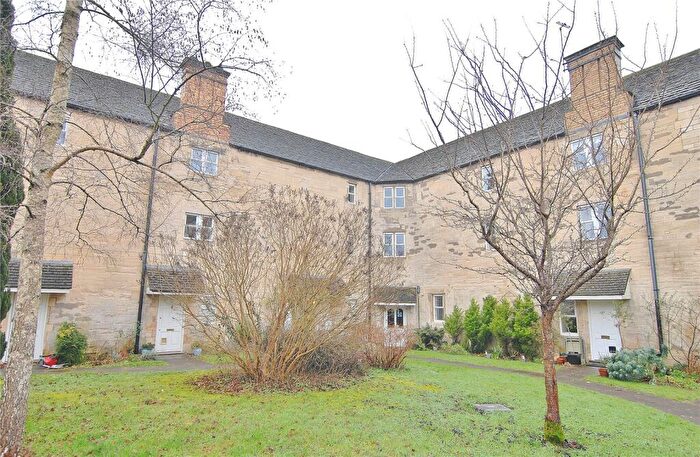
Properties for sale in Trinity
Roads and Postcodes in Trinity
Navigate through our locations to find the location of your next house in Trinity, Stroud for sale or to rent.
| Streets | Postcodes |
|---|---|
| Arundel Mill Lane | GL5 2AE GL5 2BS |
| Bisley Road | GL5 1HE GL5 1HF GL5 1HG |
| Bowbridge | GL5 2LA |
| Bowbridge Lane | GL5 2JH GL5 2JL GL5 2JN GL5 2JP GL5 2JW |
| Bowbridge Lock | GL5 2JZ |
| Castle Street | GL5 2HP GL5 2HR GL5 2JD |
| Churchfield Cottages | GL5 1EL |
| Churchfield Mews | GL5 1EQ |
| Cowle Road | GL5 2JR |
| Eagle Mill Close | GL5 2LB |
| Field House Gardens | GL5 2JX |
| Field Road | GL5 2JA |
| Gun House Lane | GL5 2DB |
| Highfield Road | GL5 1ER GL5 1ES |
| Hope Cottages | GL5 1EJ |
| Horns Road | GL5 1EB GL5 1ED GL5 1EE GL5 1EF GL5 1EG |
| London Road | GL5 2AS GL5 2AT GL5 2AY GL5 2BZ |
| Lower Churchfield Road | GL5 1EN GL5 1EW |
| Lower Dorrington Terrace | GL5 2AR |
| Lower Street | GL5 2HS GL5 2HT GL5 2HU |
| Middle Street | GL5 1EA |
| Park Road | GL5 2HQ GL5 2JF GL5 2JG |
| Rosebank Villas | GL5 1EH |
| Spider Lane | GL5 1EP |
| Spring Lane | GL5 2JU |
| Sutton Gardens | GL5 1EX |
| Trinity Road | GL5 2HX |
| Upper Dorrington Terrace | GL5 2JE |
| Weyhouse Close | GL5 2JJ |
| Whitehall | GL5 1HA |
Transport near Trinity
- FAQ
- Price Paid By Year
- Property Type Price
Frequently asked questions about Trinity
What is the average price for a property for sale in Trinity?
The average price for a property for sale in Trinity is £356,997. This amount is 19% lower than the average price in Stroud. There are 569 property listings for sale in Trinity.
What streets have the most expensive properties for sale in Trinity?
The streets with the most expensive properties for sale in Trinity are Rosebank Villas at an average of £610,000, Cowle Road at an average of £513,900 and Park Road at an average of £484,740.
What streets have the most affordable properties for sale in Trinity?
The streets with the most affordable properties for sale in Trinity are Whitehall at an average of £230,833, Bowbridge Lock at an average of £245,250 and Bowbridge at an average of £247,500.
Which train stations are available in or near Trinity?
Some of the train stations available in or near Trinity are Stroud, Stonehouse and Cam and Dursley.
Property Price Paid in Trinity by Year
The average sold property price by year was:
| Year | Average Sold Price | Price Change |
Sold Properties
|
|---|---|---|---|
| 2025 | £313,096 | -30% |
31 Properties |
| 2024 | £406,823 | 14% |
34 Properties |
| 2023 | £348,228 | -21% |
38 Properties |
| 2022 | £420,963 | 36% |
30 Properties |
| 2021 | £271,329 | 1% |
42 Properties |
| 2020 | £267,829 | -11% |
29 Properties |
| 2019 | £298,028 | 10% |
40 Properties |
| 2018 | £269,593 | 4% |
32 Properties |
| 2017 | £258,744 | -4% |
37 Properties |
| 2016 | £268,294 | 4% |
37 Properties |
| 2015 | £256,826 | 14% |
38 Properties |
| 2014 | £221,148 | 13% |
51 Properties |
| 2013 | £193,440 | -7% |
43 Properties |
| 2012 | £206,965 | -13% |
29 Properties |
| 2011 | £233,446 | 18% |
29 Properties |
| 2010 | £192,348 | 19% |
38 Properties |
| 2009 | £155,382 | -35% |
38 Properties |
| 2008 | £209,675 | -3% |
27 Properties |
| 2007 | £216,987 | 15% |
54 Properties |
| 2006 | £185,365 | -3% |
65 Properties |
| 2005 | £190,195 | 9% |
53 Properties |
| 2004 | £172,722 | 17% |
44 Properties |
| 2003 | £143,141 | 15% |
45 Properties |
| 2002 | £121,190 | 20% |
57 Properties |
| 2001 | £97,262 | -4% |
61 Properties |
| 2000 | £101,213 | 22% |
46 Properties |
| 1999 | £79,252 | 5% |
57 Properties |
| 1998 | £75,204 | 13% |
51 Properties |
| 1997 | £65,147 | 9% |
54 Properties |
| 1996 | £59,460 | 2% |
60 Properties |
| 1995 | £58,098 | - |
37 Properties |
Property Price per Property Type in Trinity
Here you can find historic sold price data in order to help with your property search.
The average Property Paid Price for specific property types in the last three years are:
| Property Type | Average Sold Price | Sold Properties |
|---|---|---|
| Semi Detached House | £393,240.00 | 30 Semi Detached Houses |
| Detached House | £526,647.00 | 17 Detached Houses |
| Terraced House | £344,571.00 | 35 Terraced Houses |
| Flat | £188,595.00 | 21 Flats |

