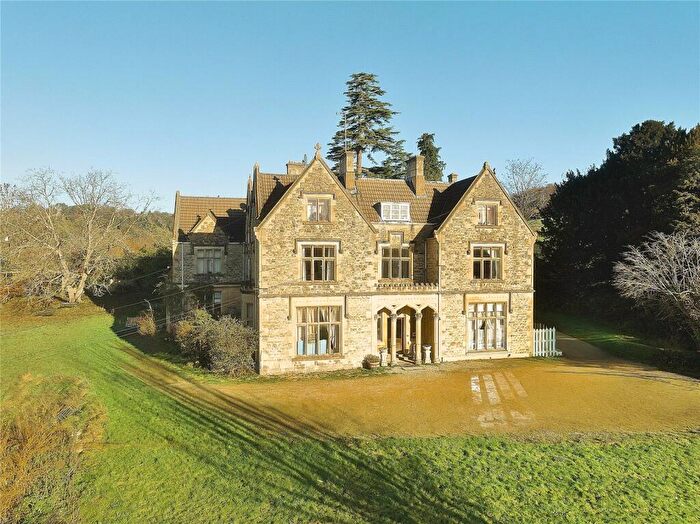
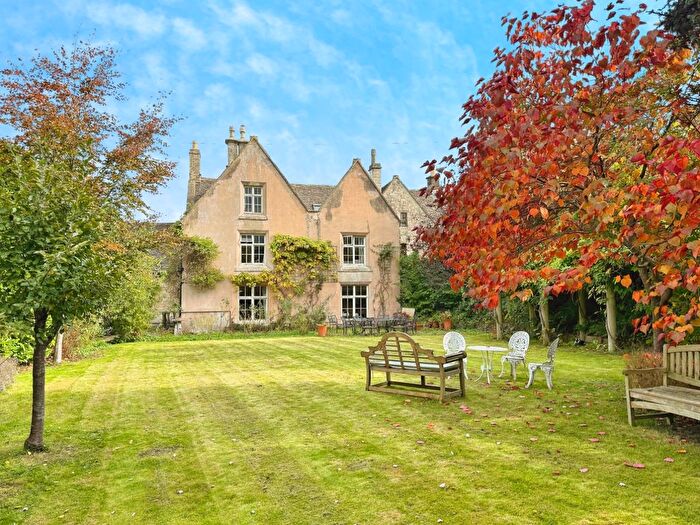
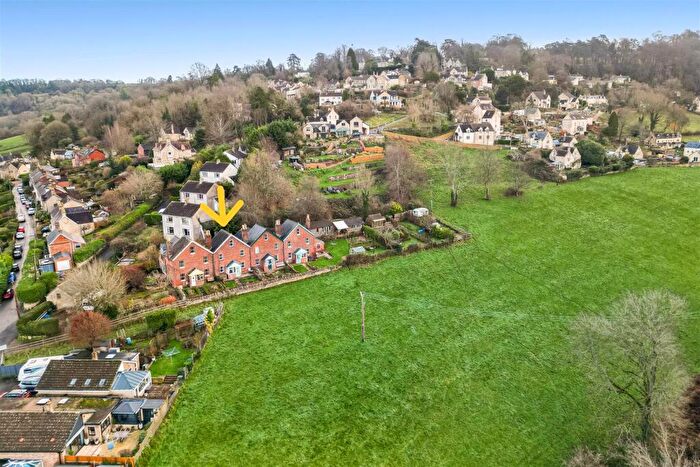
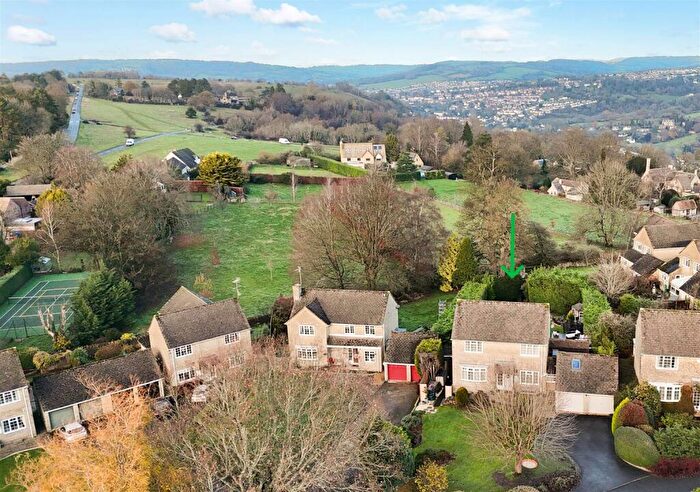
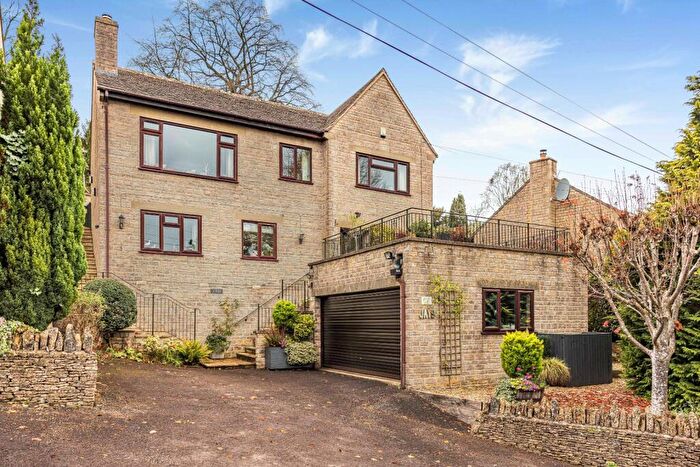
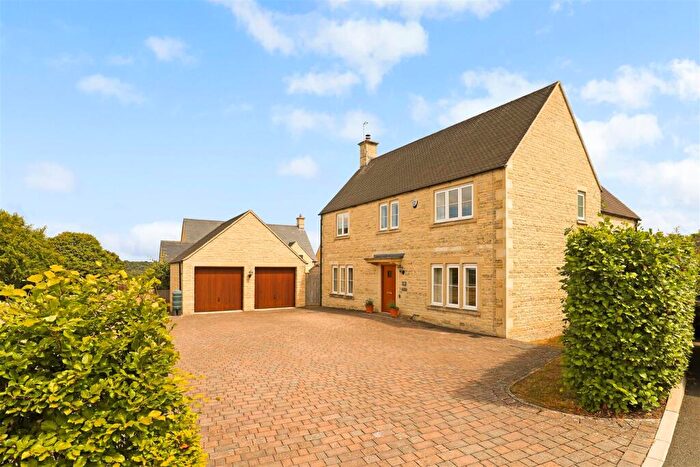
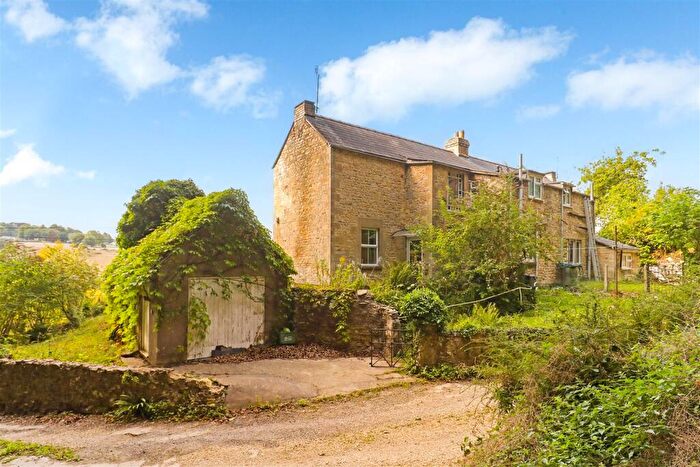
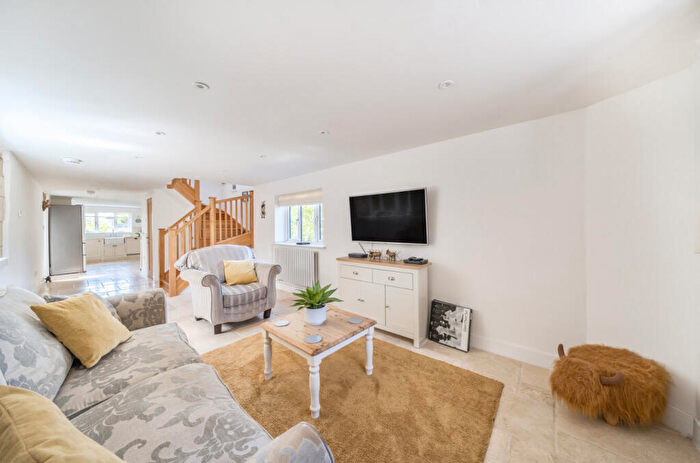
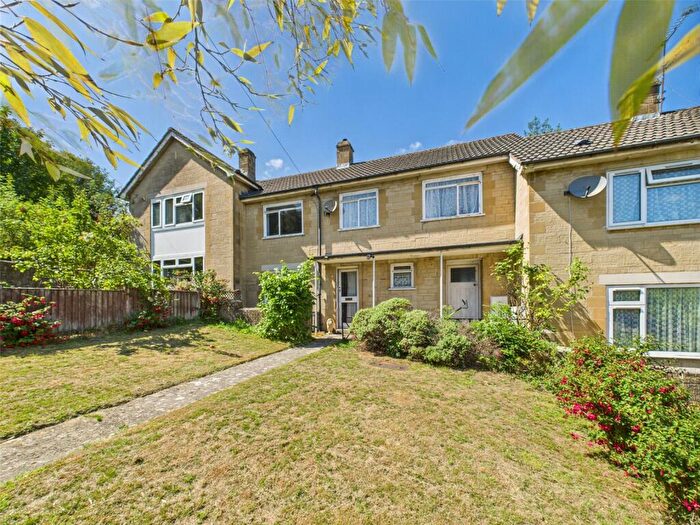
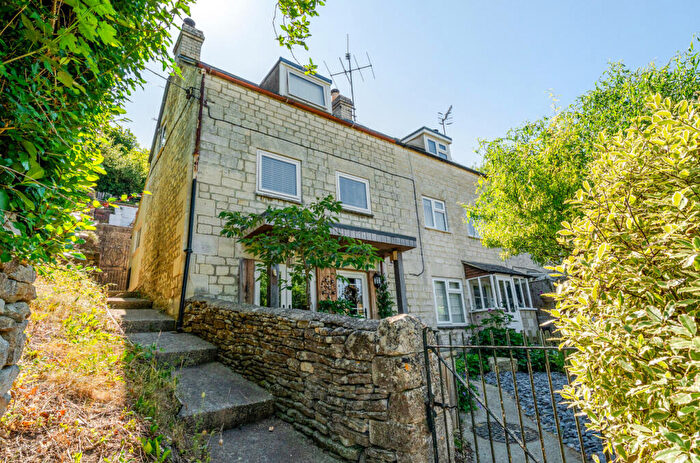
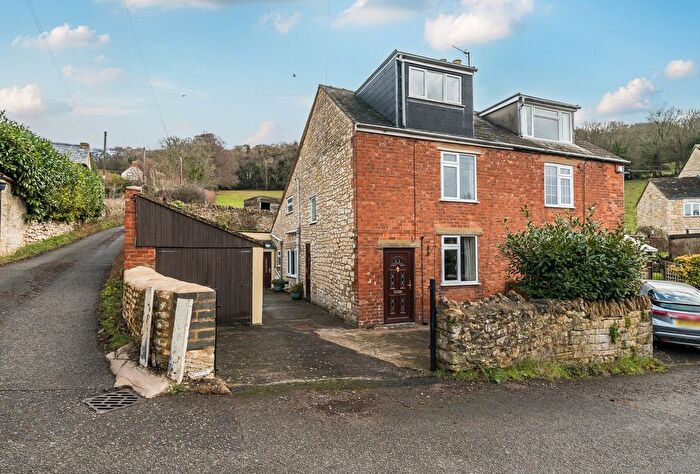
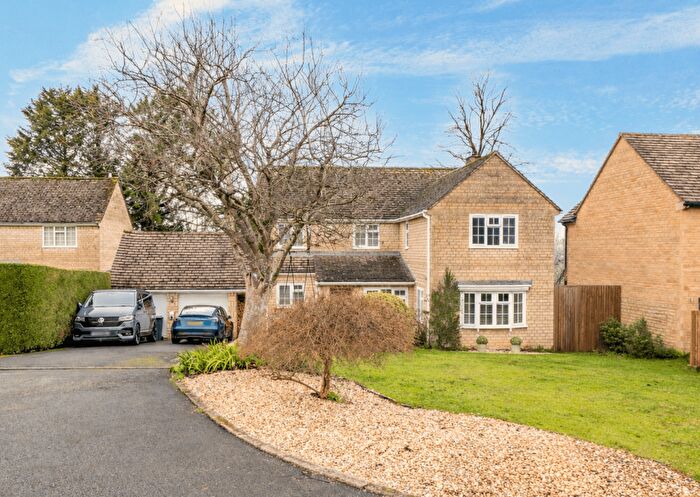
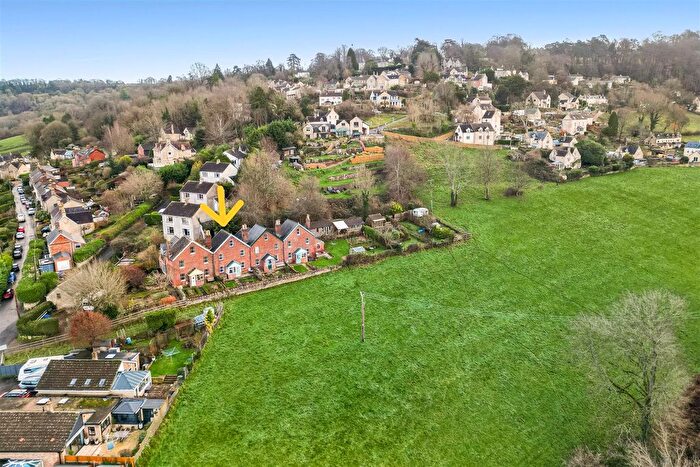
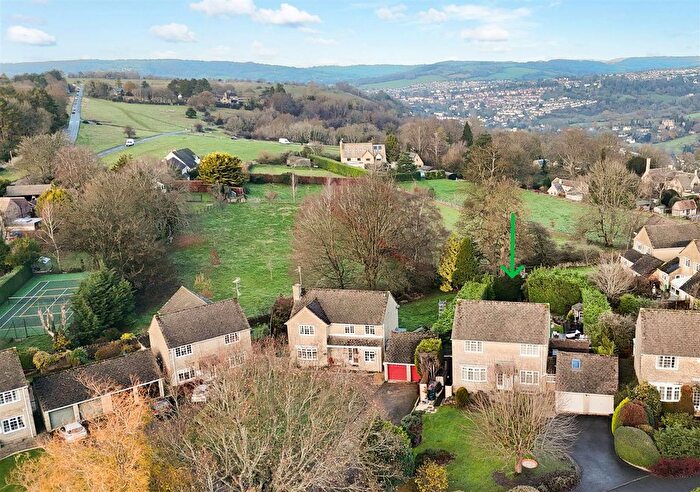
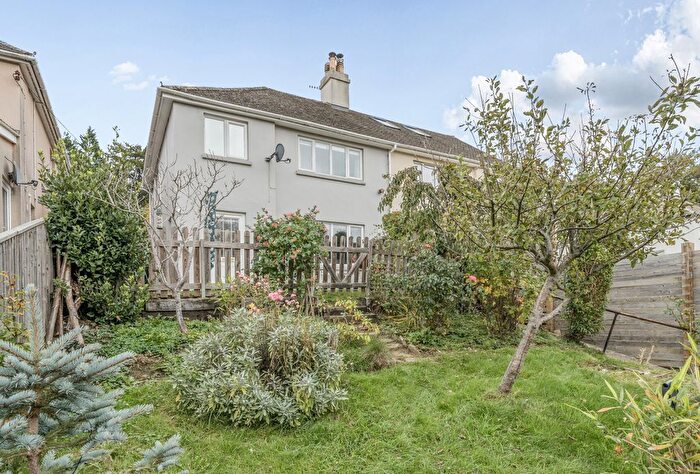
Houses for sale & to rent in Thrupp, Stroud
House Prices in Thrupp
Properties in Thrupp have an average house price of £495,670.00 and had 86 Property Transactions within the last 3 years¹.
Thrupp is an area in Stroud, Gloucestershire with 953 households², where the most expensive property was sold for £1,500,000.00.
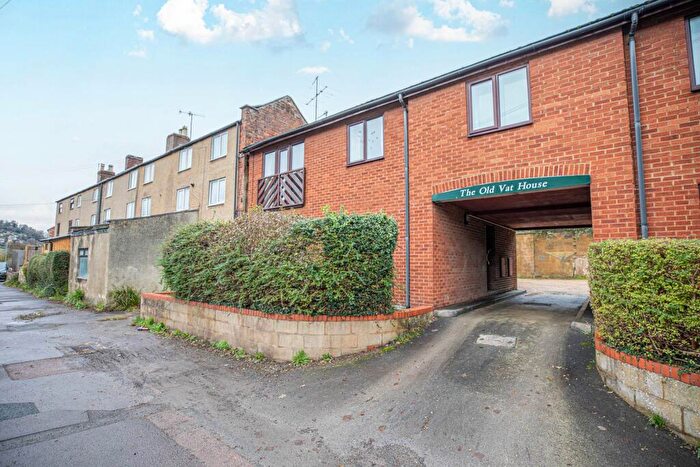
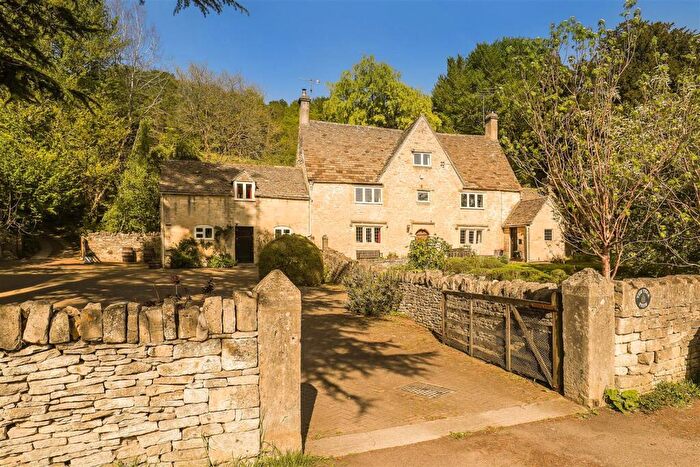
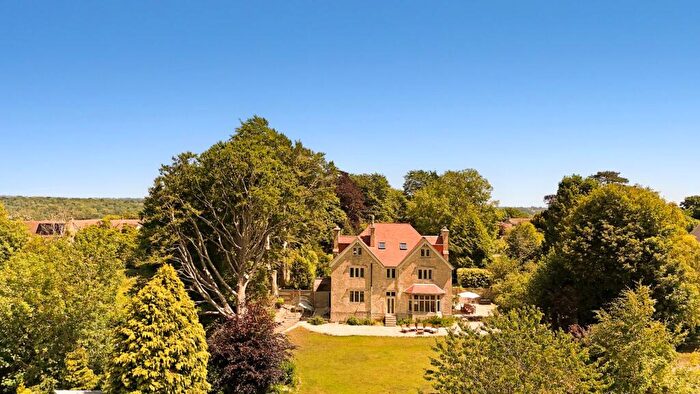
Properties for sale in Thrupp
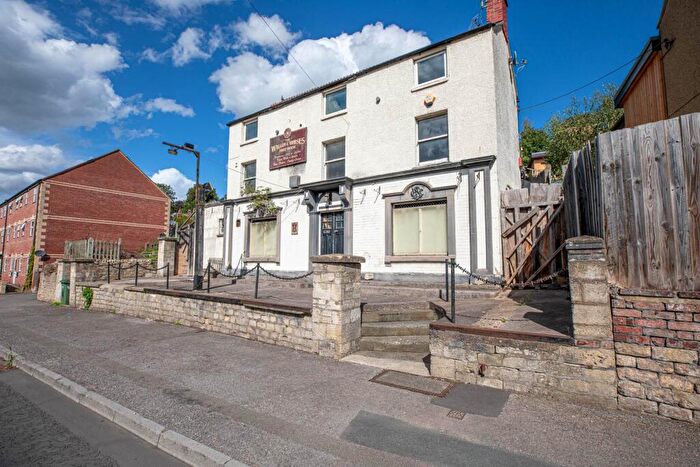
Previously listed properties in Thrupp
Roads and Postcodes in Thrupp
Navigate through our locations to find the location of your next house in Thrupp, Stroud for sale or to rent.
| Streets | Postcodes |
|---|---|
| Bagpath | GL5 2SJ |
| Bourne | GL5 2RH |
| Bourne Estate | GL5 2SX |
| Bourne Lane | GL5 2RJ GL5 2RP GL5 2RQ |
| Bownham | GL5 2SN |
| Bownham Mead | GL5 5DZ |
| Bownham Park | GL5 5BY GL5 5BZ |
| Brewery Lane | GL5 2DY GL5 2DZ GL5 2EA |
| Brimscombe Court Drive | GL5 2ED |
| Brimscombe Hill | GL5 2QN |
| Brimscombe Lane | GL5 2RE GL5 2RF |
| Brimscombe Mill | GL5 2SB |
| Brimscombe Port Business Park | GL5 2QQ |
| Butterrow Hill | GL5 2LF GL5 2LQ GL5 2LR GL5 2LS |
| Butterrow Lane | GL5 2LT GL5 2LX GL5 2LY GL5 2NA GL5 2NB GL5 2NE GL5 2NF GL5 2NG GL5 2NH GL5 2NJ GL5 2NL GL5 2ND GL5 2NQ |
| Clarendon Villas | GL5 2BH |
| Claypits Lane | GL6 7LU |
| Coopers Hill | GL5 2SL |
| Dallaway Estate | GL5 2EB |
| Golden Valley | GL5 2RX |
| Gordon Terrace | GL5 2QE |
| Great Orchard | GL5 2DJ |
| Greenhill Place | GL5 2BG |
| Greenhill Terrace | GL5 2BQ |
| Gunhouse Lane | GL5 2DD |
| Ham Mill Lane | GL5 2BB |
| High Orchard | GL5 2ES |
| Hillside Terrace | GL5 2LU |
| Hillside Villas | GL5 2LG |
| Hillview Cottages | GL5 2LJ |
| Hope Mill Lane | GL5 2SH GL5 2SY |
| Hope Mills Business Centre | GL5 2SE |
| Hopemill Park | GL5 2SQ |
| Kingfisher Business Park | GL5 2BY |
| Land Adjoining | GL5 2QG |
| Lewiston Close | GL5 2RN |
| Lewiston Road | GL5 2RW |
| London Road | GL5 2AZ GL5 2BA GL5 2BD GL5 2BL GL5 2BN GL5 2QF GL5 2SA GL5 2SF GL5 2SG GL5 2TD GL5 2BE |
| Middle Road | GL5 2DL GL5 2DN GL5 2DP GL5 2DR GL5 2DW |
| Mill Close | GL5 2RT |
| Millbrook | GL5 2UN |
| Nursery Drive | GL5 2RL |
| Orchard Lane | GL5 2RD |
| Osbourne Terrace | GL5 2BJ |
| Phoenix Trading Estate | GL5 2BX |
| Phoenix Works | GL5 2BU |
| Port Lane | GL5 2QJ |
| Port Terrace | GL5 2QL |
| Quarhouse | GL5 2RR GL5 2RS |
| Rodborough Common | GL5 5BX |
| Rodborough Lane | GL5 2LH GL5 2LL GL5 2LN |
| Rope Walk | GL5 2DH |
| Shepherds Well | GL5 5DD |
| Spring Lane | GL5 2DT GL5 2DU GL5 2DX GL5 2EJ |
| St Peters Row | GL5 2DS |
| Sudeley Villas | GL5 2LZ |
| Swellshill | GL5 2SP GL5 2SR GL5 2SW |
| The Heavens | GL6 7LT |
| Thrupp Lane | GL5 2DF GL5 2DG GL5 2DQ GL5 2EF GL5 2EH GL5 2EN GL5 2EQ GL5 2ER GL5 2RG GL5 2DE GL5 2EG GL5 2EP |
| Toadsmoor Road | GL5 2TB GL5 2UG GL5 2TE |
| Yew Tree Way | GL5 2EL |
| Youngs Orchard | GL5 2RU |
| GL6 7LS GL5 2QD GL5 2SD GL5 2SU |
Transport near Thrupp
- FAQ
- Price Paid By Year
- Property Type Price
Frequently asked questions about Thrupp
What is the average price for a property for sale in Thrupp?
The average price for a property for sale in Thrupp is £495,670. This amount is 13% higher than the average price in Stroud. There are 185 property listings for sale in Thrupp.
What streets have the most expensive properties for sale in Thrupp?
The streets with the most expensive properties for sale in Thrupp are Bownham Park at an average of £888,333, Shepherds Well at an average of £827,500 and Bownham Mead at an average of £791,666.
What streets have the most affordable properties for sale in Thrupp?
The streets with the most affordable properties for sale in Thrupp are Osbourne Terrace at an average of £259,975, Nursery Drive at an average of £280,000 and Dallaway Estate at an average of £280,833.
Which train stations are available in or near Thrupp?
Some of the train stations available in or near Thrupp are Stroud, Stonehouse and Cam and Dursley.
Property Price Paid in Thrupp by Year
The average sold property price by year was:
| Year | Average Sold Price | Price Change |
Sold Properties
|
|---|---|---|---|
| 2025 | £493,508 | -9% |
24 Properties |
| 2024 | £537,281 | 16% |
32 Properties |
| 2023 | £453,016 | -9% |
30 Properties |
| 2022 | £493,373 | 1% |
30 Properties |
| 2021 | £488,590 | 11% |
45 Properties |
| 2020 | £436,177 | 14% |
45 Properties |
| 2019 | £376,181 | -16% |
52 Properties |
| 2018 | £436,504 | 7% |
44 Properties |
| 2017 | £406,773 | 22% |
40 Properties |
| 2016 | £315,536 | -4% |
37 Properties |
| 2015 | £329,220 | 7% |
25 Properties |
| 2014 | £306,184 | 23% |
42 Properties |
| 2013 | £235,894 | -20% |
26 Properties |
| 2012 | £282,193 | 4% |
23 Properties |
| 2011 | £271,285 | -10% |
28 Properties |
| 2010 | £298,002 | 17% |
34 Properties |
| 2009 | £248,647 | 5% |
26 Properties |
| 2008 | £235,458 | -41% |
23 Properties |
| 2007 | £332,361 | 27% |
58 Properties |
| 2006 | £242,685 | 11% |
41 Properties |
| 2005 | £216,267 | -3% |
48 Properties |
| 2004 | £223,646 | 3% |
50 Properties |
| 2003 | £216,287 | 19% |
53 Properties |
| 2002 | £174,435 | 19% |
62 Properties |
| 2001 | £140,874 | -1% |
45 Properties |
| 2000 | £142,419 | 30% |
55 Properties |
| 1999 | £100,285 | 2% |
54 Properties |
| 1998 | £98,469 | 5% |
36 Properties |
| 1997 | £93,066 | 11% |
57 Properties |
| 1996 | £83,129 | -11% |
53 Properties |
| 1995 | £92,621 | - |
34 Properties |
Property Price per Property Type in Thrupp
Here you can find historic sold price data in order to help with your property search.
The average Property Paid Price for specific property types in the last three years are:
| Property Type | Average Sold Price | Sold Properties |
|---|---|---|
| Semi Detached House | £357,444.00 | 27 Semi Detached Houses |
| Detached House | £691,705.00 | 39 Detached Houses |
| Terraced House | £315,585.00 | 14 Terraced Houses |
| Flat | £263,666.00 | 6 Flats |

