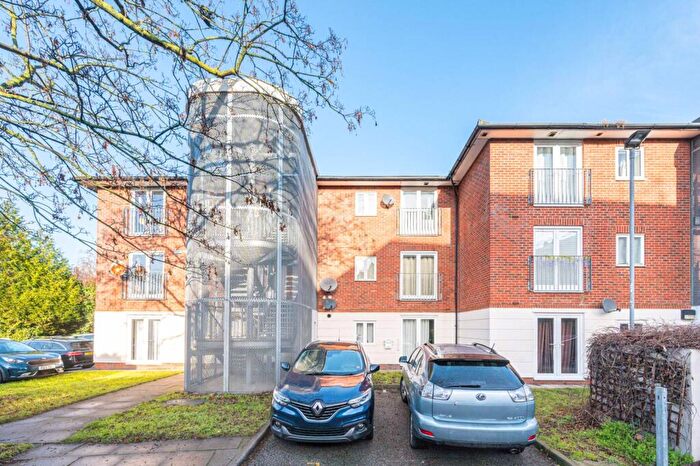
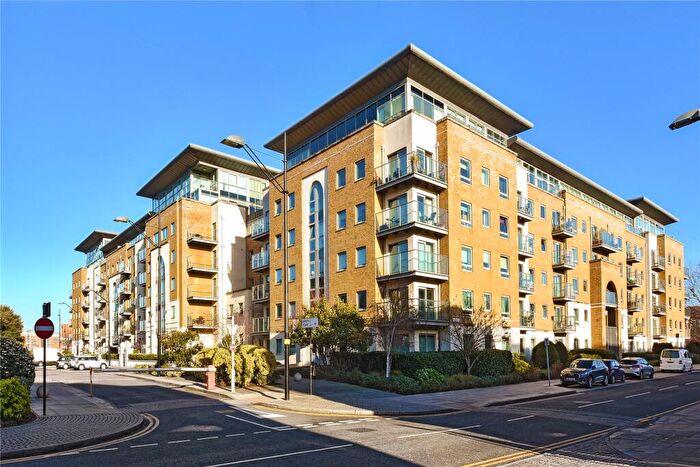
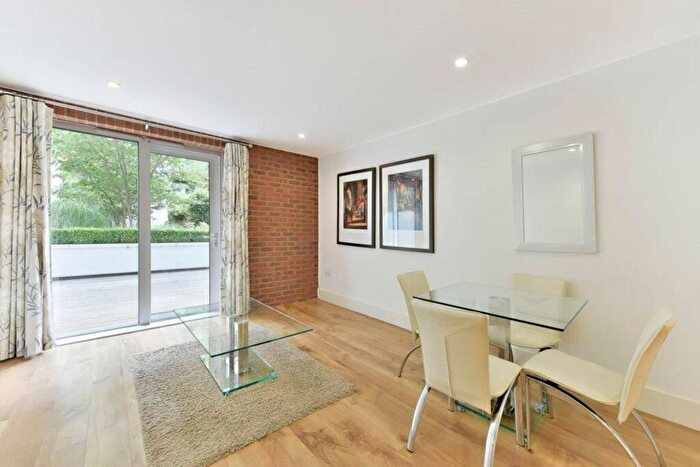
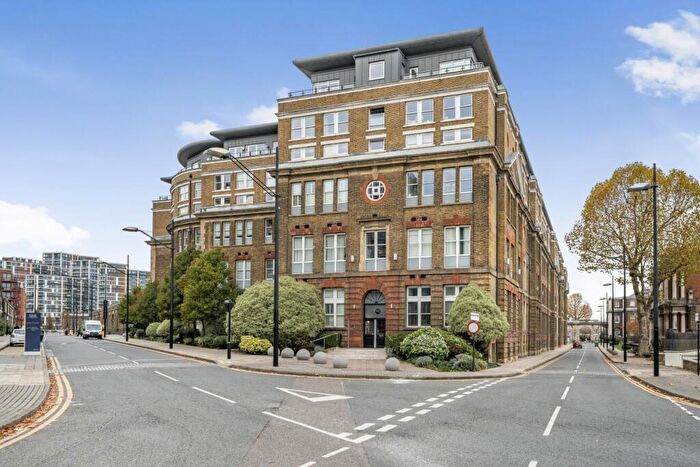
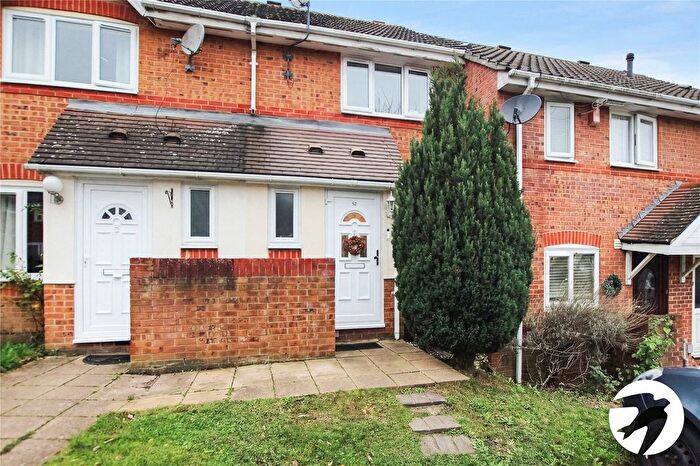
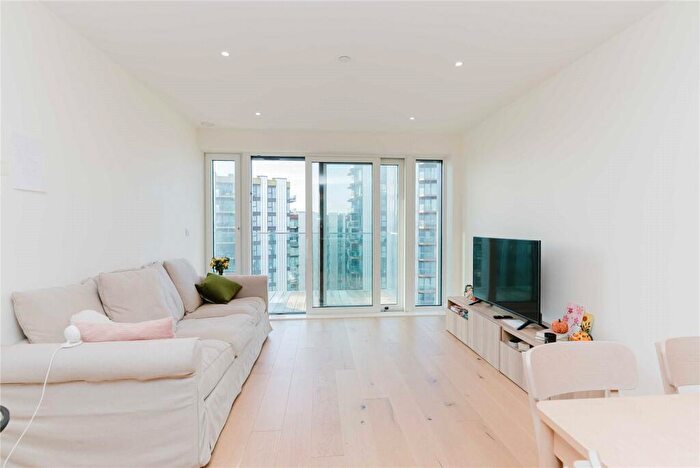
Houses for sale & to rent in Glyndon, London
House Prices in Glyndon
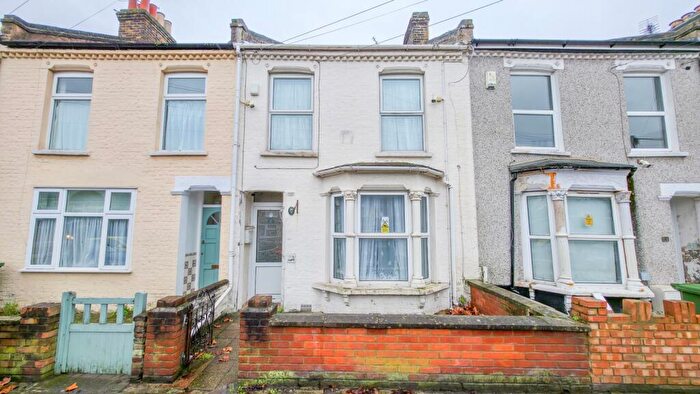
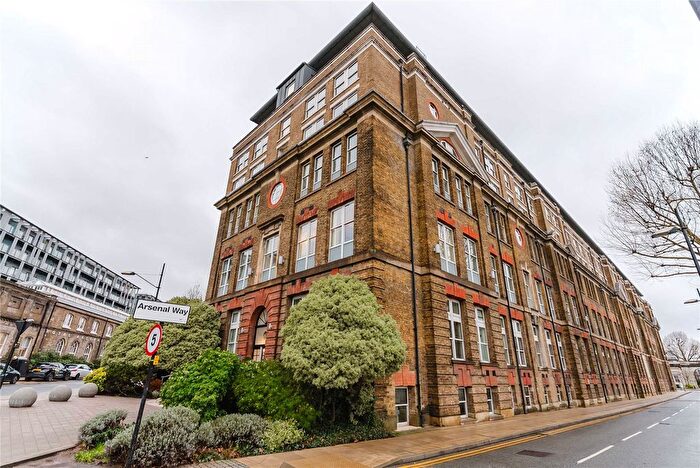
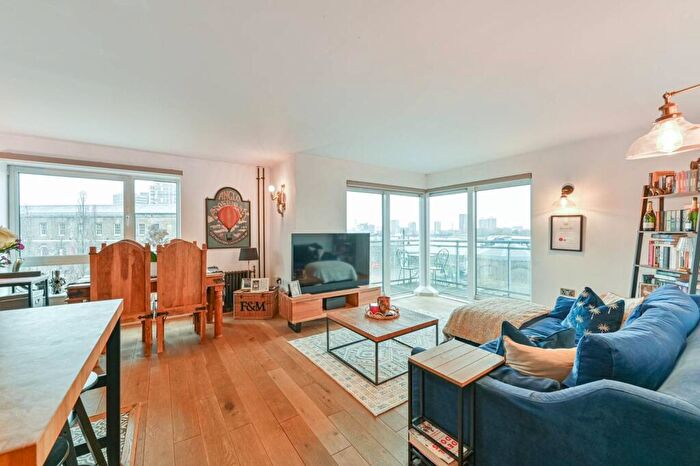
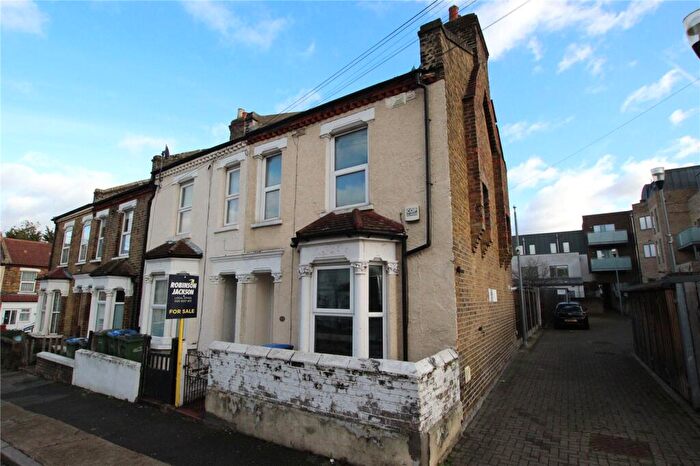
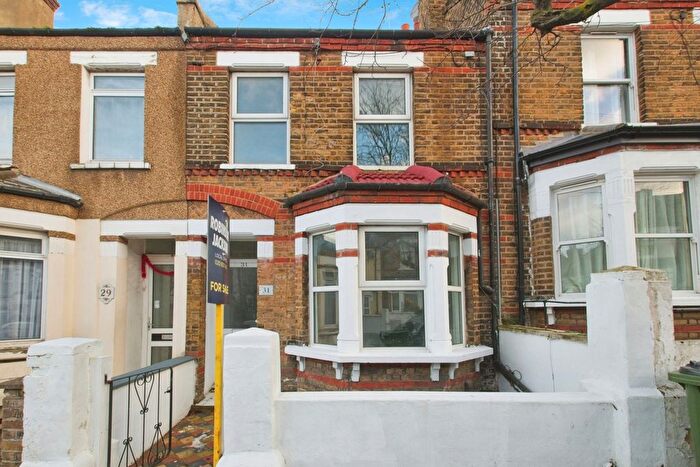
Properties in this part of Glyndon within London have an average house price of £369,160.00 and had 477 Property Transactions within the last 3 years¹. This area has 6,697 households² , where the most expensive property was sold for £1,831,000.00.
Properties for sale in Glyndon
Roads and Postcodes in Glyndon
Navigate through our locations to find the location of your next house in Glyndon, London for sale or to rent.
Transport near Glyndon
-
Plumstead Station
-
Woolwich Station
-
Woolwich Arsenal Station
-
Woolwich Dockyard Station
-
King George V Station
-
Gallions Reach Station
-
Cyprus Station
-
Abbey Wood Station
-
London City Airport Station
-
Beckton Park Station
- FAQ
- Price Paid By Year
- Property Type Price
Frequently asked questions about Glyndon
What is the average price for a property for sale in Glyndon?
The average price for a property for sale in Glyndon is £369,160. This amount is 26% lower than the average price in London. There are 4,134 property listings for sale in Glyndon.
What streets have the most expensive properties for sale in Glyndon?
The streets with the most expensive properties for sale in Glyndon are St Johns Terrace at an average of £520,750, Lakedale Road at an average of £501,665 and St Margarets Grove at an average of £485,500.
What streets have the most affordable properties for sale in Glyndon?
The streets with the most affordable properties for sale in Glyndon are Glyndon Road at an average of £234,083, Heavitree Road at an average of £236,666 and Perrott Street at an average of £240,000.
Which train stations are available in or near Glyndon?
Some of the train stations available in or near Glyndon are Plumstead, Woolwich Arsenal and Woolwich Dockyard.
Property Price Paid in Glyndon by Year
The average sold property price by year was:
| Year | Average Sold Price | Price Change |
Sold Properties
|
|---|---|---|---|
| 2025 | £357,313 | -7% |
75 Properties |
| 2024 | £382,884 | 1% |
138 Properties |
| 2023 | £378,582 | 7% |
133 Properties |
| 2022 | £351,921 | -4% |
131 Properties |
| 2021 | £364,485 | 5% |
181 Properties |
| 2020 | £345,039 | 7% |
95 Properties |
| 2019 | £320,838 | -3% |
104 Properties |
| 2018 | £330,337 | 4% |
144 Properties |
| 2017 | £318,196 | 8% |
154 Properties |
| 2016 | £292,886 | 10% |
179 Properties |
| 2015 | £264,023 | 12% |
207 Properties |
| 2014 | £231,765 | 17% |
207 Properties |
| 2013 | £191,344 | 4% |
145 Properties |
| 2012 | £183,600 | 3% |
100 Properties |
| 2011 | £178,766 | -3% |
108 Properties |
| 2010 | £184,097 | 15% |
92 Properties |
| 2009 | £156,833 | -20% |
86 Properties |
| 2008 | £188,724 | -2% |
110 Properties |
| 2007 | £192,079 | 8% |
354 Properties |
| 2006 | £176,134 | -4% |
300 Properties |
| 2005 | £183,908 | 8% |
325 Properties |
| 2004 | £169,563 | -2% |
428 Properties |
| 2003 | £173,425 | 31% |
430 Properties |
| 2002 | £119,703 | 24% |
310 Properties |
| 2001 | £91,450 | 12% |
247 Properties |
| 2000 | £80,841 | 18% |
220 Properties |
| 1999 | £66,259 | 14% |
183 Properties |
| 1998 | £57,095 | 14% |
201 Properties |
| 1997 | £49,276 | 15% |
210 Properties |
| 1996 | £41,961 | -10% |
172 Properties |
| 1995 | £45,965 | - |
104 Properties |
Property Price per Property Type in Glyndon
Here you can find historic sold price data in order to help with your property search.
The average Property Paid Price for specific property types in the last three years are:
| Property Type | Average Sold Price | Sold Properties |
|---|---|---|
| Flat | £292,883.00 | 189 Flats |
| Semi Detached House | £420,553.00 | 14 Semi Detached Houses |
| Detached House | £477,887.00 | 4 Detached Houses |
| Terraced House | £418,279.00 | 270 Terraced Houses |


