
Houses for sale & to rent in Woolwich Common, London
House Prices in Woolwich Common
Properties in this part of Woolwich Common within London have an average house price of £364,496.00 and had 454 Property Transactions within the last 3 years¹. This area has 6,066 households² , where the most expensive property was sold for £935,000.00.
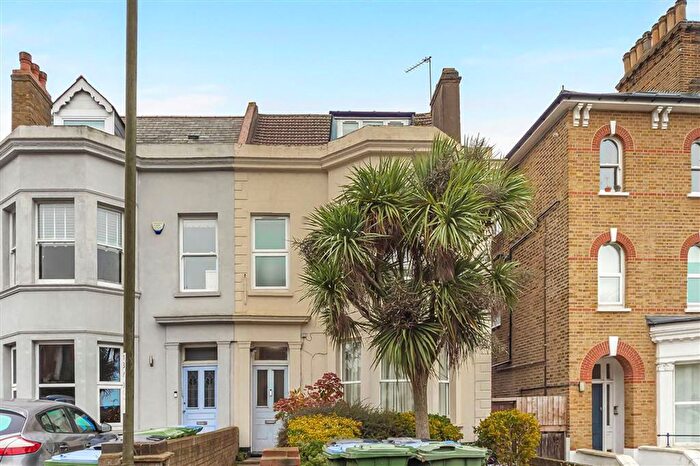
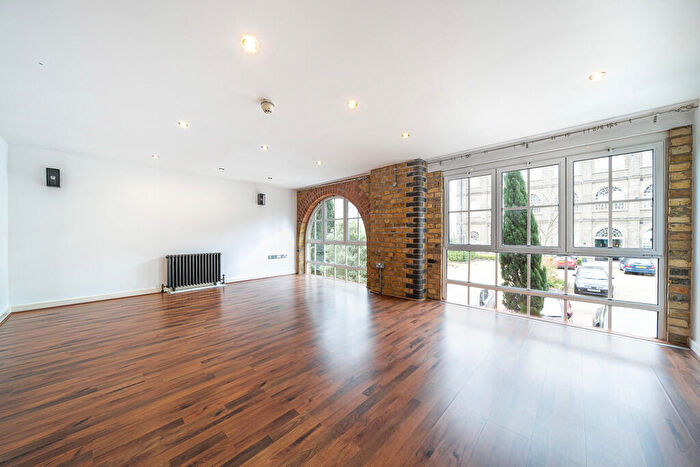
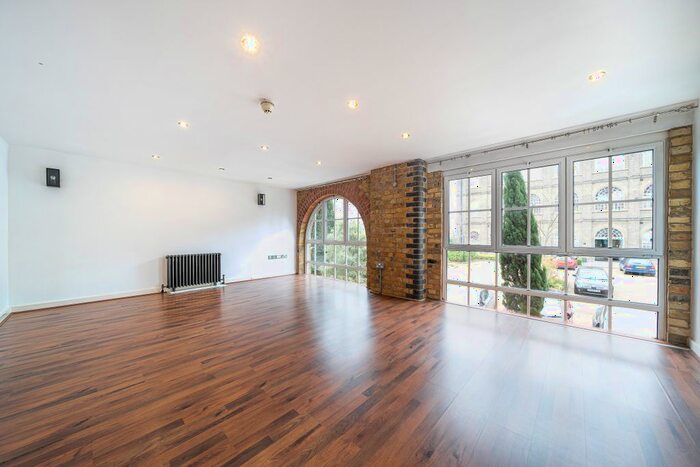
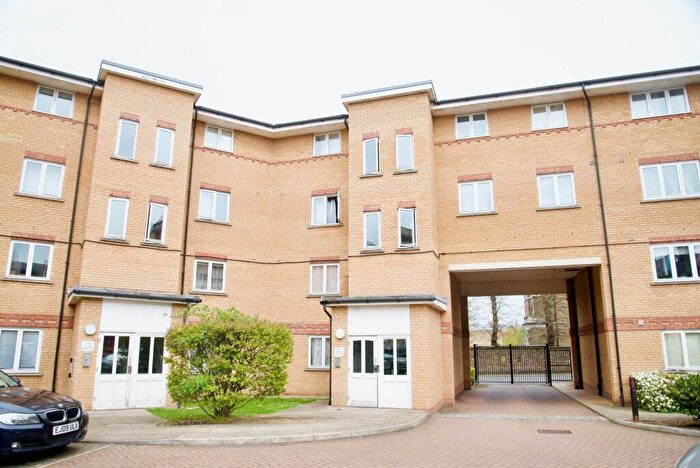
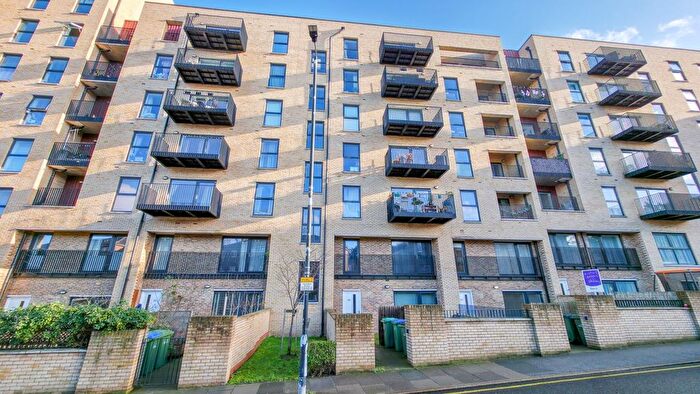
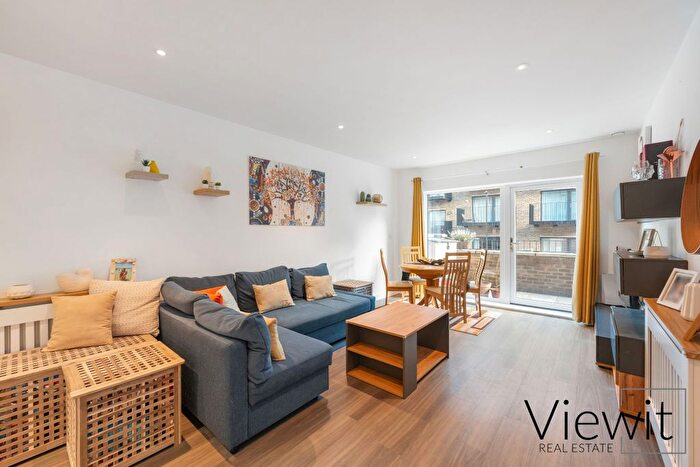
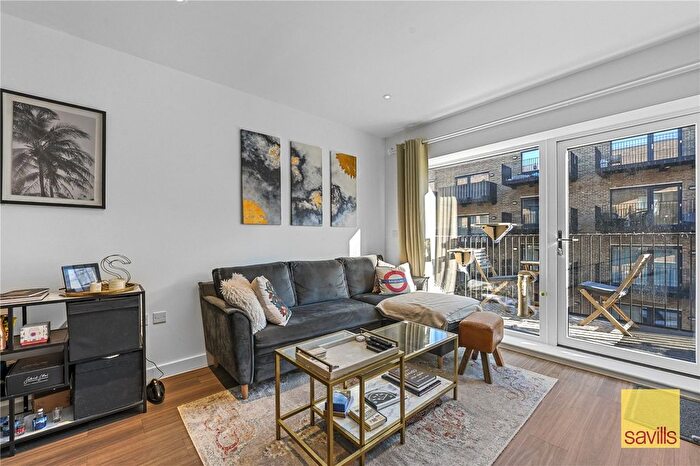
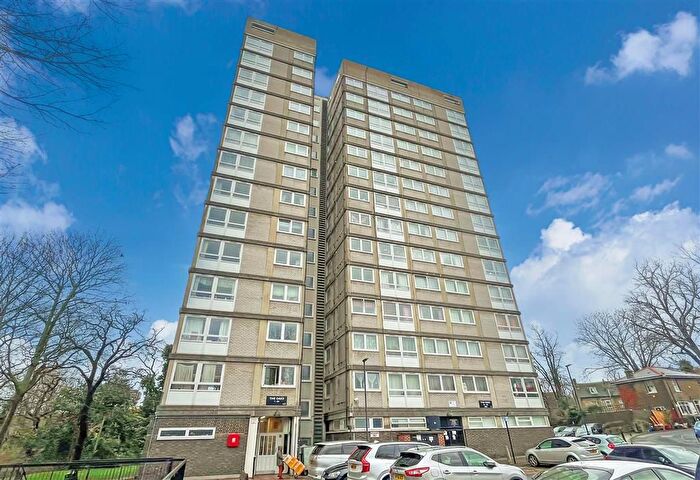
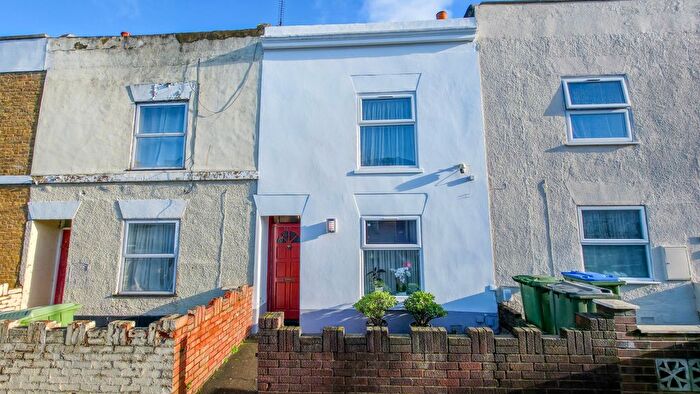
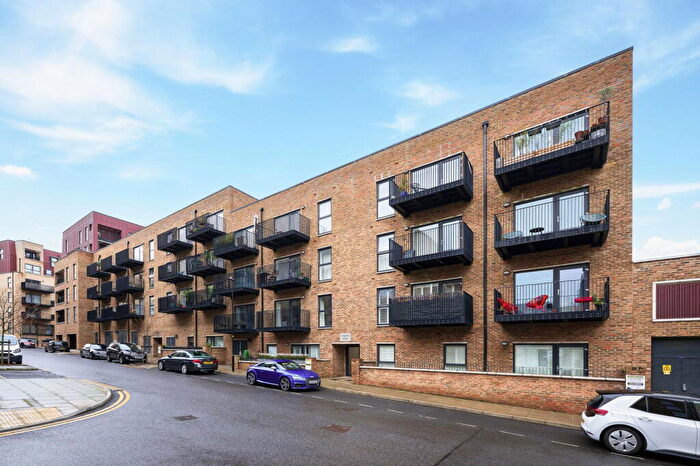
Properties for sale in Woolwich Common
![]()
If you are looking to sell your house, let it out, or receive a property valuation, an expert can help you.
Click the button below to get started.


Roads and Postcodes in Woolwich Common
Navigate through our locations to find the location of your next house in Woolwich Common, London for sale or to rent.
Transport near Woolwich Common
-

 Woolwich Arsenal Station
 -
 Woolwich Station
 -
Woolwich Dockyard Station
-
Plumstead Station
-
King George V Station
-
Charlton Station
-
London City Airport Station
-
Falconwood Station
-
Cyprus Station
-
Gallions Reach Station
- FAQ
- Price Paid By Year
- Property Type Price
Frequently asked questions about Woolwich Common
What is the average price for a property for sale in Woolwich Common?
The average price for a property for sale in Woolwich Common is £364,496. This amount is 27% lower than the average price in London. There are 4,531 property listings for sale in Woolwich Common.
What streets have the most expensive properties for sale in Woolwich Common?
The streets with the most expensive properties for sale in Woolwich Common are Isla Road at an average of £663,500, Masons Hill at an average of £625,000 and Vambery Road at an average of £572,375.
What streets have the most affordable properties for sale in Woolwich Common?
The streets with the most affordable properties for sale in Woolwich Common are Long Walk at an average of £181,250, Woolwich Common at an average of £187,500 and Barnfield Road at an average of £214,875.
Which train stations are available in or near Woolwich Common?
Some of the train stations available in or near Woolwich Common are Woolwich Arsenal, Woolwich Dockyard and Plumstead.
Property Price Paid in Woolwich Common by Year
The average sold property price by year was:
| Year | Average Sold Price | Price Change |
Sold Properties
|
|---|---|---|---|
| 2025 | £377,567 | -1% |
78 Properties |
| 2024 | £382,278 | 6% |
102 Properties |
| 2023 | £358,788 | 3% |
139 Properties |
| 2022 | £349,384 | -17% |
135 Properties |
| 2021 | £408,779 | 8% |
154 Properties |
| 2020 | £375,332 | -4% |
169 Properties |
| 2019 | £388,810 | 4% |
229 Properties |
| 2018 | £372,823 | -2% |
202 Properties |
| 2017 | £379,077 | 8% |
180 Properties |
| 2016 | £350,166 | 18% |
174 Properties |
| 2015 | £286,163 | 11% |
192 Properties |
| 2014 | £254,743 | 8% |
264 Properties |
| 2013 | £234,537 | 22% |
170 Properties |
| 2012 | £182,800 | -1% |
84 Properties |
| 2011 | £183,886 | 1% |
71 Properties |
| 2010 | £182,183 | -13% |
67 Properties |
| 2009 | £205,239 | 6% |
66 Properties |
| 2008 | £192,809 | 3% |
119 Properties |
| 2007 | £187,571 | 10% |
204 Properties |
| 2006 | £169,309 | -1% |
199 Properties |
| 2005 | £171,443 | 8% |
190 Properties |
| 2004 | £157,436 | 11% |
170 Properties |
| 2003 | £140,728 | 16% |
238 Properties |
| 2002 | £118,050 | 17% |
202 Properties |
| 2001 | £97,474 | 18% |
167 Properties |
| 2000 | £79,765 | 10% |
150 Properties |
| 1999 | £71,848 | 23% |
149 Properties |
| 1998 | £55,155 | 11% |
144 Properties |
| 1997 | £48,998 | 9% |
171 Properties |
| 1996 | £44,388 | -1% |
106 Properties |
| 1995 | £44,629 | - |
95 Properties |
Property Price per Property Type in Woolwich Common
Here you can find historic sold price data in order to help with your property search.
The average Property Paid Price for specific property types in the last three years are:
| Property Type | Average Sold Price | Sold Properties |
|---|---|---|
| Flat | £314,512.00 | 293 Flats |
| Terraced House | £454,276.00 | 149 Terraced Houses |
| Semi Detached House | £462,700.00 | 10 Semi Detached Houses |
| Detached House | £507,500.00 | 2 Detached Houses |