
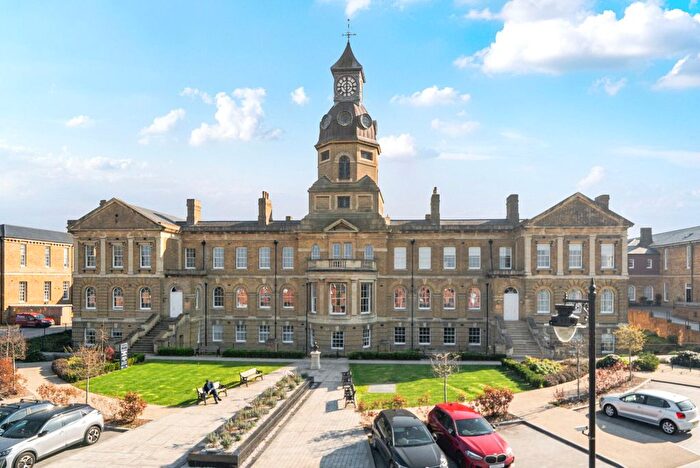
Houses for sale & to rent in Wellington, Aldershot
House Prices in Wellington
Properties in Wellington have an average house price of £254k and had 211 Property Transactions within the last 3 years¹.
Wellington is an area in Aldershot, Hampshire with 2,120 households², where the most expensive property was sold for £685k.
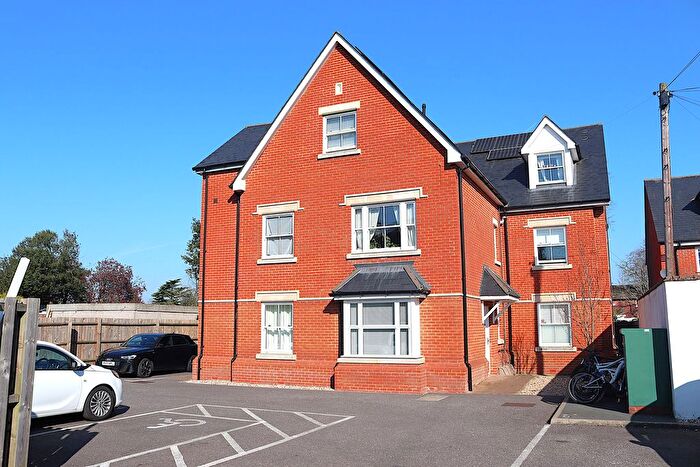
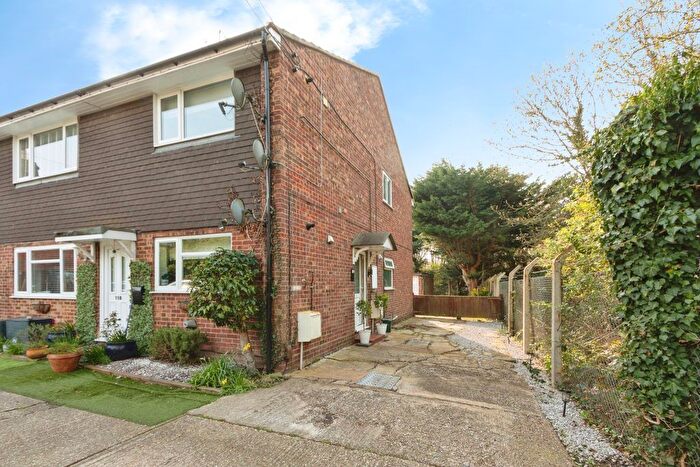
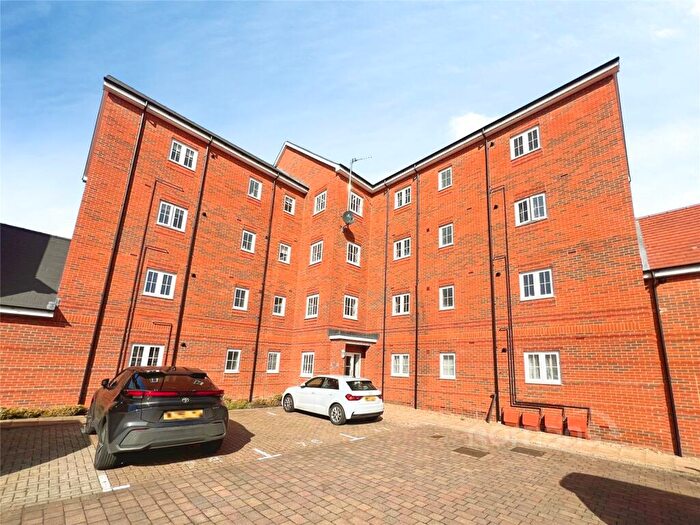
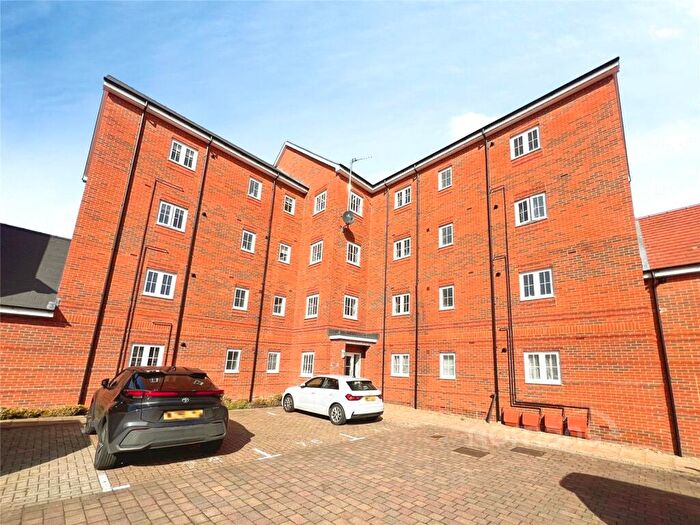
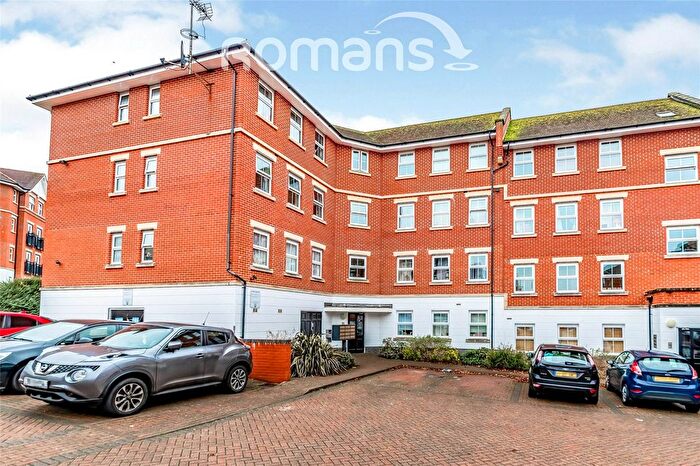
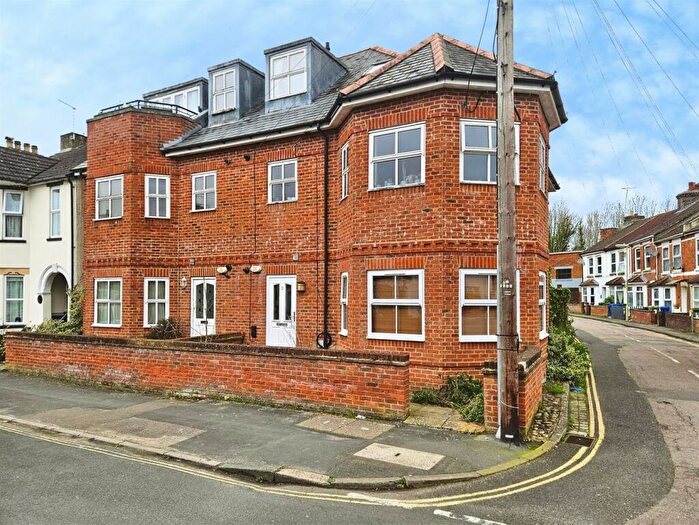
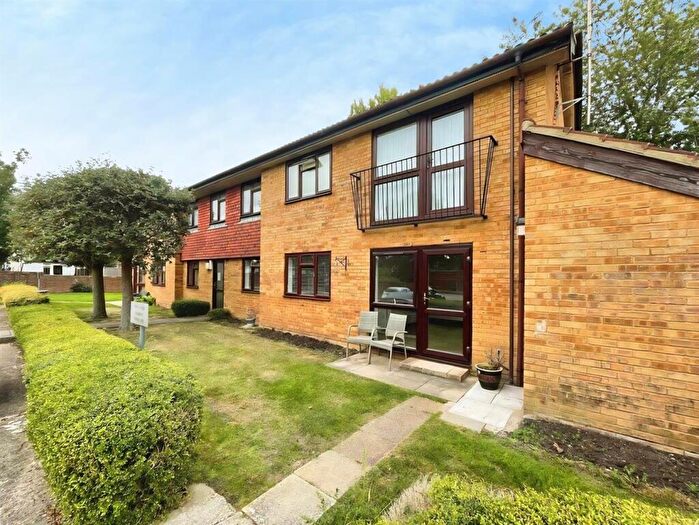
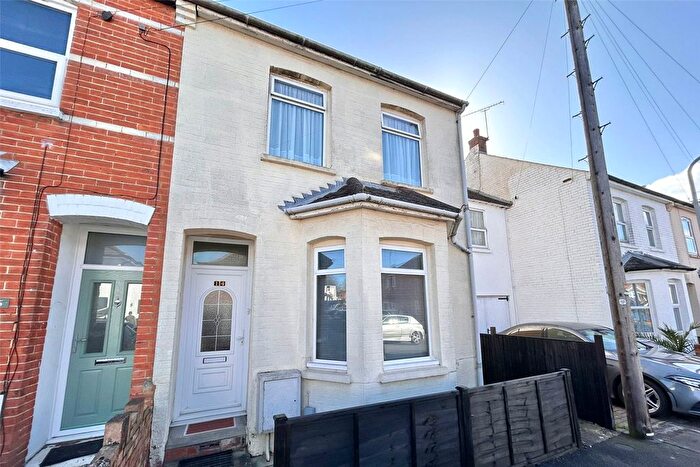
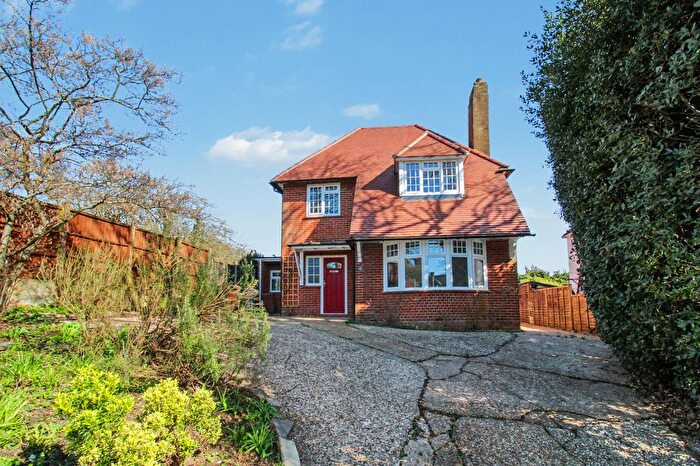
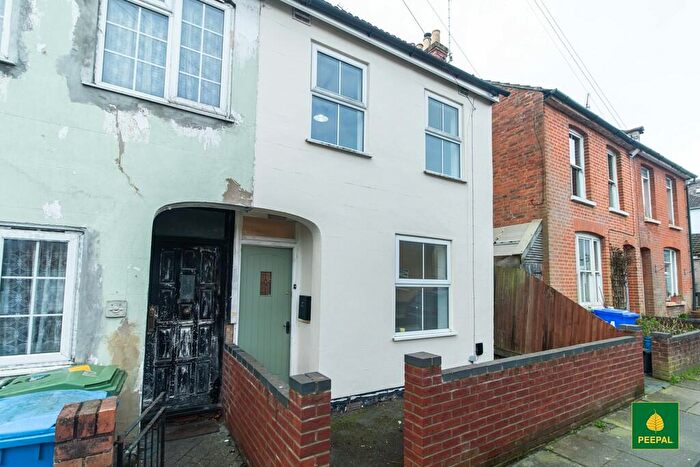
Properties for sale in Wellington


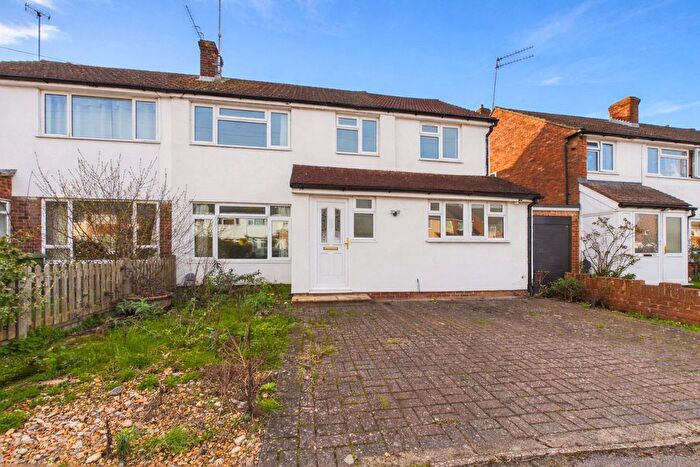
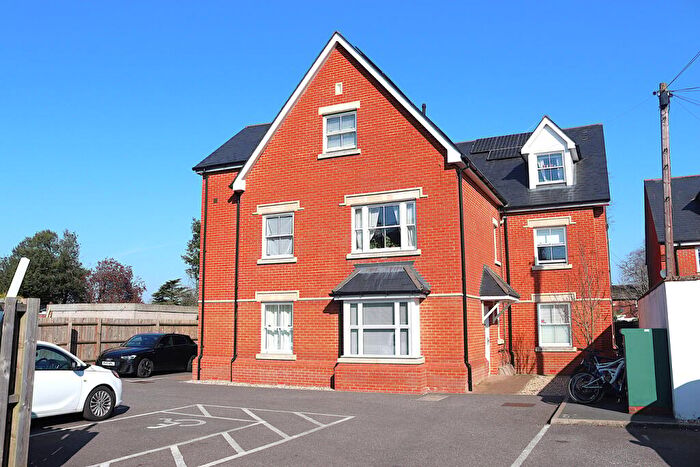

![]()
If you are looking to sell your house, let it out, or receive a property valuation, an expert can help you.
Click the button below to get started.


Roads and Postcodes in Wellington
Navigate through our locations to find the location of your next house in Wellington, Aldershot for sale or to rent.
Transport near Wellington

- FAQ
- Price Paid By Year
- Property Type Price
Frequently asked questions about Wellington
What is the average price for a property for sale in Wellington?
The average price for a property for sale in Wellington is £254,333. This amount is 19% lower than the average price in Aldershot. There are 3,245 property listings for sale in Wellington.
What streets have the most expensive properties for sale in Wellington?
The streets with the most expensive properties for sale in Wellington are Inkerman Lane at an average of £525,666, HOPE GRANTS ROAD at an average of £521,825 and Barrosa Road at an average of £515,000.
What streets have the most affordable properties for sale in Wellington?
The streets with the most affordable properties for sale in Wellington are Nelson Street at an average of £103,571, Barrack Road at an average of £119,000 and Alice Road at an average of £123,000.
Which train stations are available in or near Wellington?
Some of the train stations available in or near Wellington are Aldershot, North Camp and Ash.
Property Price Paid in Wellington by Year
The average sold property price by year was:
| Year | Average Sold Price | Price Change |
Sold Properties
|
|---|---|---|---|
| 2025 | £272,709 | 10% |
58 Properties |
| 2024 | £244,158 | -4% |
100 Properties |
| 2023 | £253,420 | -25% |
53 Properties |
| 2022 | £317,726 | 11% |
86 Properties |
| 2021 | £283,488 | -20% |
115 Properties |
| 2020 | £341,599 | 4% |
172 Properties |
| 2019 | £327,555 | 3% |
210 Properties |
| 2018 | £318,298 | 15% |
111 Properties |
| 2017 | £270,644 | 6% |
152 Properties |
| 2016 | £253,230 | 31% |
158 Properties |
| 2015 | £175,741 | 23% |
82 Properties |
| 2014 | £134,644 | 9% |
70 Properties |
| 2013 | £123,090 | 3% |
40 Properties |
| 2012 | £119,475 | -19% |
33 Properties |
| 2011 | £141,654 | 1% |
22 Properties |
| 2010 | £140,294 | 9% |
27 Properties |
| 2009 | £127,038 | -31% |
21 Properties |
| 2008 | £166,137 | 15% |
85 Properties |
| 2007 | £141,141 | -12% |
89 Properties |
| 2006 | £157,915 | 7% |
250 Properties |
| 2005 | £146,546 | 22% |
56 Properties |
| 2004 | £114,340 | -3% |
55 Properties |
| 2003 | £117,715 | 7% |
60 Properties |
| 2002 | £110,021 | -15% |
49 Properties |
| 2001 | £126,030 | 39% |
36 Properties |
| 2000 | £77,386 | 17% |
38 Properties |
| 1999 | £63,854 | -4% |
33 Properties |
| 1998 | £66,680 | 18% |
38 Properties |
| 1997 | £54,996 | 1% |
59 Properties |
| 1996 | £54,617 | 12% |
34 Properties |
| 1995 | £48,316 | - |
11 Properties |
Property Price per Property Type in Wellington
Here you can find historic sold price data in order to help with your property search.
The average Property Paid Price for specific property types in the last three years are:
| Property Type | Average Sold Price | Sold Properties |
|---|---|---|
| Flat | £194,993.00 | 160 Flats |
| Semi Detached House | £414,498.00 | 18 Semi Detached Houses |
| Detached House | £522,546.00 | 15 Detached Houses |
| Terraced House | £398,122.00 | 18 Terraced Houses |