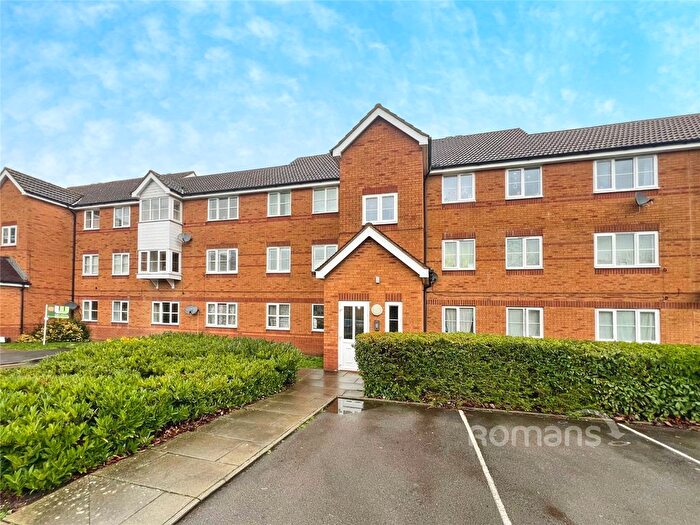
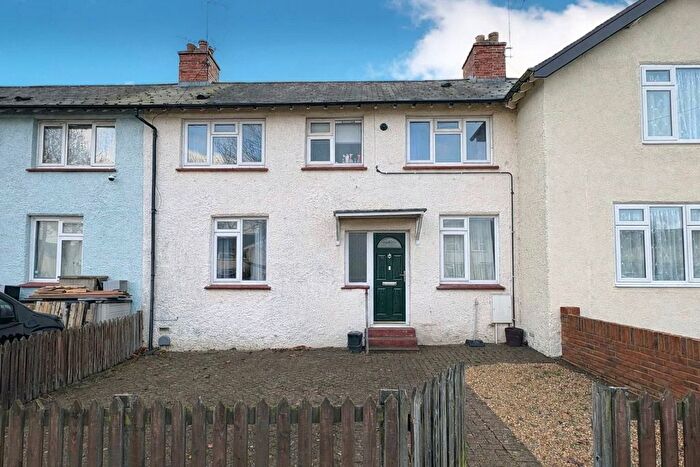
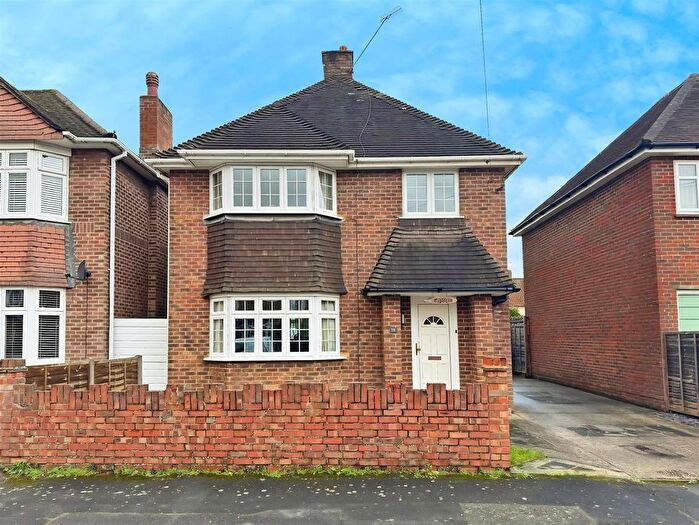
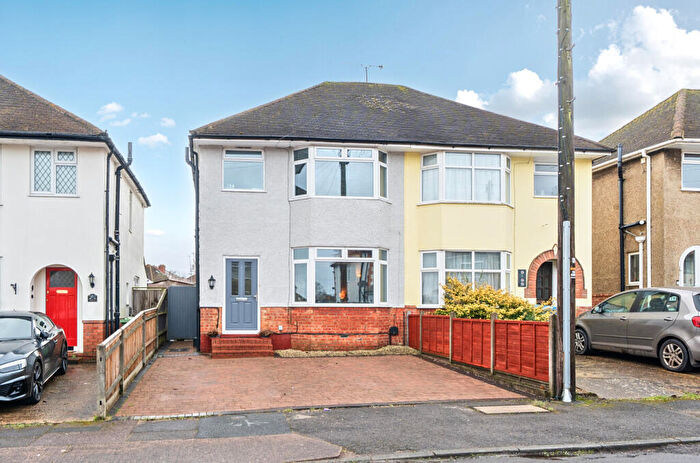
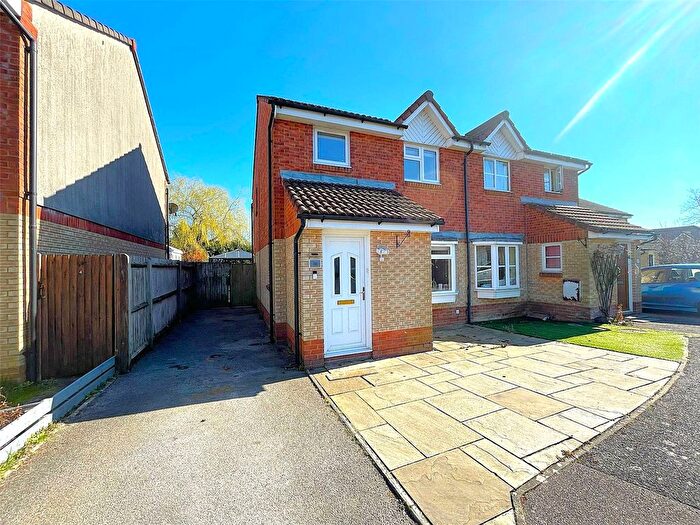
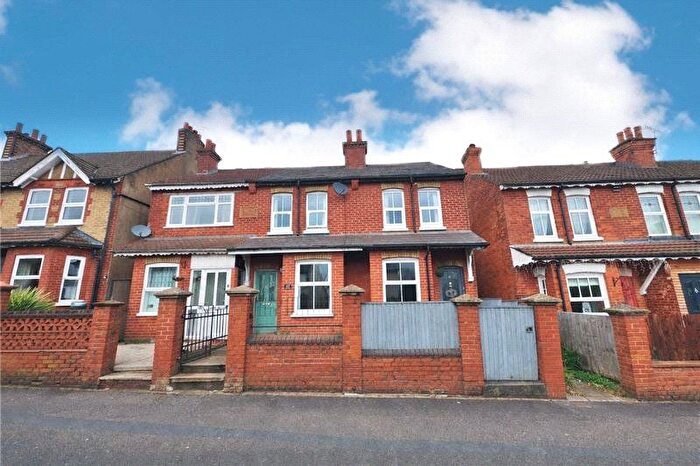
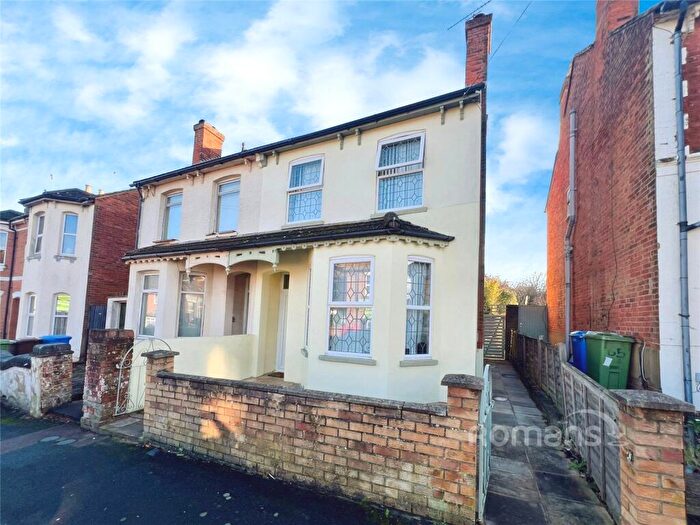
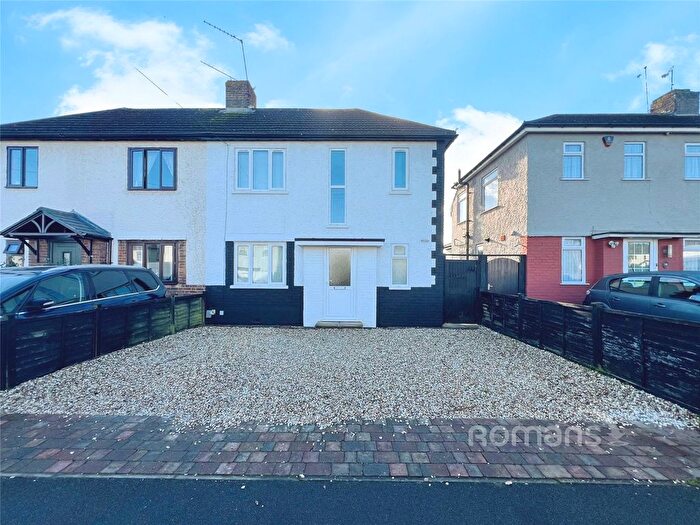
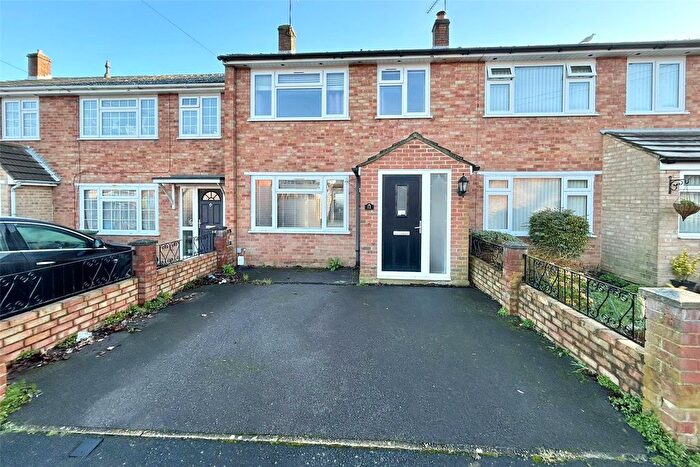
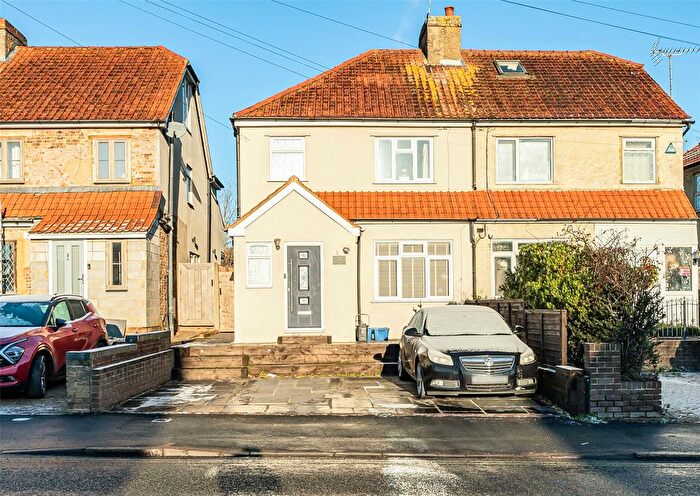
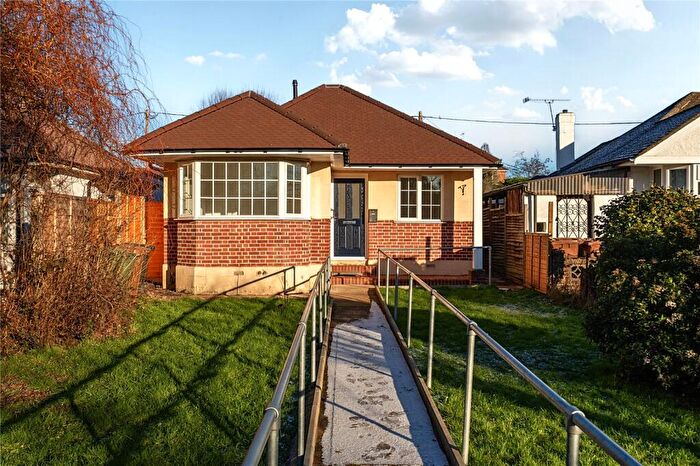
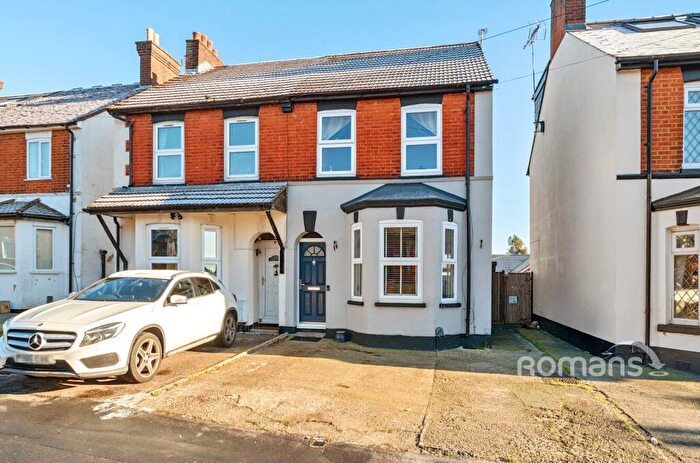
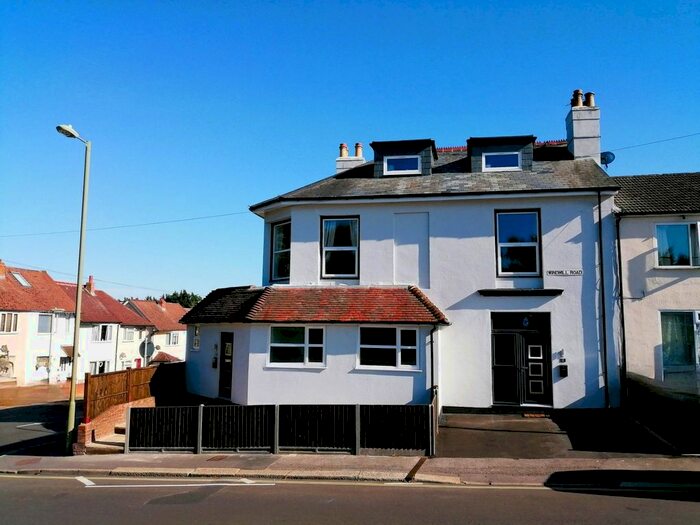
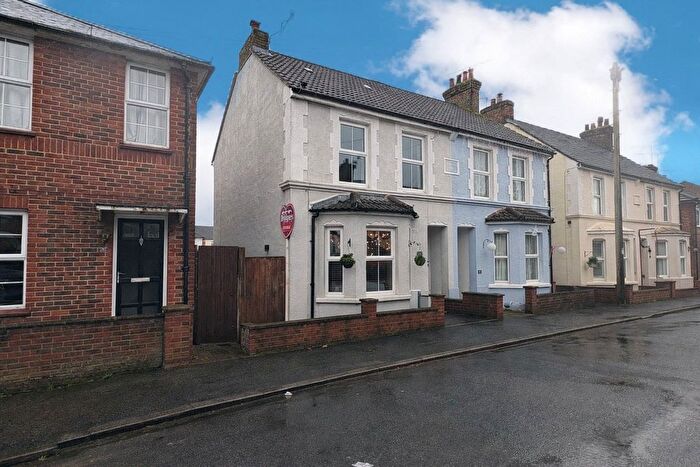
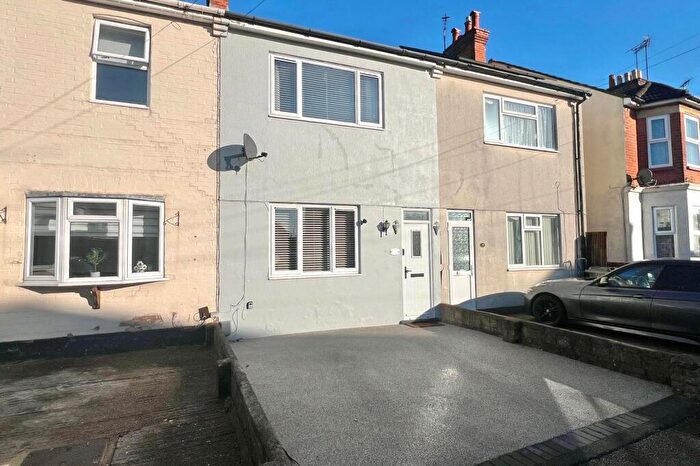
Houses for sale & to rent in Aldershot Park, Aldershot
House Prices in Aldershot Park
Properties in Aldershot Park have an average house price of £332,373.00 and had 291 Property Transactions within the last 3 years¹.
Aldershot Park is an area in Aldershot, Hampshire with 2,906 households², where the most expensive property was sold for £526,000.00.
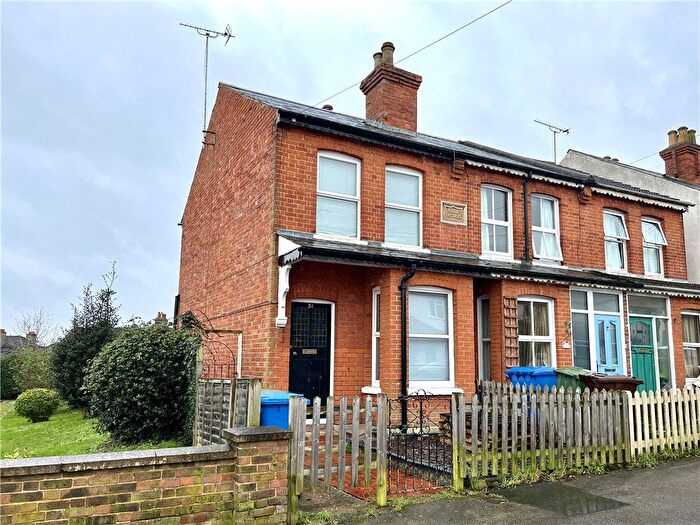
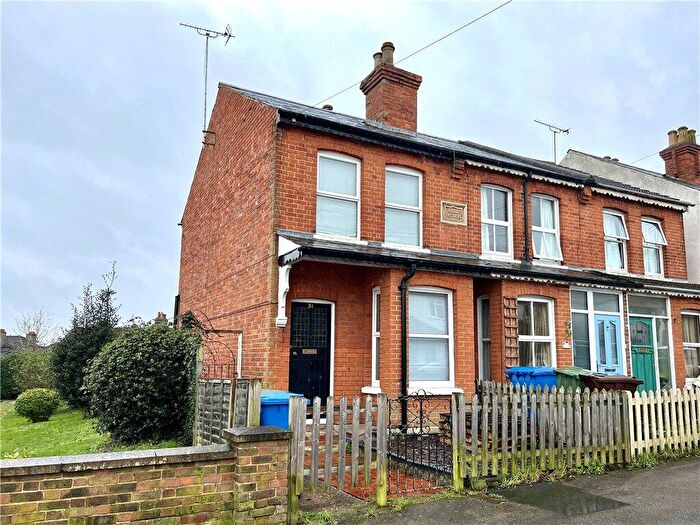
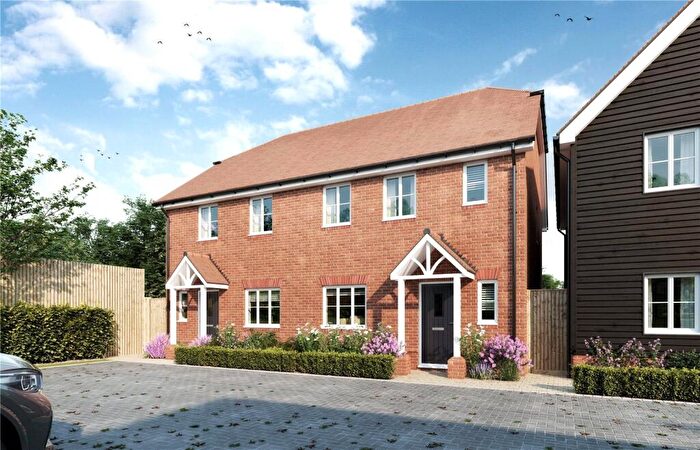
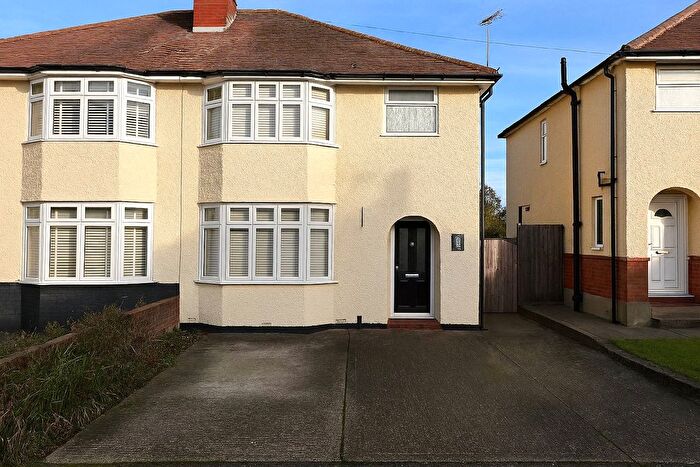
Properties for sale in Aldershot Park
Roads and Postcodes in Aldershot Park
Navigate through our locations to find the location of your next house in Aldershot Park, Aldershot for sale or to rent.
| Streets | Postcodes |
|---|---|
| Alfonso Close | GU12 4HJ |
| Allden Avenue | GU12 4AG |
| Allden Gardens | GU12 4AQ |
| Andover Way | GU11 3RJ |
| Ash Road | GU12 4BX GU12 4BZ GU12 4DB GU12 4DD GU12 4ES GU12 4EY GU12 4EZ GU12 4ET GU12 4HD |
| Aspen Grove | GU12 4EU GU12 4EX |
| Basing Drive | GU11 3RL |
| Beech Close | GU12 4DT |
| Blackwater Trading Estate | GU12 4DJ |
| Blackwater Way | GU12 4DL GU12 4DN GU12 4DP GU12 4DQ GU12 4DX |
| Brighton Road | GU12 4HG GU12 4HL GU12 4HN GU12 4HQ |
| Bryce Gardens | GU11 3SZ |
| Cadnam Close | GU11 3RN |
| Calton Gardens | GU11 3TB |
| Campbell Close | GU11 3SD |
| Cedar Close | GU12 4BD |
| Chestnut Avenue | GU12 4AU |
| Chetwode Place | GU12 4BS |
| Chrismas Avenue | GU12 4PJ |
| Chrismas Place | GU12 4PL |
| Church Road | GU11 3PR |
| Coleman Road | GU12 4BY |
| Commercial Road | GU12 4HH |
| Crossways | GU12 4LX |
| Elston Place | GU12 4HY |
| Elston Road | GU12 4EH GU12 4HX GU12 4HZ |
| Fisher Lane | GU12 4JY |
| George Gardens | GU11 3TD |
| Gillian Avenue | GU12 4HS GU12 4HT |
| Gillian Close | GU12 4HU |
| Gloucester Road | GU11 3SH GU11 3SJ GU11 3SL GU11 3SQ |
| Guildford Road | GU12 4BN GU12 4BW GU12 4BP |
| Hampshire Close | GU12 4AN |
| Hawthorn Close | GU12 4AX |
| Heron Wood Road | GU12 4AJ GU12 4AL GU12 4BH GU12 4BQ |
| Herrett Street | GU12 4ED GU12 4EE |
| High Street | GU12 4NE GU12 4NF |
| Highclere Road | GU12 4EQ |
| Institute Road | GU12 4DA |
| Lillywhite Close | GU12 4PE |
| Lower Farnham Road | GU11 3QY GU11 3RA GU11 3RE GU12 4DY GU12 4EA GU12 4EJ GU12 4EL GU12 4EN GU12 4EP GU12 4EW GU12 4DZ |
| Lyndhurst Avenue | GU11 3RW |
| Maple Walk | GU12 4AW |
| Morland Road | GU11 3SB GU11 3SE GU11 3SF GU11 3SG |
| Newcome Place | GU12 4AH |
| Newport Road | GU12 4LL |
| Oak Tree Close | GU12 4BE |
| Oak Way | GU12 4BA GU12 4BB |
| Orchard Gardens | GU12 4HP |
| Orchard Way | GU12 4HR GU12 4HW |
| Overton Close | GU11 3RP |
| Pembury Place | GU12 4PF |
| Pool Road | GU11 3SN GU11 3SW |
| Raglan Close | GU12 4PG |
| Romsey Close | GU11 3RR |
| Royale Close | GU11 3PT |
| Selborne Avenue | GU11 3RF GU11 3RG GU11 3RH GU11 3RQ |
| Shalden Road | GU12 4EF |
| Shortdale Road | GU11 3RS |
| Stockbridge Drive | GU11 3RT |
| Stone Street | GU12 4EB |
| The Avenue | GU12 4BJ GU12 4BL |
| Tichborne Place | GU12 4ER |
| Tongham Road | GU12 4AA GU12 4AB GU12 4AP GU12 4AR GU12 4AT GU12 4AS |
| Whitchurch Close | GU11 3RU GU11 3RX |
| Whyte Avenue | GU12 4AD GU12 4AE GU12 4AF |
| Willow Way | GU12 4AY GU12 4AZ |
| Woodcot Terrace | GU12 4EG |
Transport near Aldershot Park
- FAQ
- Price Paid By Year
- Property Type Price
Frequently asked questions about Aldershot Park
What is the average price for a property for sale in Aldershot Park?
The average price for a property for sale in Aldershot Park is £332,373. This amount is 4% higher than the average price in Aldershot. There are 853 property listings for sale in Aldershot Park.
What streets have the most expensive properties for sale in Aldershot Park?
The streets with the most expensive properties for sale in Aldershot Park are Oak Tree Close at an average of £440,000, Chrismas Avenue at an average of £420,750 and Elston Place at an average of £407,000.
What streets have the most affordable properties for sale in Aldershot Park?
The streets with the most affordable properties for sale in Aldershot Park are Newport Road at an average of £153,600, Overton Close at an average of £206,000 and Stockbridge Drive at an average of £227,500.
Which train stations are available in or near Aldershot Park?
Some of the train stations available in or near Aldershot Park are Aldershot, Ash and Ash Vale.
Property Price Paid in Aldershot Park by Year
The average sold property price by year was:
| Year | Average Sold Price | Price Change |
Sold Properties
|
|---|---|---|---|
| 2025 | £338,605 | 3% |
48 Properties |
| 2024 | £329,050 | 3% |
69 Properties |
| 2023 | £317,801 | -9% |
88 Properties |
| 2022 | £346,470 | 11% |
86 Properties |
| 2021 | £307,800 | 8% |
93 Properties |
| 2020 | £282,534 | 4% |
76 Properties |
| 2019 | £271,045 | -6% |
102 Properties |
| 2018 | £286,704 | -0,1% |
95 Properties |
| 2017 | £286,906 | 5% |
98 Properties |
| 2016 | £273,863 | 13% |
101 Properties |
| 2015 | £237,314 | 11% |
111 Properties |
| 2014 | £210,181 | 4% |
103 Properties |
| 2013 | £201,412 | 7% |
101 Properties |
| 2012 | £186,333 | 2% |
84 Properties |
| 2011 | £181,826 | -5% |
70 Properties |
| 2010 | £190,779 | 4% |
71 Properties |
| 2009 | £182,257 | -7% |
80 Properties |
| 2008 | £195,634 | 2% |
66 Properties |
| 2007 | £190,918 | 6% |
181 Properties |
| 2006 | £178,637 | 5% |
155 Properties |
| 2005 | £169,771 | 1% |
110 Properties |
| 2004 | £167,991 | 3% |
149 Properties |
| 2003 | £163,330 | 13% |
187 Properties |
| 2002 | £141,701 | 21% |
188 Properties |
| 2001 | £112,086 | 6% |
153 Properties |
| 2000 | £105,319 | 16% |
120 Properties |
| 1999 | £88,654 | 15% |
149 Properties |
| 1998 | £74,937 | 14% |
129 Properties |
| 1997 | £64,608 | 10% |
124 Properties |
| 1996 | £57,965 | -1% |
115 Properties |
| 1995 | £58,281 | - |
97 Properties |
Property Price per Property Type in Aldershot Park
Here you can find historic sold price data in order to help with your property search.
The average Property Paid Price for specific property types in the last three years are:
| Property Type | Average Sold Price | Sold Properties |
|---|---|---|
| Semi Detached House | £368,682.00 | 118 Semi Detached Houses |
| Detached House | £409,535.00 | 14 Detached Houses |
| Terraced House | £332,690.00 | 124 Terraced Houses |
| Flat | £177,971.00 | 35 Flats |

