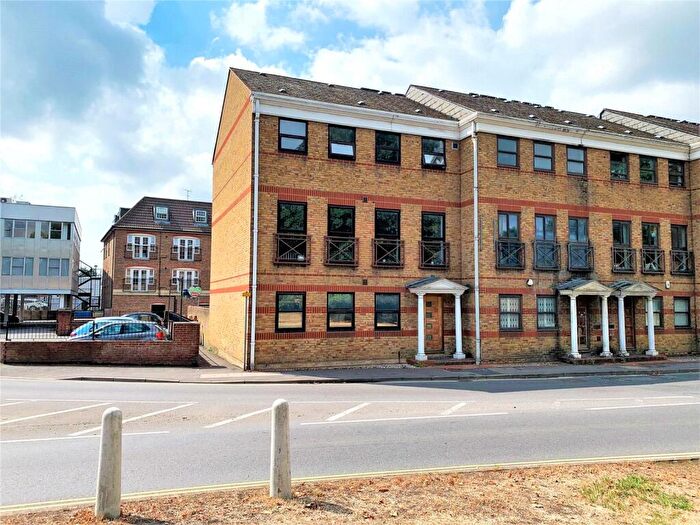
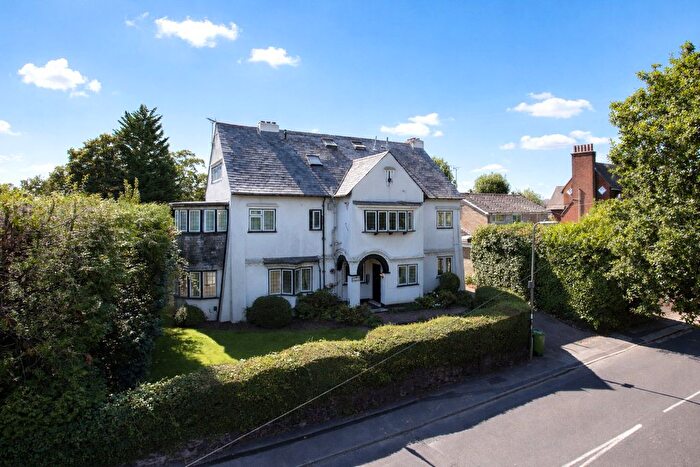
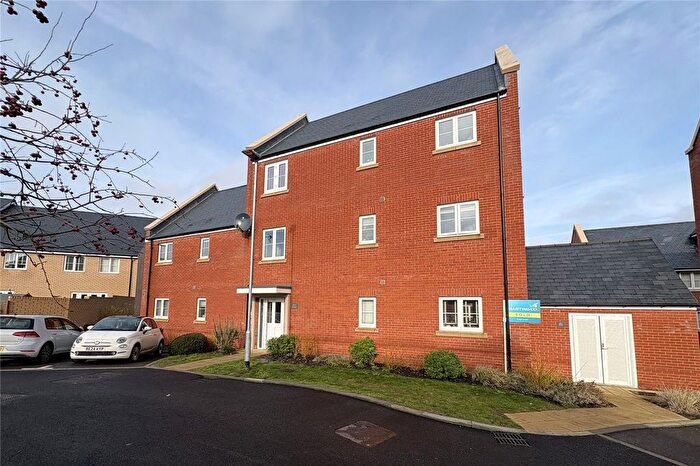
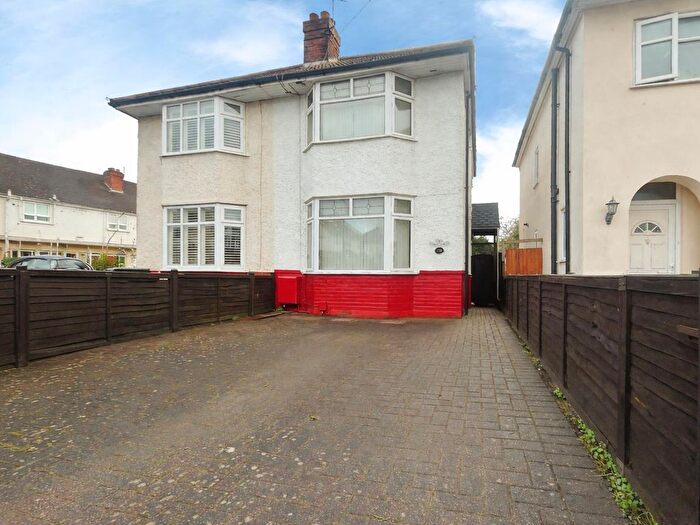
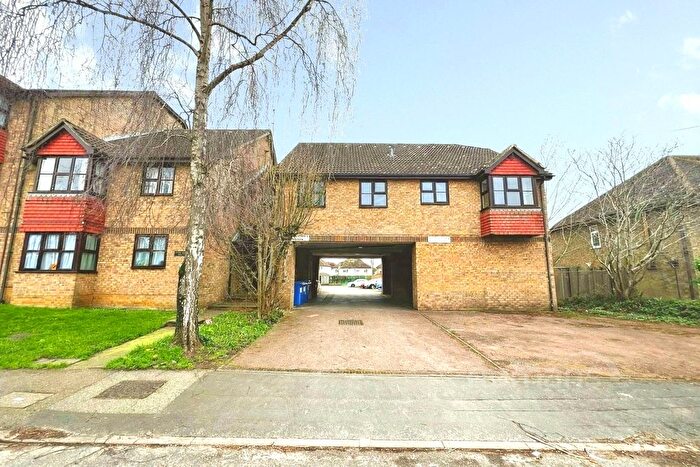
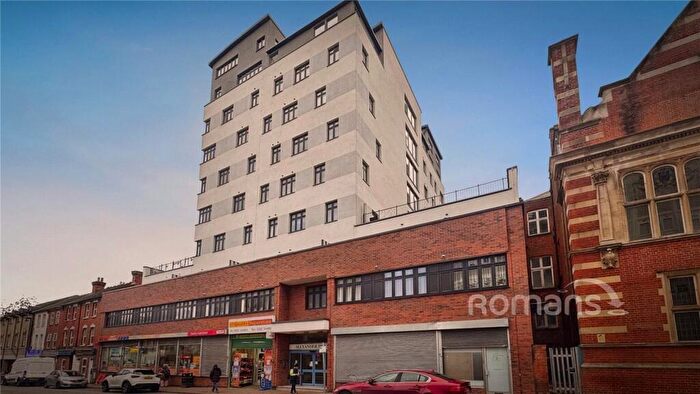
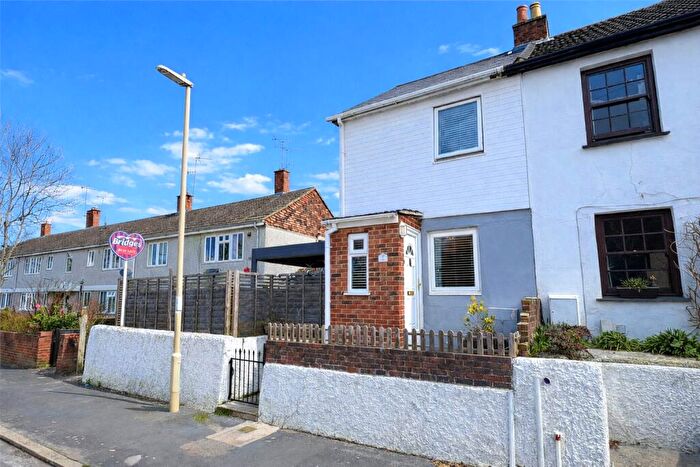
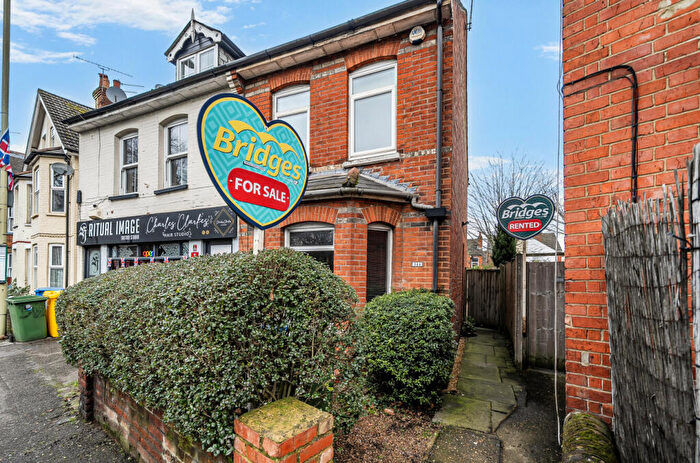
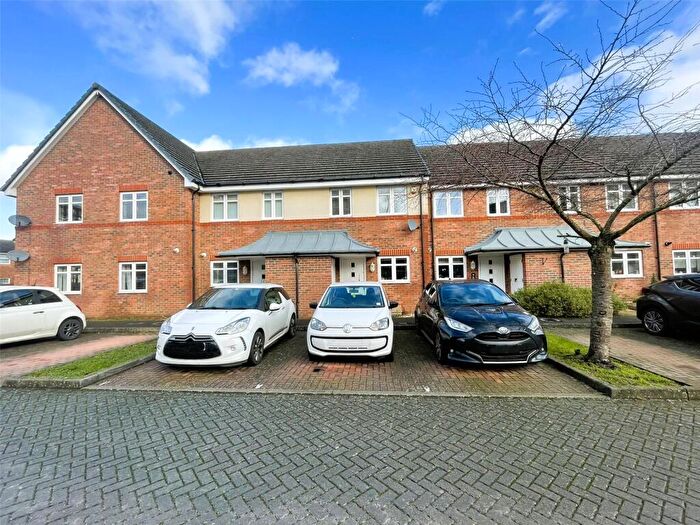
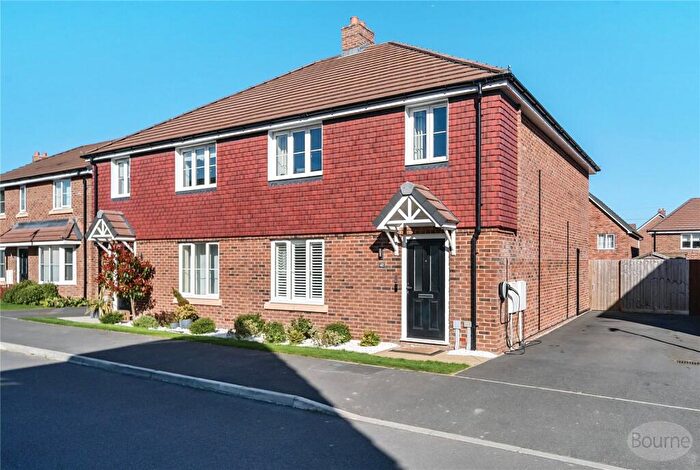
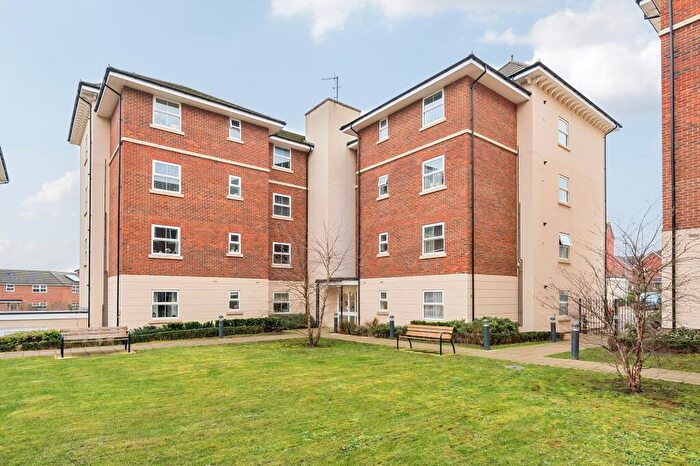
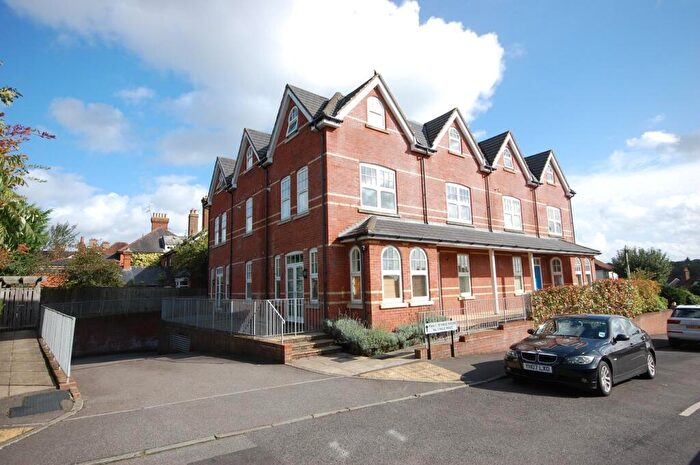
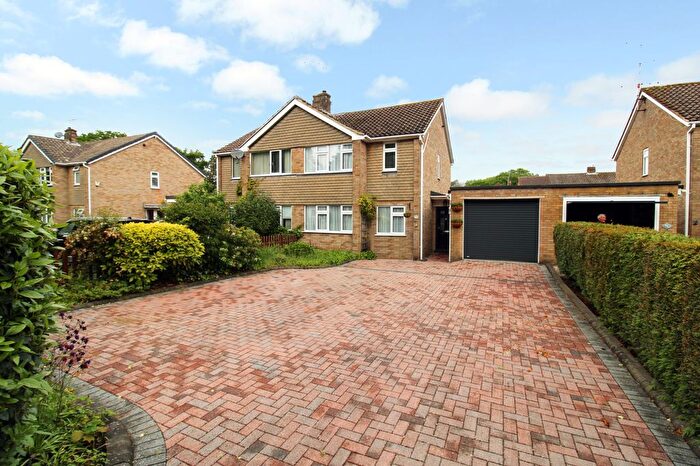
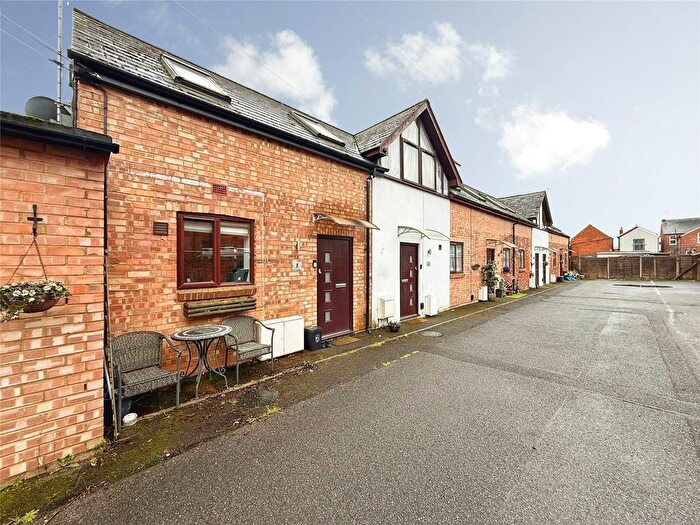
Houses for sale & to rent in Aldershot, Hampshire
House Prices in Aldershot
Properties in Aldershot have an average house price of £315,548.00 and had 1,371 Property Transactions within the last 3 years.¹
Aldershot is an area in Hampshire with 14,291 households², where the most expensive property was sold for £870,000.00.
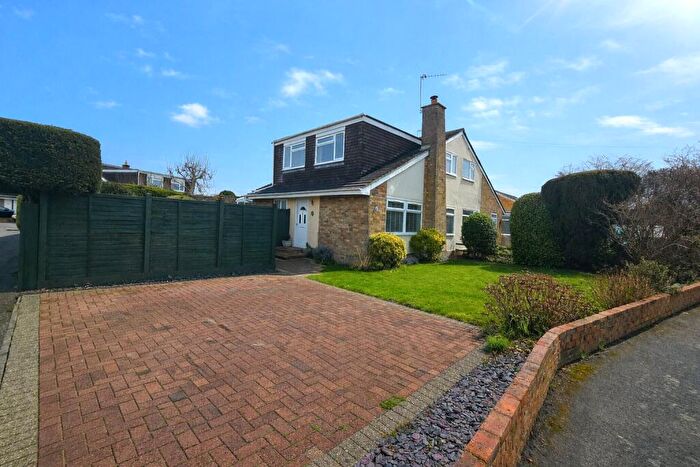
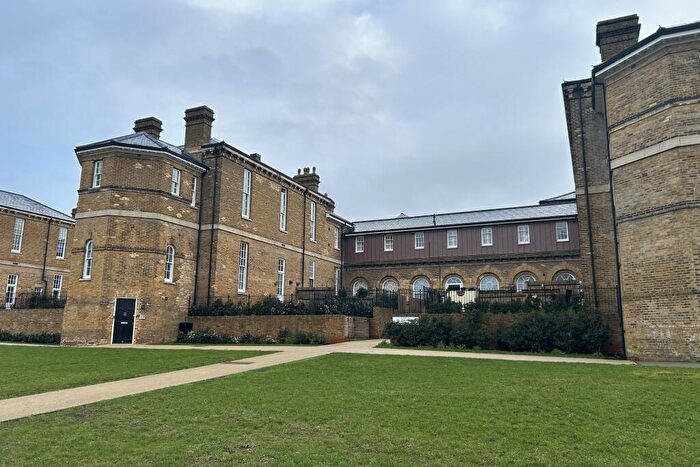
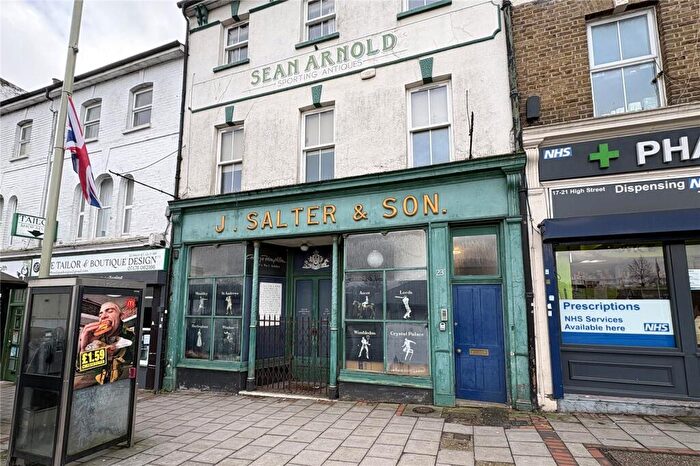
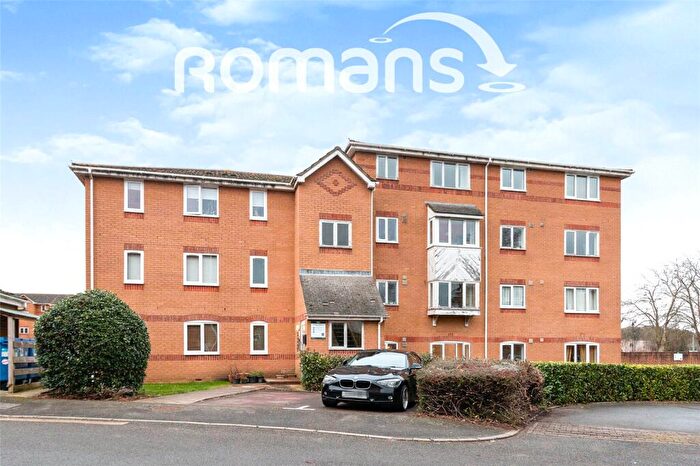
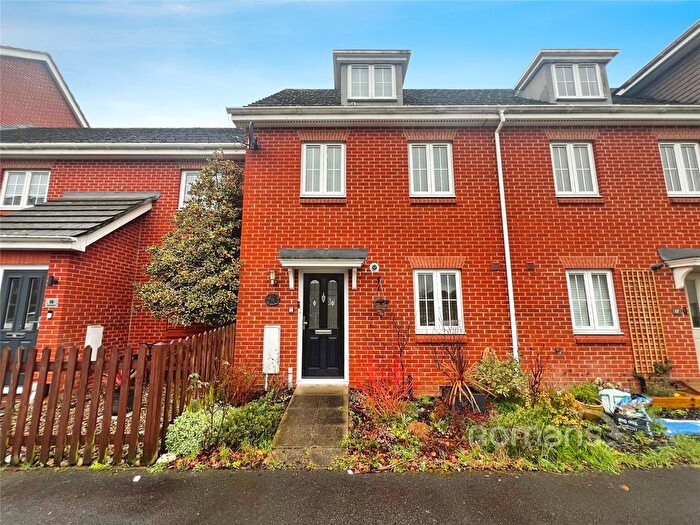
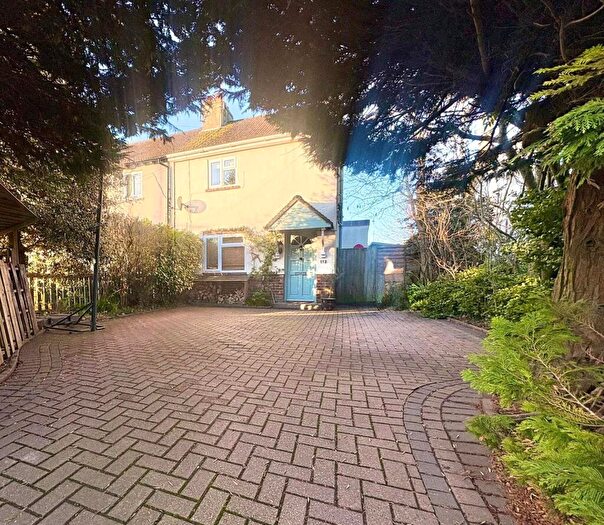
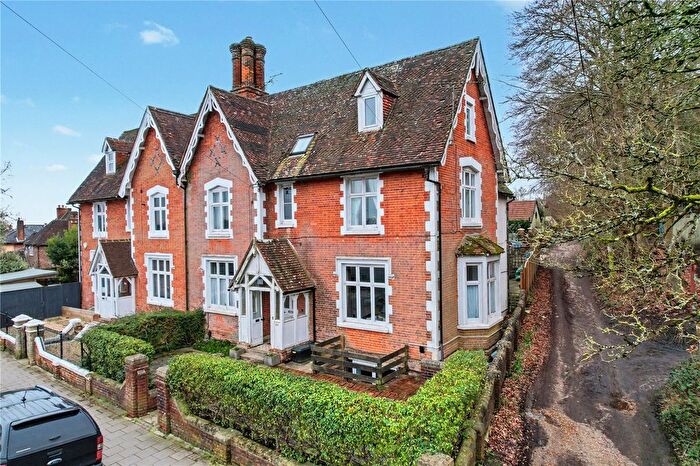
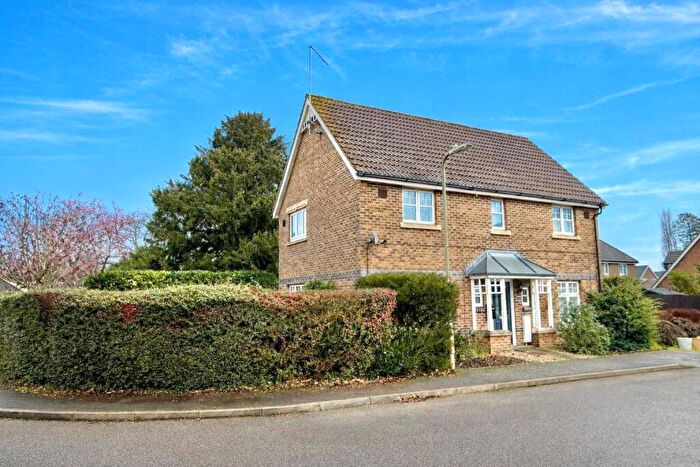
Properties for sale in Aldershot
Neighbourhoods in Aldershot
Navigate through our locations to find the location of your next house in Aldershot, Hampshire for sale or to rent.
Transport in Aldershot
Please see below transportation links in this area:
- FAQ
- Price Paid By Year
- Property Type Price
Frequently asked questions about Aldershot
What is the average price for a property for sale in Aldershot?
The average price for a property for sale in Aldershot is £315,548. This amount is 25% lower than the average price in Hampshire. There are 6,762 property listings for sale in Aldershot.
What locations have the most expensive properties for sale in Aldershot?
The locations with the most expensive properties for sale in Aldershot are Rowhill at an average of £352,463, Aldershot Park at an average of £326,329 and North Town at an average of £321,289.
What locations have the most affordable properties for sale in Aldershot?
The locations with the most affordable properties for sale in Aldershot are Wellington at an average of £254,333 and Manor Park at an average of £311,490.
Which train stations are available in or near Aldershot?
Some of the train stations available in or near Aldershot are Aldershot, Ash and North Camp.
Property Price Paid in Aldershot by Year
The average sold property price by year was:
| Year | Average Sold Price | Price Change |
Sold Properties
|
|---|---|---|---|
| 2025 | £338,887 | 11% |
398 Properties |
| 2024 | £301,102 | -3% |
489 Properties |
| 2023 | £310,950 | -6% |
484 Properties |
| 2022 | £328,591 | 6% |
574 Properties |
| 2021 | £308,482 | 0,4% |
697 Properties |
| 2020 | £307,263 | 3% |
549 Properties |
| 2019 | £298,289 | 4% |
674 Properties |
| 2018 | £286,524 | 2% |
616 Properties |
| 2017 | £282,023 | 7% |
713 Properties |
| 2016 | £260,921 | 10% |
749 Properties |
| 2015 | £234,580 | 10% |
722 Properties |
| 2014 | £210,188 | 5% |
670 Properties |
| 2013 | £199,834 | -0,1% |
565 Properties |
| 2012 | £200,035 | 4% |
452 Properties |
| 2011 | £193,028 | -4% |
403 Properties |
| 2010 | £201,158 | 11% |
378 Properties |
| 2009 | £179,679 | -6% |
402 Properties |
| 2008 | £190,260 | -3% |
543 Properties |
| 2007 | £195,255 | 7% |
1,062 Properties |
| 2006 | £182,434 | 3% |
1,247 Properties |
| 2005 | £177,730 | 6% |
823 Properties |
| 2004 | £166,265 | 7% |
934 Properties |
| 2003 | £154,007 | 7% |
780 Properties |
| 2002 | £142,489 | 16% |
975 Properties |
| 2001 | £119,898 | 13% |
836 Properties |
| 2000 | £103,798 | 12% |
713 Properties |
| 1999 | £91,721 | 20% |
972 Properties |
| 1998 | £73,681 | 6% |
923 Properties |
| 1997 | £69,038 | 10% |
822 Properties |
| 1996 | £62,089 | -4% |
599 Properties |
| 1995 | £64,310 | - |
555 Properties |
Property Price per Property Type in Aldershot
Here you can find historic sold price data in order to help with your property search.
The average Property Paid Price for specific property types in the last three years are:
| Property Type | Average Sold Price | Sold Properties |
|---|---|---|
| Semi Detached House | £382,342.00 | 374 Semi Detached Houses |
| Detached House | £515,292.00 | 145 Detached Houses |
| Terraced House | £329,573.00 | 387 Terraced Houses |
| Flat | £187,867.00 | 465 Flats |

