
Houses for sale & to rent in Burghclere, Highclere And St Mary Bourne, Andover
House Prices in Burghclere, Highclere And St Mary Bourne
Properties in Burghclere, Highclere And St Mary Bourne have an average house price of £682,370.00 and had 61 Property Transactions within the last 3 years¹.
Burghclere, Highclere And St Mary Bourne is an area in Andover, Hampshire with 446 households², where the most expensive property was sold for £3,950,000.00.
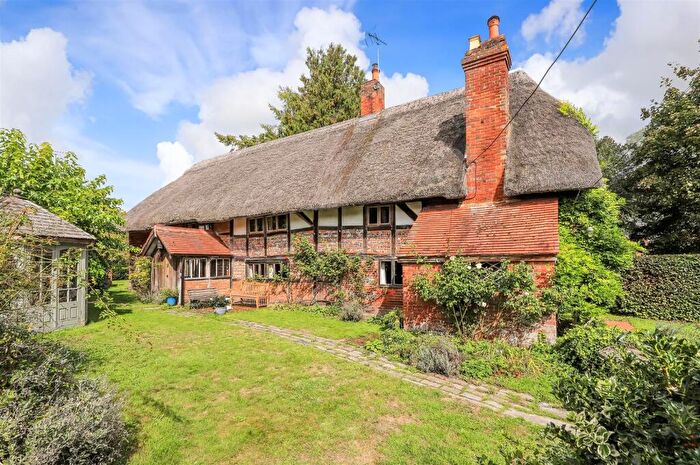
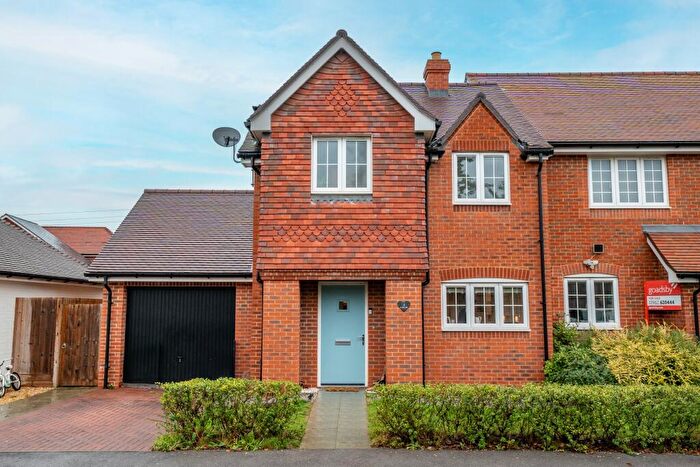
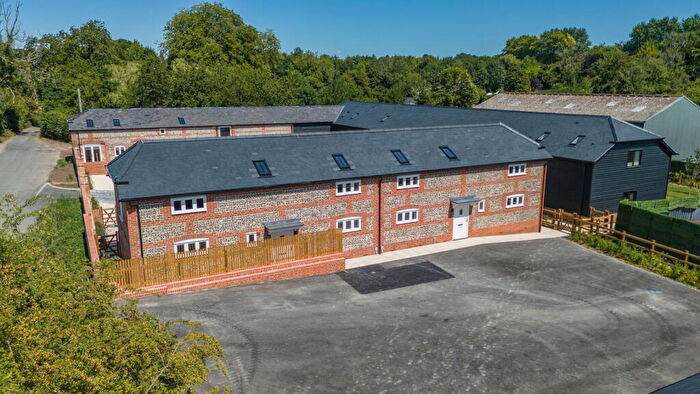
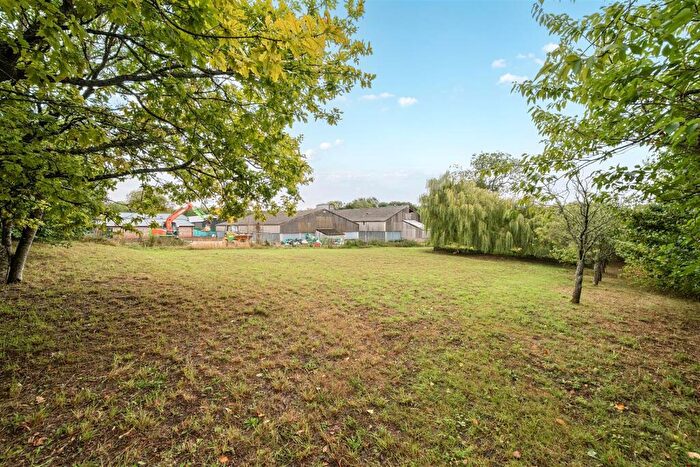
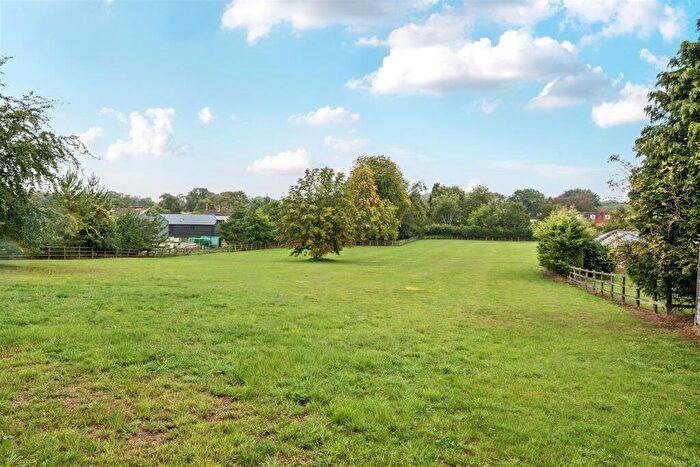
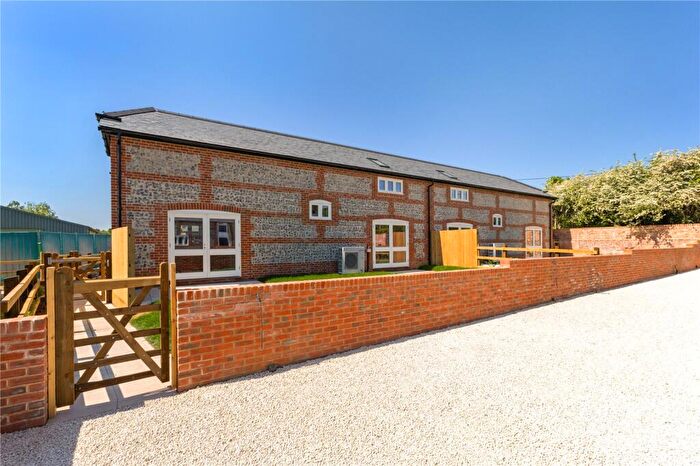
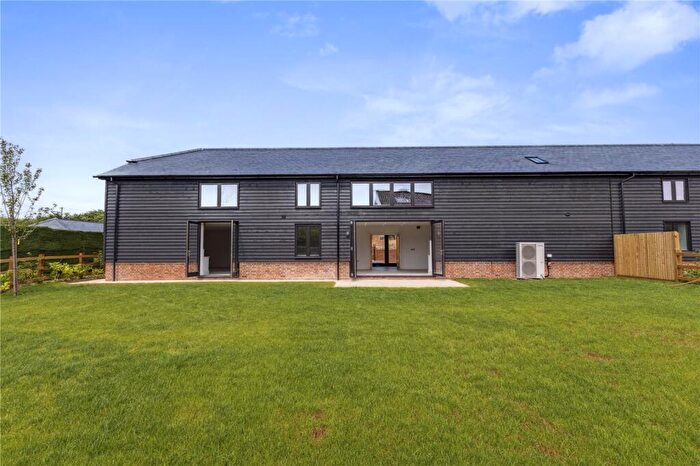
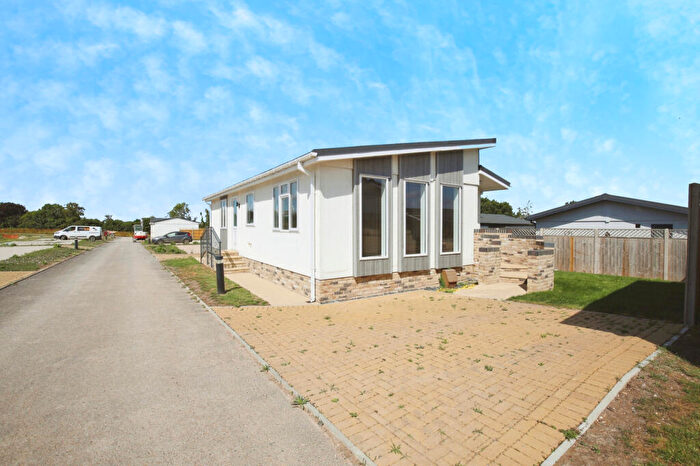
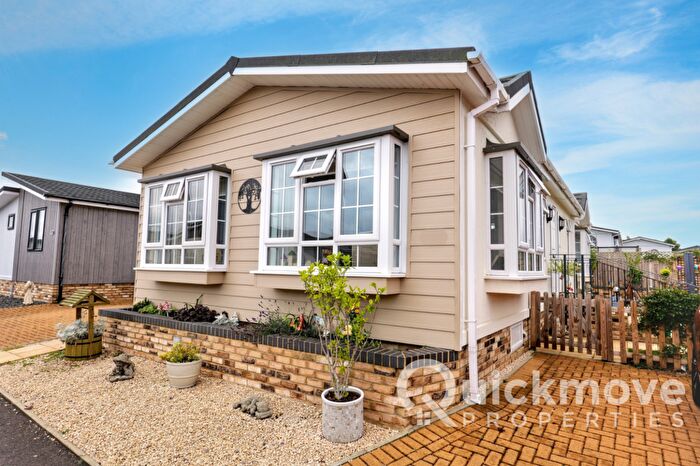
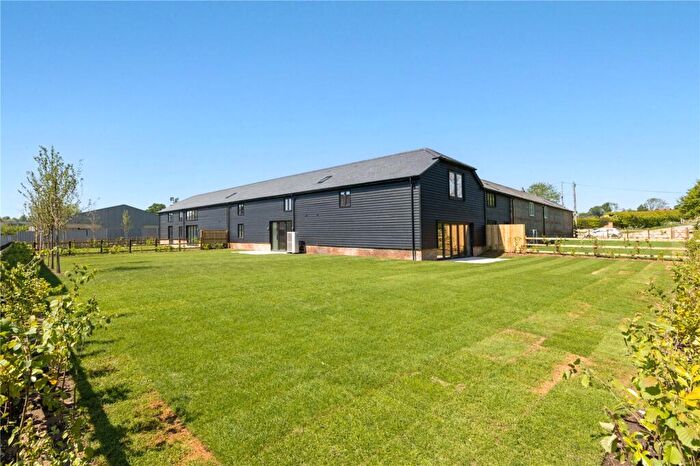
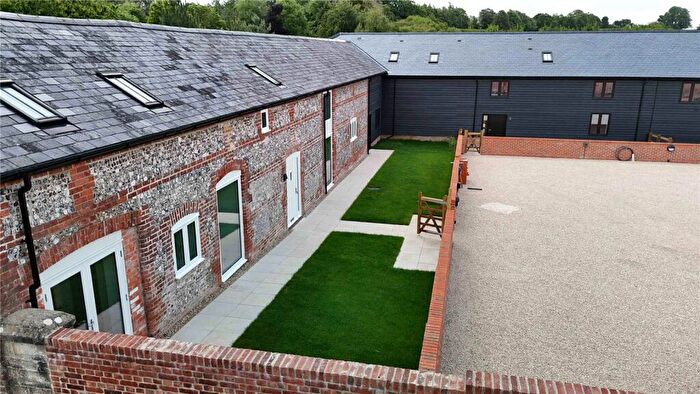
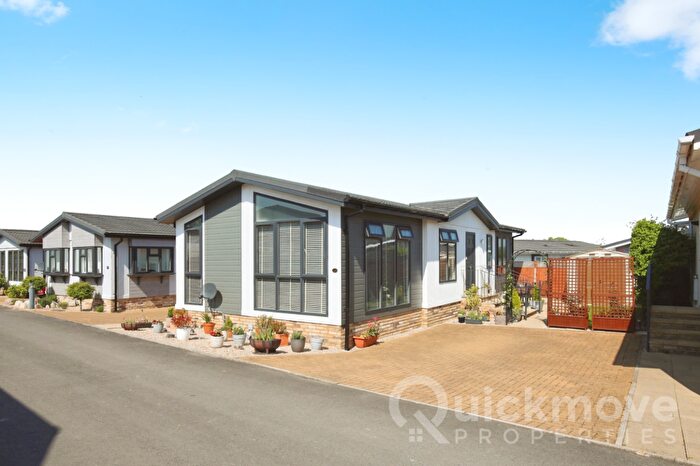
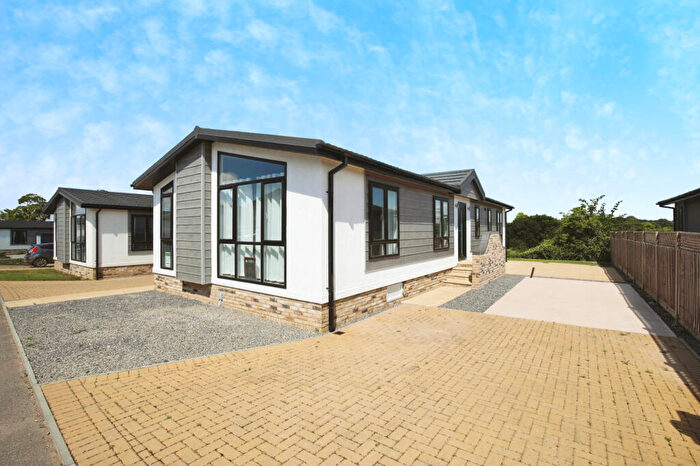
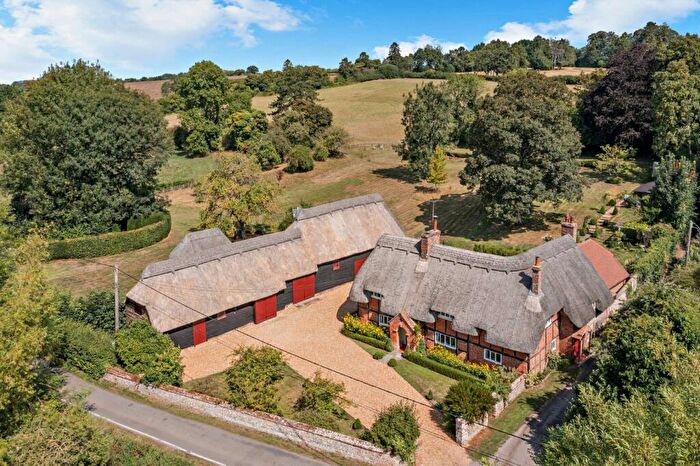
Properties for sale in Burghclere, Highclere And St Mary Bourne
![]()
If you are looking to sell your house, let it out, or receive a property valuation, an expert can help you.
Click the button below to get started.
Previously listed properties in Burghclere, Highclere And St Mary Bourne
Roads and Postcodes in Burghclere, Highclere And St Mary Bourne
Navigate through our locations to find the location of your next house in Burghclere, Highclere And St Mary Bourne, Andover for sale or to rent.
| Streets | Postcodes |
|---|---|
| St. Mary Bourne | SP11 6DL SP11 6DP SP11 6DW |
| Abbey Terrace | SP11 0NE |
| Applegate | SP11 6DT |
| Baptist Hill | SP11 6BQ |
| Batsford | SP11 6AX |
| Belle Vue Cottages | SP11 6BJ |
| Blacksmiths | SP11 6RE |
| Breach Farm Cottages | SP11 6DH |
| Chapel Lane | SP11 0NF |
| Church Street | SP11 6BL SP11 6BN |
| Crab Tree Lane | SP11 0LX |
| Denham Terrace | SP11 6AT |
| Derry Down | SP11 6BS |
| Egbury Road | SP11 6DG |
| Gangbridge Lane | SP11 6EP |
| Hilliers Farm Cottages | SP11 6EE |
| Hirst Copse | SP11 6ST |
| Homefield | SP11 6AS |
| Homemead | SP11 0NN |
| Hurstbourne Lane | SP11 0NJ |
| Lilley Down Villas | SP11 6DD |
| Lower Link | SP11 6BU SP11 6BY |
| Old School Cottages | SP11 6EL |
| Pound Cottages | SP11 6EQ |
| Queens Cottages | SP11 6EG |
| School Lane | SP11 6AU |
| Slade Bottom Cottages | SP11 0NX |
| South View Terrace | SP11 6BZ |
| Spring Lease | SP11 0LY |
| Stevens Green | SP11 6DF |
| Stoke Gate | SP11 0NH |
| Stud Farm | SP11 6DU |
| Test Cottages | SP11 6BX |
| The Rank | SP11 6EH |
| Upper Link | SP11 6BT |
| Upper Wyke | SP11 6EA |
| Windmill Cottages | SP11 0NS |
| York Cottages | SP11 6BW |
| SP11 0EU SP11 0LS SP11 0LT SP11 0LU SP11 0LZ SP11 0NA SP11 0ND SP11 0NP SP11 0NU SP11 0NY SP11 0PG SP11 6AJ SP11 6AR SP11 6AY SP11 6BG SP11 6BP SP11 6DJ SP11 6DS SP11 6EF SP11 6EN SP11 6ET SP11 6EU SP11 6EY SP11 6HA SP11 6JG |
Transport near Burghclere, Highclere And St Mary Bourne

- FAQ
- Price Paid By Year
- Property Type Price
Frequently asked questions about Burghclere, Highclere And St Mary Bourne
What is the average price for a property for sale in Burghclere, Highclere And St Mary Bourne?
The average price for a property for sale in Burghclere, Highclere And St Mary Bourne is £682,370. This amount is 85% higher than the average price in Andover. There are 238 property listings for sale in Burghclere, Highclere And St Mary Bourne.
What streets have the most expensive properties for sale in Burghclere, Highclere And St Mary Bourne?
The streets with the most expensive properties for sale in Burghclere, Highclere And St Mary Bourne are Gangbridge Lane at an average of £850,000, Church Street at an average of £815,000 and Egbury Road at an average of £447,500.
What streets have the most affordable properties for sale in Burghclere, Highclere And St Mary Bourne?
The streets with the most affordable properties for sale in Burghclere, Highclere And St Mary Bourne are Queens Cottages at an average of £140,500, Stoke Gate at an average of £258,000 and Belle Vue Cottages at an average of £305,000.
Which train stations are available in or near Burghclere, Highclere And St Mary Bourne?
Some of the train stations available in or near Burghclere, Highclere And St Mary Bourne are Whitchurch (Hampshire), Andover and Overton.
Property Price Paid in Burghclere, Highclere And St Mary Bourne by Year
The average sold property price by year was:
| Year | Average Sold Price | Price Change |
Sold Properties
|
|---|---|---|---|
| 2025 | £539,363 | 10% |
11 Properties |
| 2024 | £485,562 | -72% |
16 Properties |
| 2023 | £834,695 | 2% |
9 Properties |
| 2022 | £816,413 | 26% |
25 Properties |
| 2021 | £607,847 | -4% |
20 Properties |
| 2020 | £634,973 | 37% |
18 Properties |
| 2019 | £398,454 | -22% |
11 Properties |
| 2018 | £487,688 | -6% |
13 Properties |
| 2017 | £517,291 | 24% |
12 Properties |
| 2016 | £393,111 | -9% |
9 Properties |
| 2015 | £428,960 | 13% |
10 Properties |
| 2014 | £374,175 | -1% |
20 Properties |
| 2013 | £379,000 | 10% |
17 Properties |
| 2012 | £340,103 | -36% |
14 Properties |
| 2011 | £463,776 | -69% |
19 Properties |
| 2010 | £783,941 | 41% |
7 Properties |
| 2009 | £461,408 | -3% |
6 Properties |
| 2008 | £474,944 | 22% |
9 Properties |
| 2007 | £369,714 | -24% |
30 Properties |
| 2006 | £459,520 | 39% |
22 Properties |
| 2005 | £281,653 | -21% |
16 Properties |
| 2004 | £340,069 | -22% |
18 Properties |
| 2003 | £416,410 | 29% |
19 Properties |
| 2002 | £295,833 | 18% |
21 Properties |
| 2001 | £243,563 | 17% |
29 Properties |
| 2000 | £203,238 | 29% |
16 Properties |
| 1999 | £143,760 | -2% |
24 Properties |
| 1998 | £146,076 | -7% |
17 Properties |
| 1997 | £156,919 | 15% |
21 Properties |
| 1996 | £134,071 | 15% |
24 Properties |
| 1995 | £114,061 | - |
20 Properties |
Property Price per Property Type in Burghclere, Highclere And St Mary Bourne
Here you can find historic sold price data in order to help with your property search.
The average Property Paid Price for specific property types in the last three years are:
| Property Type | Average Sold Price | Sold Properties |
|---|---|---|
| Semi Detached House | £413,575.00 | 10 Semi Detached Houses |
| Detached House | £945,611.00 | 34 Detached Houses |
| Terraced House | £350,648.00 | 14 Terraced Houses |
| Flat | £143,000.00 | 3 Flats |