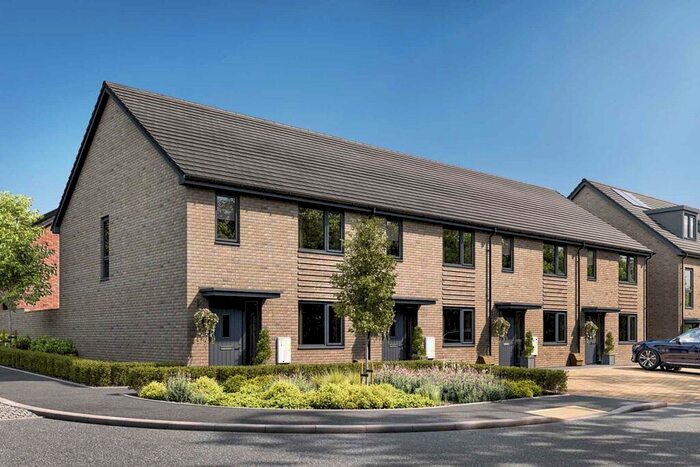
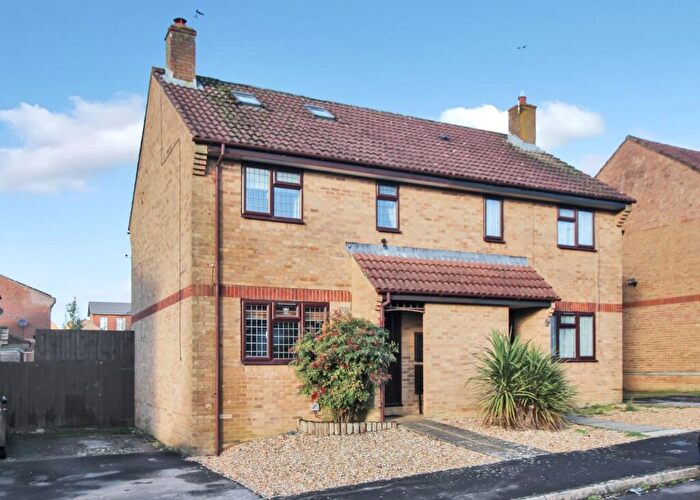
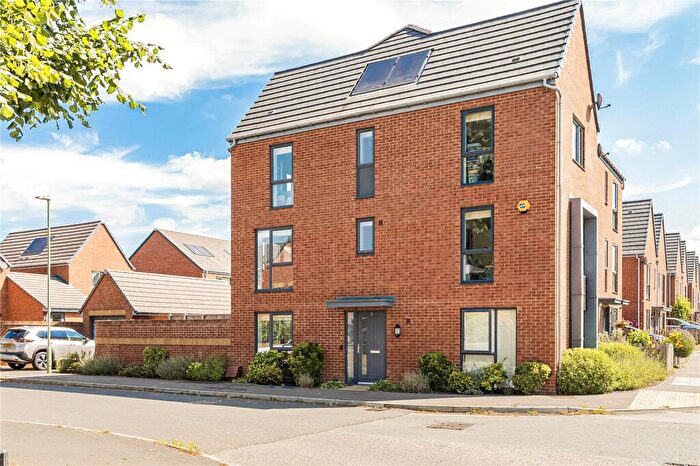
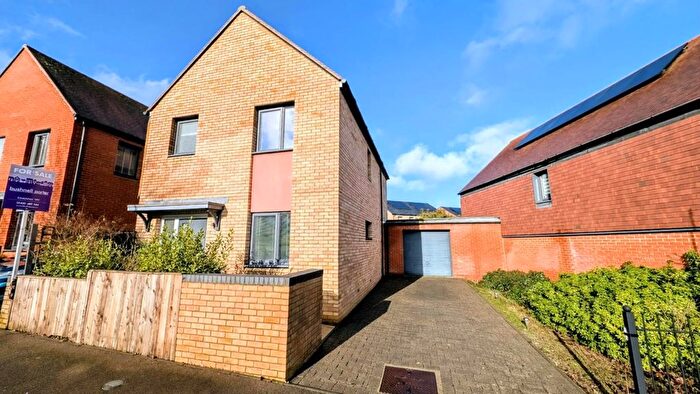
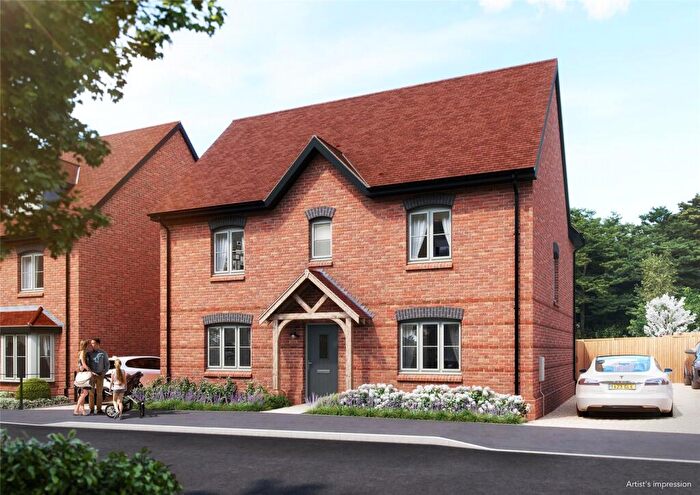
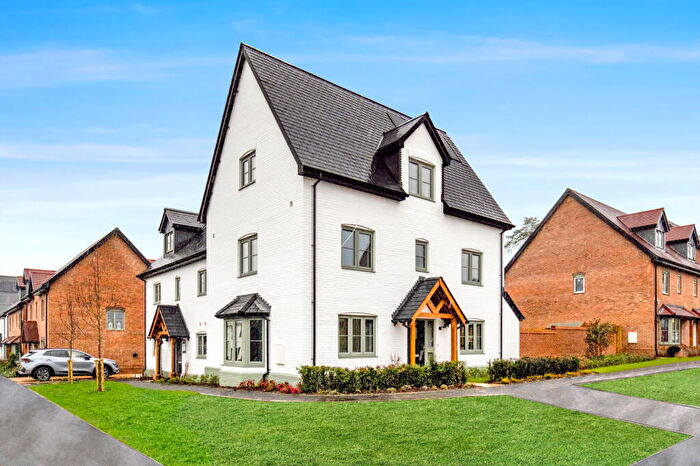
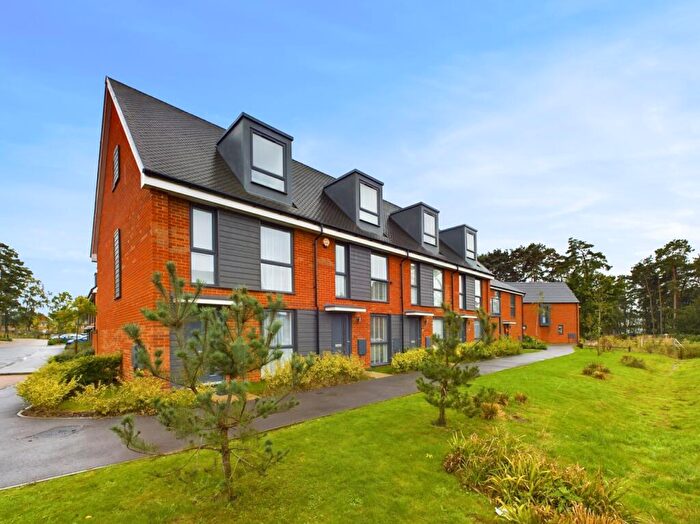
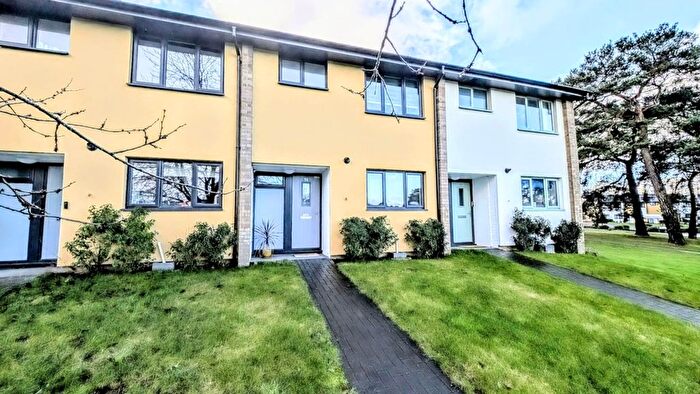
Houses for sale & to rent in Whitehill Pinewood, Bordon
House Prices in Whitehill Pinewood
Properties in Whitehill Pinewood have an average house price of £298,145.00 and had 211 Property Transactions within the last 3 years¹.
Whitehill Pinewood is an area in Bordon, Hampshire with 1,051 households², where the most expensive property was sold for £650,000.00.
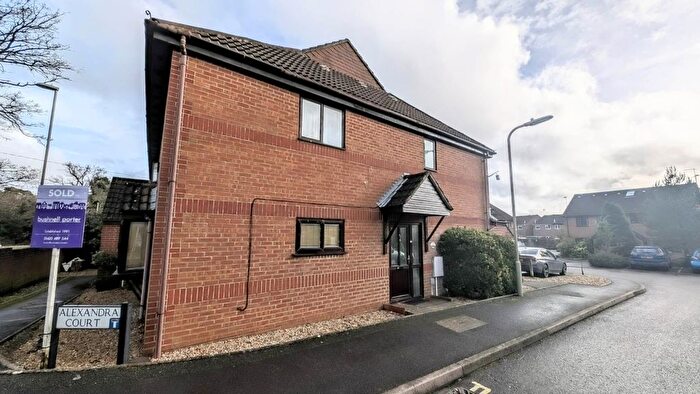
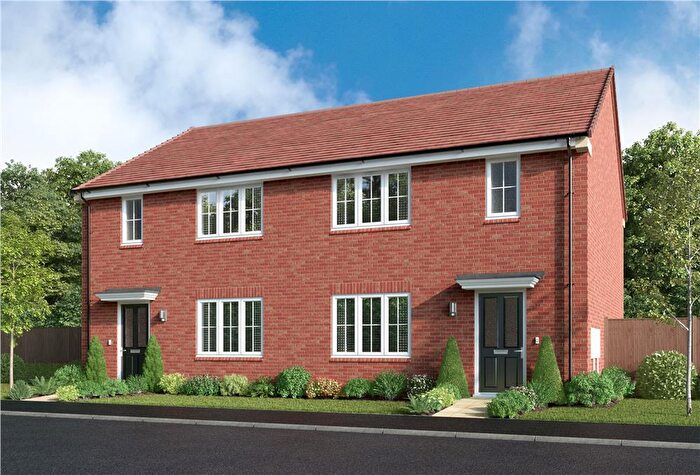
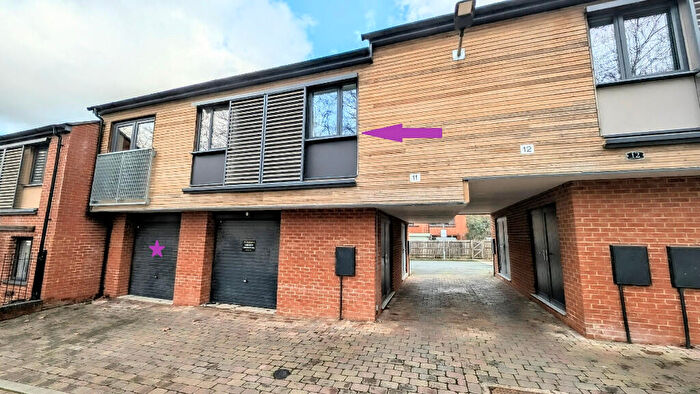
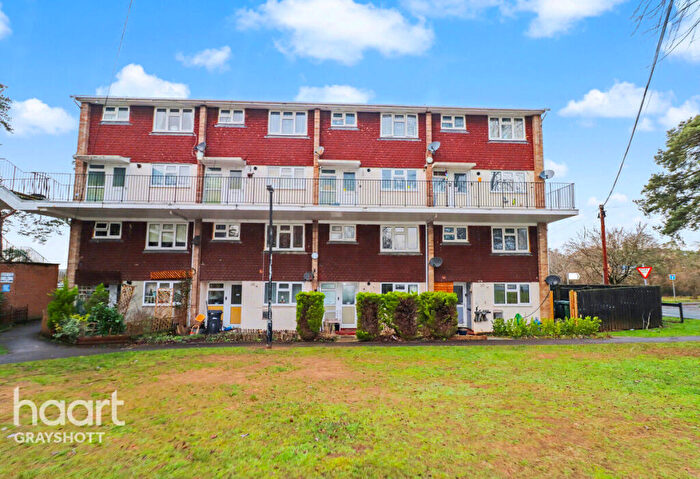
Properties for sale in Whitehill Pinewood
Roads and Postcodes in Whitehill Pinewood
Navigate through our locations to find the location of your next house in Whitehill Pinewood, Bordon for sale or to rent.
| Streets | Postcodes |
|---|---|
| Amherst Place | GU35 0GS |
| Artillery Drive | GU35 0GP |
| Ashmead | GU35 0TL |
| Badger Place | GU35 0GW |
| Barbados Road | GU35 0FX |
| Bassenthwaite Gardens | GU35 0JW |
| Beaufort Road | GU35 0JQ |
| Blenheim Close | GU35 0TD |
| Bolley Avenue | GU35 9HG GU35 9HQ |
| Brocas Way | GU35 0GG |
| Buttermere Close | GU35 0NJ |
| Camp Road | GU35 0LH |
| Canada Way | GU35 0JT |
| Chalet Court | GU35 0TG |
| Chalet Hill | GU35 0EF |
| Cobbett Square | GU35 0GD |
| Compton Place | GU35 0GZ |
| Coniston Road | GU35 0NP |
| Derwent Close | GU35 0NR |
| Empire Walk | GU35 0GA |
| Ennerdale Road | GU35 0LQ |
| Eric Tubb Road | GU35 0GR |
| Exhibition Mews | GU35 0GY |
| Falstaff Walk | GU35 0TE |
| Farnham Road | GU35 0NH GU35 0NF |
| George V Avenue | GU35 0FZ |
| Grasmere Close | GU35 0NS |
| Haweswater Close | GU35 0LP |
| Hudson Road | GU35 0GX |
| Kildare Close | GU35 0HN GU35 0HP GU35 0HW |
| Ladysmith Place | GU35 0NA |
| Lambourne Road | GU35 0JL |
| Lamerton Close | GU35 0HZ |
| Limber Grove | GU35 0GU |
| Lindford Road | GU35 0LL |
| Louisburg Avenue | GU35 0FW |
| Loweswater Gardens | GU35 0NT |
| Maple Leaf Drive | GU35 0JU |
| Maynard Way | GU35 0LN |
| Monarch Green | GU35 0SU |
| Nightjar Road | GU35 0GJ |
| North Parade | GU35 0SN |
| Oakhanger Road | GU35 9HF GU35 9HJ |
| Oakley Road | GU35 0JG |
| Oxney Way | GU35 0GQ |
| Park Street | GU35 0EB |
| Phoenix Road | GU35 0FY |
| Royal Drive | GU35 0PZ GU35 0QF |
| Russet Walk | GU35 0JD |
| Rydal Close | GU35 0LS |
| San Domingo Road | GU35 0GB |
| Savile Crescent | GU35 0ED GU35 0EE |
| Sidney Martin Road | GU35 0GF |
| Signal Hill Road | GU35 0GN |
| Skylark Street | GU35 0GT |
| St Lucia Park | GU35 0LB GU35 0LD GU35 0LE GU35 0LF |
| Stable Place | GU35 0GL |
| Station Road | GU35 0GE GU35 0LG GU35 0LR |
| Thirlmere Close | GU35 0NW |
| Ullswater Close | GU35 0JN |
| Ulrick Avenue | GU35 0GH |
| Windermere Road | GU35 0NN |
Transport near Whitehill Pinewood
- FAQ
- Price Paid By Year
- Property Type Price
Frequently asked questions about Whitehill Pinewood
What is the average price for a property for sale in Whitehill Pinewood?
The average price for a property for sale in Whitehill Pinewood is £298,145. This amount is 24% lower than the average price in Bordon. There are 1,111 property listings for sale in Whitehill Pinewood.
What streets have the most expensive properties for sale in Whitehill Pinewood?
The streets with the most expensive properties for sale in Whitehill Pinewood are Oxney Way at an average of £527,500, Canada Way at an average of £525,000 and Artillery Drive at an average of £515,000.
What streets have the most affordable properties for sale in Whitehill Pinewood?
The streets with the most affordable properties for sale in Whitehill Pinewood are Chalet Court at an average of £107,500, Kildare Close at an average of £170,547 and Compton Place at an average of £186,333.
Which train stations are available in or near Whitehill Pinewood?
Some of the train stations available in or near Whitehill Pinewood are Bentley, Liphook and Alton.
Property Price Paid in Whitehill Pinewood by Year
The average sold property price by year was:
| Year | Average Sold Price | Price Change |
Sold Properties
|
|---|---|---|---|
| 2025 | £320,801 | -1% |
49 Properties |
| 2024 | £323,376 | 14% |
47 Properties |
| 2023 | £278,180 | -11% |
115 Properties |
| 2022 | £309,863 | 2% |
84 Properties |
| 2021 | £304,603 | -2% |
171 Properties |
| 2020 | £311,825 | -6% |
152 Properties |
| 2019 | £331,536 | 5% |
139 Properties |
| 2018 | £314,330 | 4% |
116 Properties |
| 2017 | £300,899 | 26% |
131 Properties |
| 2016 | £221,866 | 7% |
46 Properties |
| 2015 | £205,793 | 2% |
66 Properties |
| 2014 | £200,943 | 12% |
38 Properties |
| 2013 | £176,690 | 15% |
41 Properties |
| 2012 | £149,397 | 2% |
20 Properties |
| 2011 | £147,139 | -13% |
29 Properties |
| 2010 | £165,684 | 5% |
23 Properties |
| 2009 | £157,453 | -11% |
25 Properties |
| 2008 | £174,670 | -13% |
37 Properties |
| 2007 | £197,042 | 30% |
91 Properties |
| 2006 | £138,152 | -4% |
86 Properties |
| 2005 | £143,701 | -9% |
57 Properties |
| 2004 | £156,731 | 6% |
47 Properties |
| 2003 | £147,167 | 11% |
50 Properties |
| 2002 | £131,406 | 10% |
55 Properties |
| 2001 | £117,633 | 17% |
48 Properties |
| 2000 | £97,222 | 18% |
44 Properties |
| 1999 | £79,500 | 6% |
52 Properties |
| 1998 | £74,846 | - |
47 Properties |
| 1997 | £74,862 | 5% |
43 Properties |
| 1996 | £70,839 | 13% |
66 Properties |
| 1995 | £61,614 | - |
47 Properties |
Property Price per Property Type in Whitehill Pinewood
Here you can find historic sold price data in order to help with your property search.
The average Property Paid Price for specific property types in the last three years are:
| Property Type | Average Sold Price | Sold Properties |
|---|---|---|
| Semi Detached House | £355,931.00 | 30 Semi Detached Houses |
| Detached House | £488,153.00 | 13 Detached Houses |
| Terraced House | £296,808.00 | 135 Terraced Houses |
| Flat | £176,231.00 | 33 Flats |

