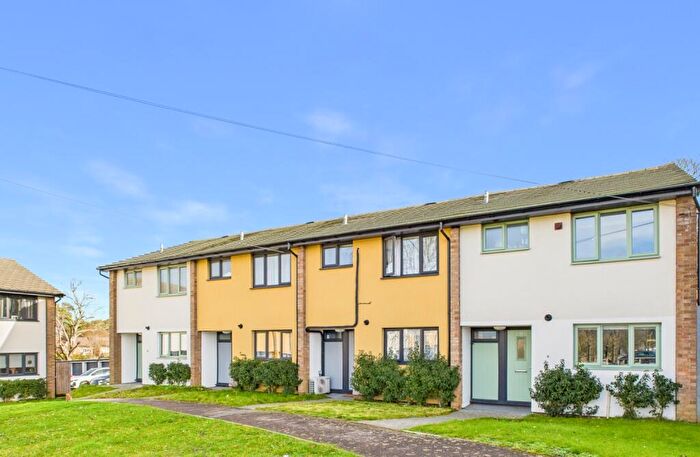
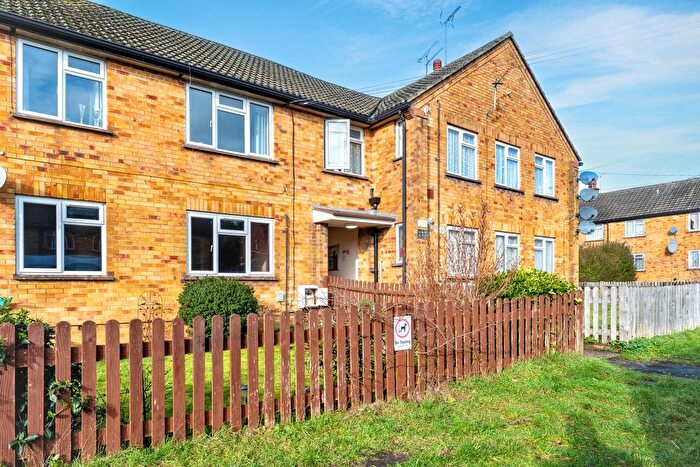
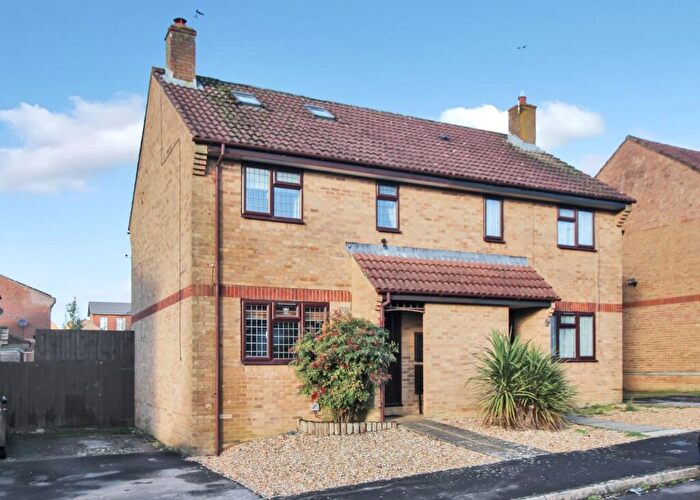
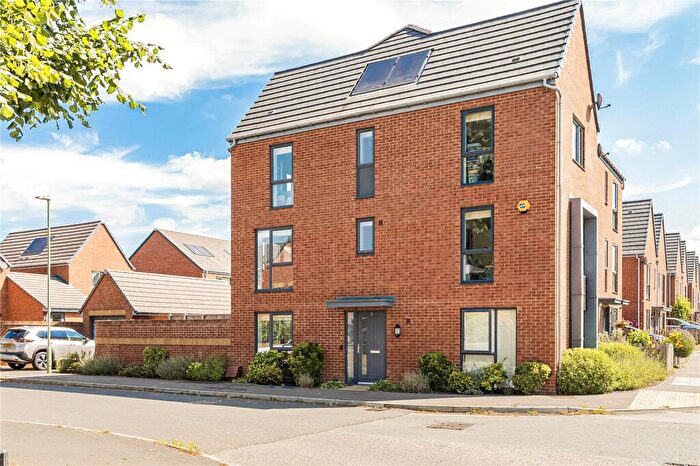
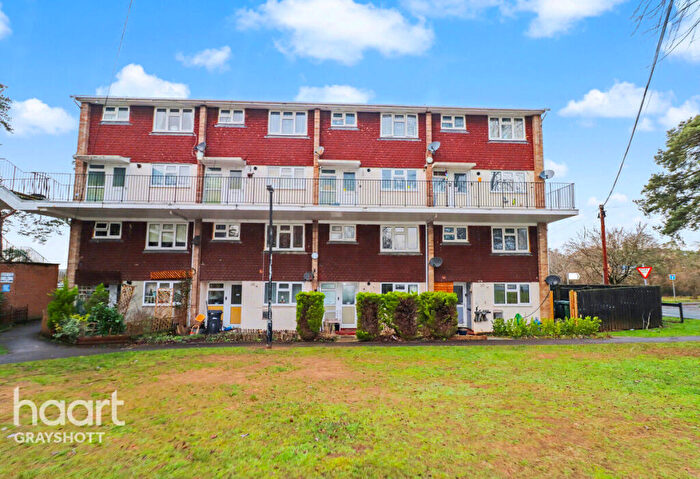
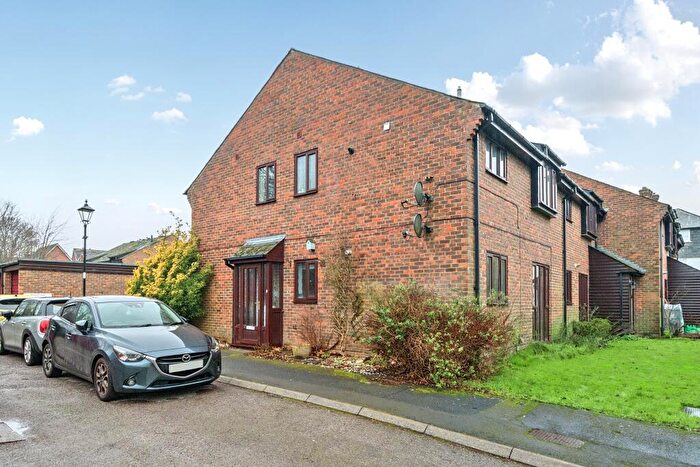
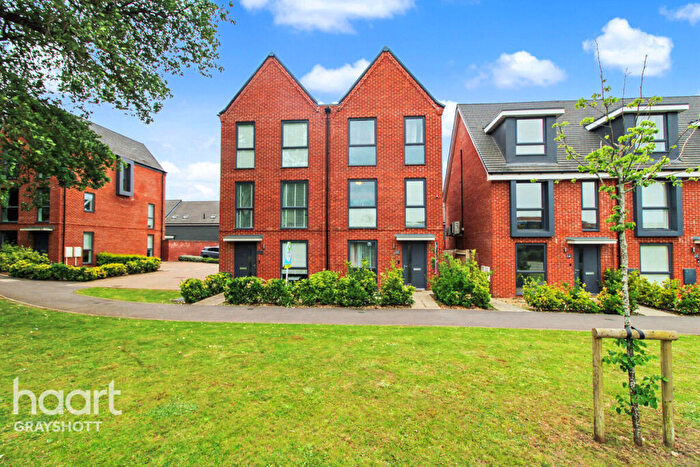
Houses for sale & to rent in Bordon, Hampshire
House Prices in Bordon
Properties in Bordon have an average house price of £392,606.00 and had 1,020 Property Transactions within the last 3 years.¹
Bordon is an area in Hampshire with 8,948 households², where the most expensive property was sold for £2,000,000.00.
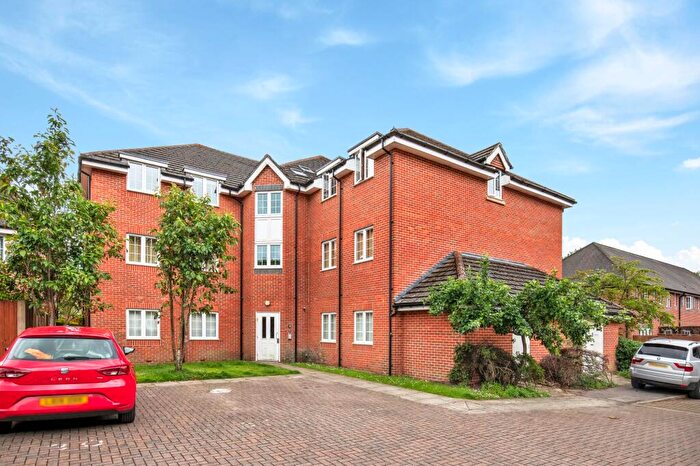
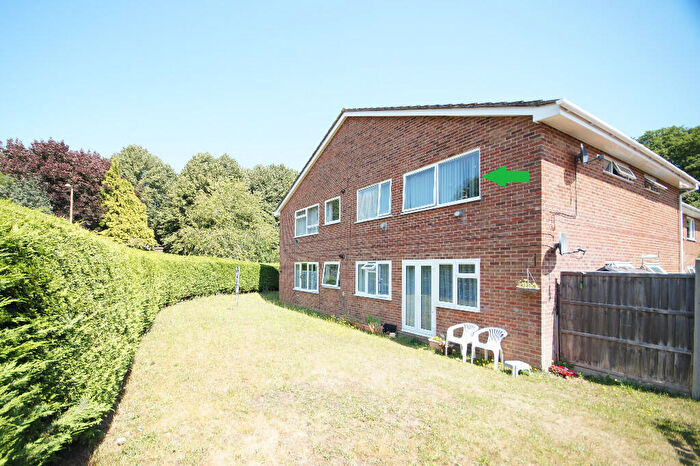
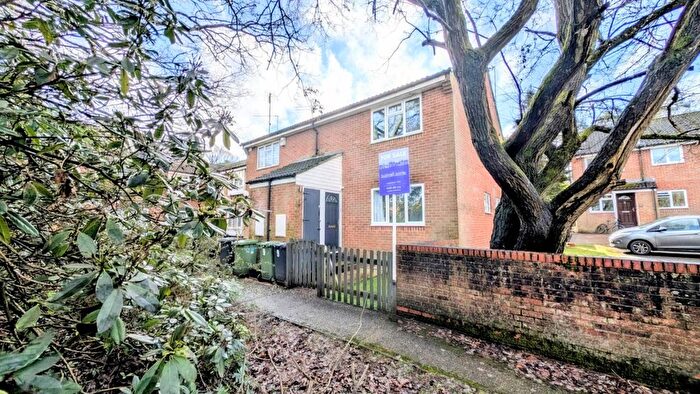
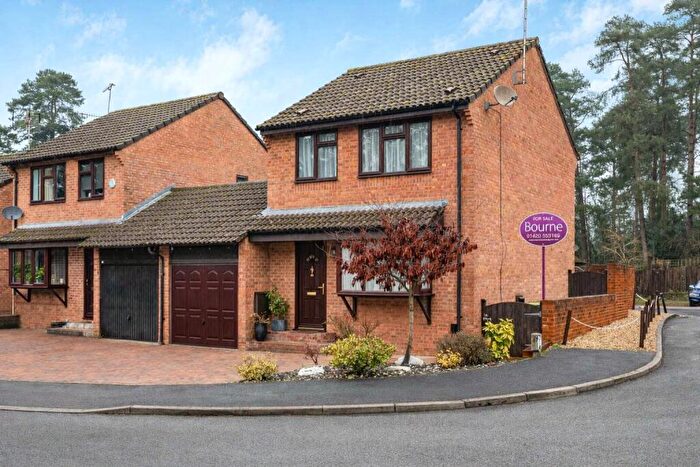
Properties for sale in Bordon
Neighbourhoods in Bordon
Navigate through our locations to find the location of your next house in Bordon, Hampshire for sale or to rent.
Transport in Bordon
Please see below transportation links in this area:
-
Liphook Station
-
Bentley Station
-
Liss Station
-
Alton Station
-
Haslemere Station
-
Farnham Station
-
Petersfield Station
-
Witley Station
-
Aldershot Station
-
Milford (Surrey) Station
- FAQ
- Price Paid By Year
- Property Type Price
Frequently asked questions about Bordon
What is the average price for a property for sale in Bordon?
The average price for a property for sale in Bordon is £392,606. This amount is 6% lower than the average price in Hampshire. There are 3,520 property listings for sale in Bordon.
What locations have the most expensive properties for sale in Bordon?
The locations with the most expensive properties for sale in Bordon are Binsted, Bentley & Selborne at an average of £1,135,000, Binsted And Bentley at an average of £736,833 and Selborne at an average of £624,501.
What locations have the most affordable properties for sale in Bordon?
The locations with the most affordable properties for sale in Bordon are Whitehill Chase at an average of £284,254, Whitehill Pinewood at an average of £298,145 and Whitehill Deadwater at an average of £323,269.
Which train stations are available in or near Bordon?
Some of the train stations available in or near Bordon are Liphook, Bentley and Liss.
Property Price Paid in Bordon by Year
The average sold property price by year was:
| Year | Average Sold Price | Price Change |
Sold Properties
|
|---|---|---|---|
| 2025 | £398,360 | -2% |
290 Properties |
| 2024 | £404,814 | 7% |
334 Properties |
| 2023 | £378,095 | -20% |
396 Properties |
| 2022 | £452,085 | 13% |
370 Properties |
| 2021 | £394,946 | 9% |
619 Properties |
| 2020 | £357,969 | -1% |
467 Properties |
| 2019 | £362,061 | 7% |
477 Properties |
| 2018 | £336,759 | -3% |
415 Properties |
| 2017 | £345,358 | 4% |
475 Properties |
| 2016 | £331,551 | 9% |
384 Properties |
| 2015 | £301,384 | 2% |
462 Properties |
| 2014 | £295,313 | 14% |
438 Properties |
| 2013 | £252,878 | -7% |
336 Properties |
| 2012 | £271,209 | 8% |
286 Properties |
| 2011 | £248,277 | -12% |
260 Properties |
| 2010 | £279,136 | 6% |
290 Properties |
| 2009 | £262,051 | 8% |
317 Properties |
| 2008 | £240,923 | -7% |
348 Properties |
| 2007 | £257,637 | 11% |
624 Properties |
| 2006 | £230,121 | 8% |
592 Properties |
| 2005 | £212,021 | -2% |
451 Properties |
| 2004 | £216,383 | 7% |
582 Properties |
| 2003 | £200,962 | 6% |
510 Properties |
| 2002 | £189,552 | 19% |
606 Properties |
| 2001 | £153,542 | 12% |
534 Properties |
| 2000 | £134,853 | 15% |
547 Properties |
| 1999 | £113,982 | 3% |
608 Properties |
| 1998 | £111,040 | 19% |
555 Properties |
| 1997 | £90,241 | 5% |
533 Properties |
| 1996 | £85,386 | 5% |
449 Properties |
| 1995 | £81,035 | - |
417 Properties |
Property Price per Property Type in Bordon
Here you can find historic sold price data in order to help with your property search.
The average Property Paid Price for specific property types in the last three years are:
| Property Type | Average Sold Price | Sold Properties |
|---|---|---|
| Semi Detached House | £380,657.00 | 208 Semi Detached Houses |
| Detached House | £622,806.00 | 285 Detached Houses |
| Terraced House | £295,906.00 | 407 Terraced Houses |
| Flat | £194,565.00 | 120 Flats |

