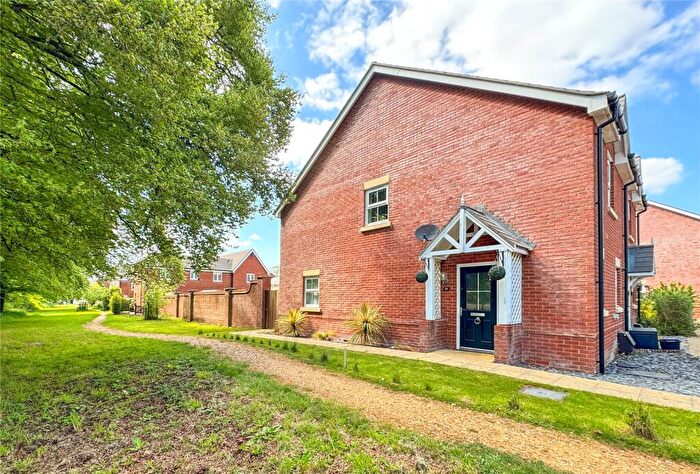
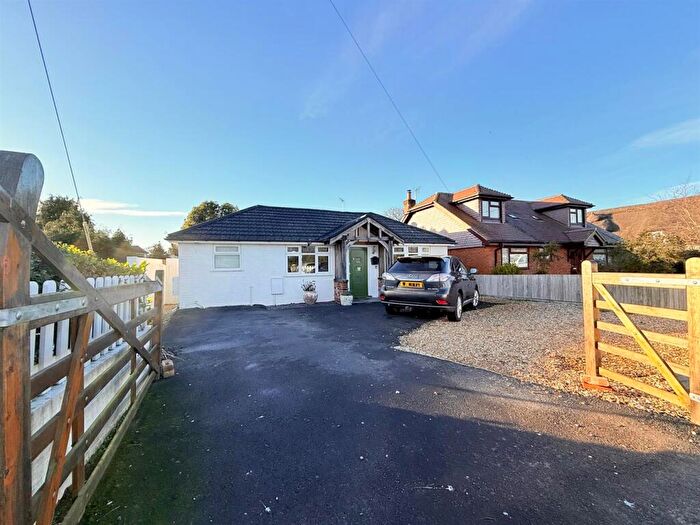
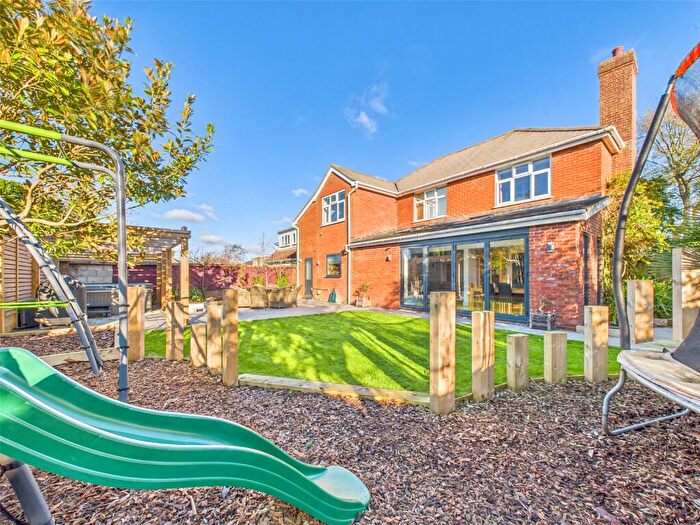
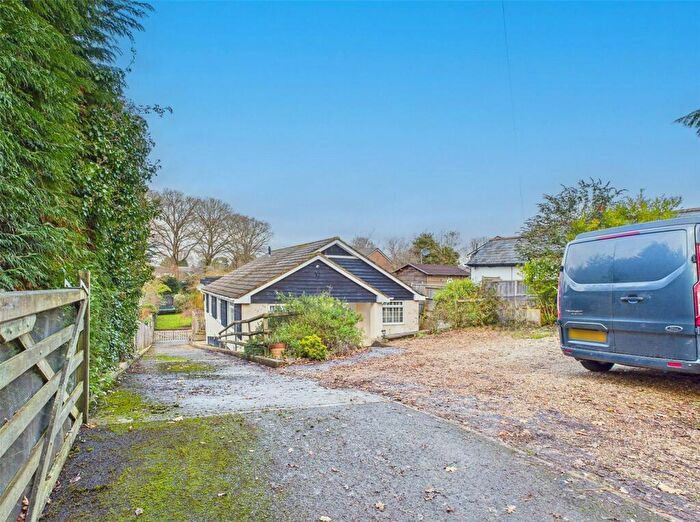
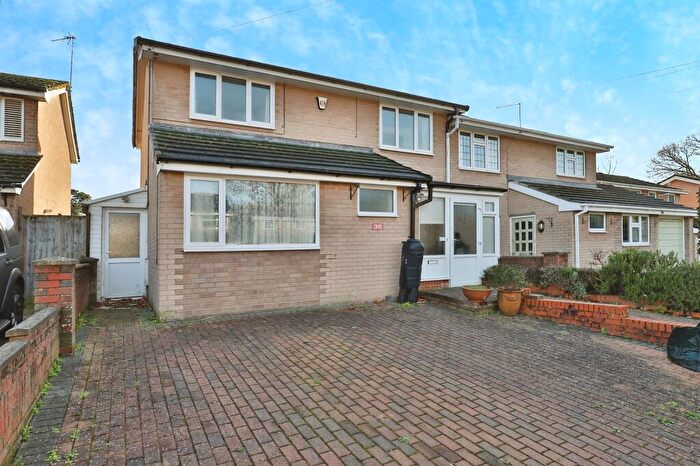
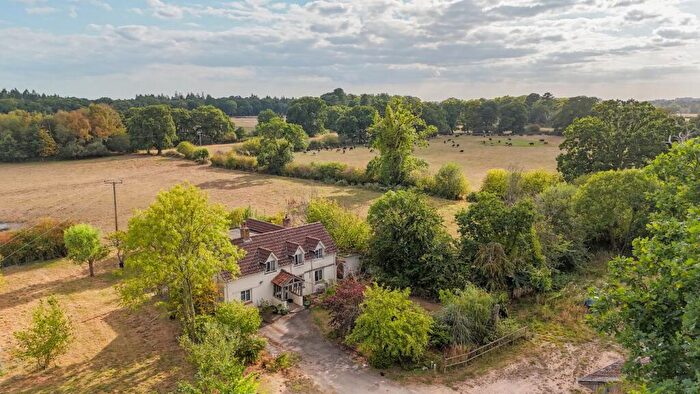
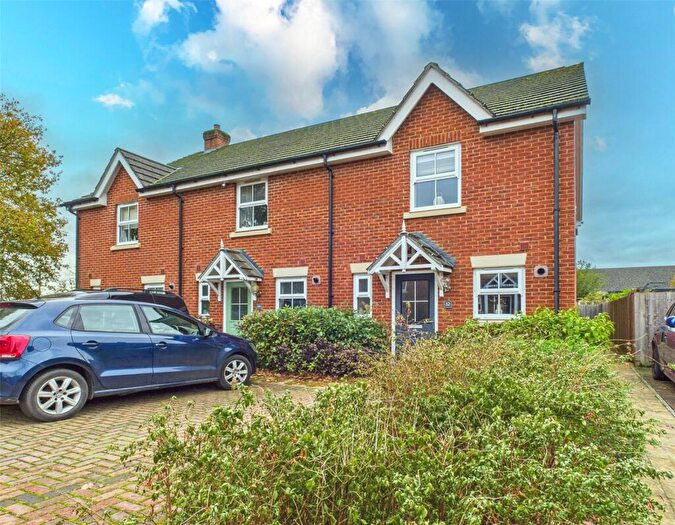
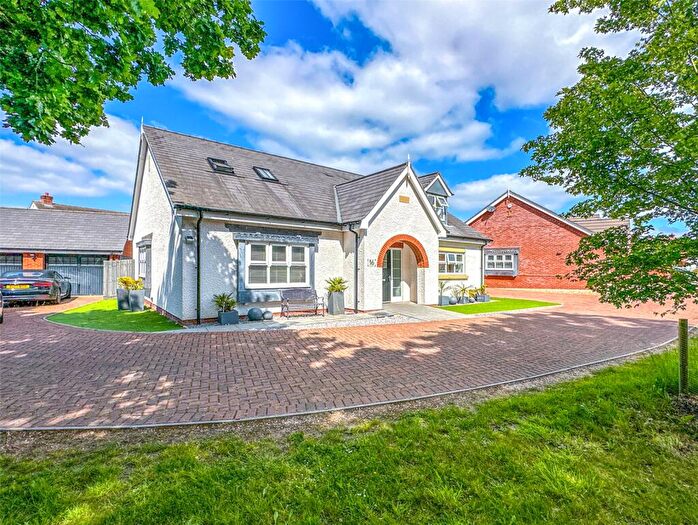
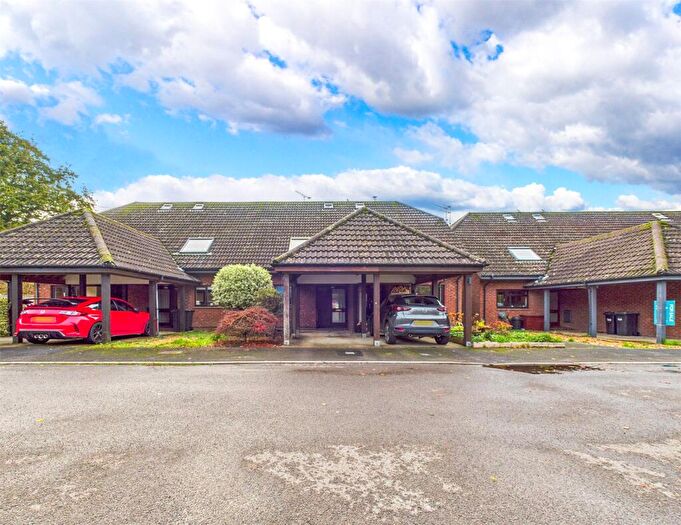
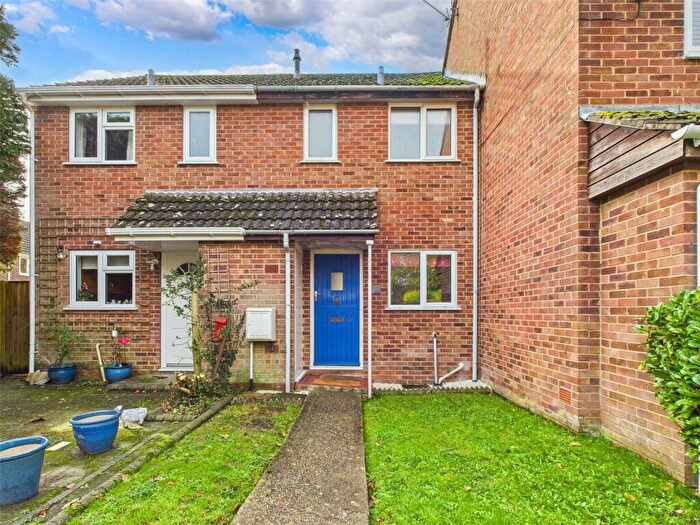
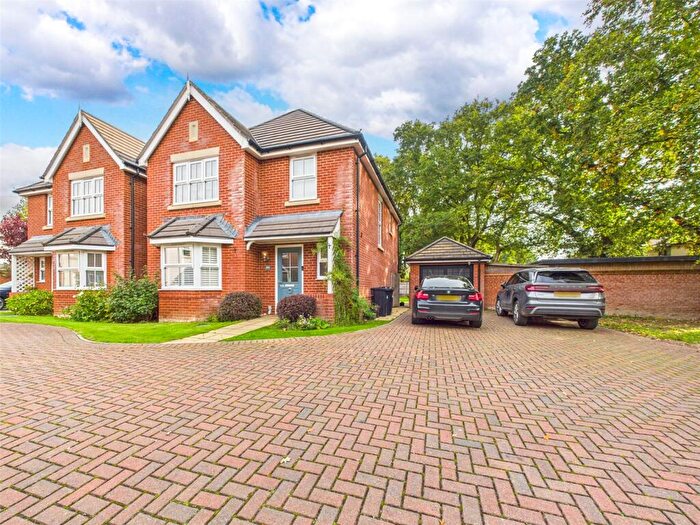
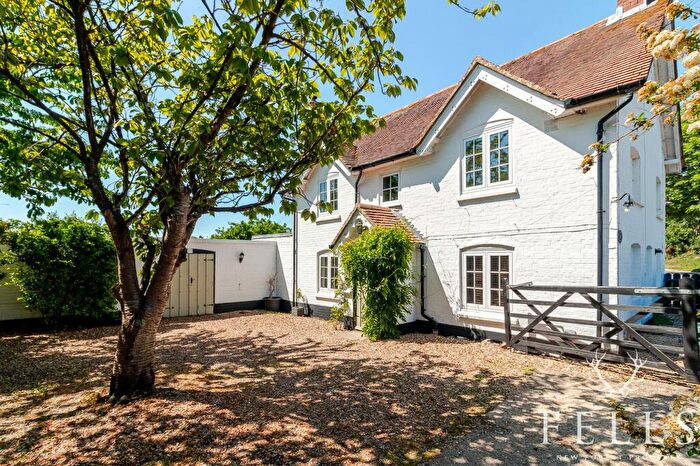
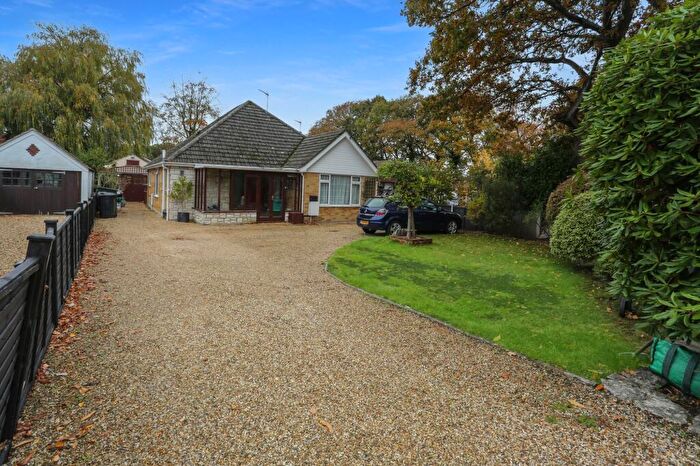
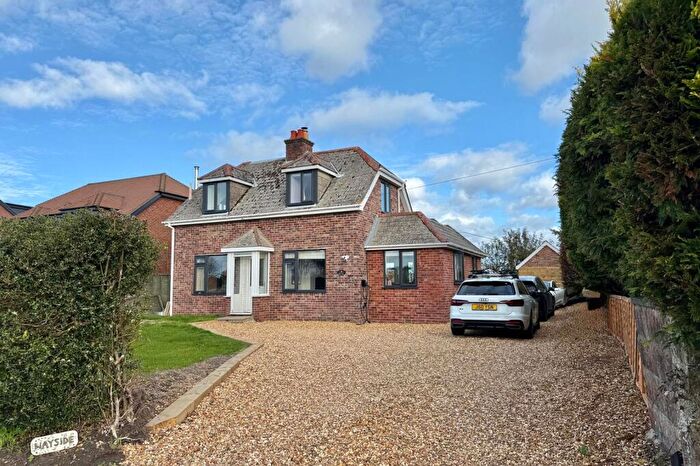
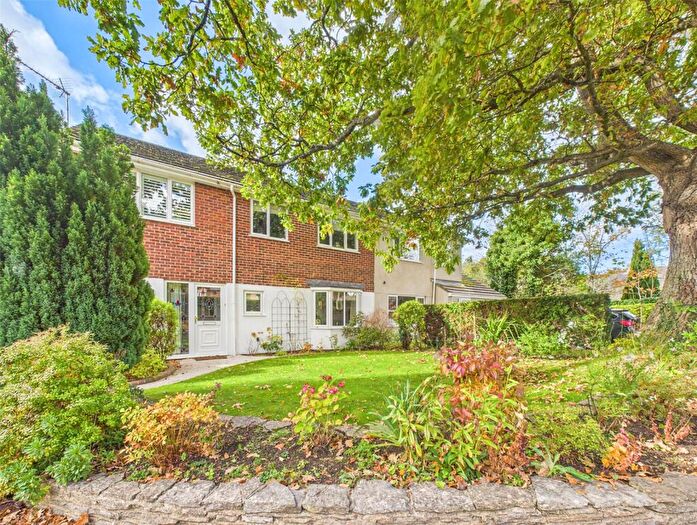
Houses for sale & to rent in Ringwood East And Sopley, Christchurch
House Prices in Ringwood East And Sopley
Properties in Ringwood East And Sopley have an average house price of £587,501.00 and had 36 Property Transactions within the last 3 years¹.
Ringwood East And Sopley is an area in Christchurch, Hampshire with 274 households², where the most expensive property was sold for £2,625,000.00.
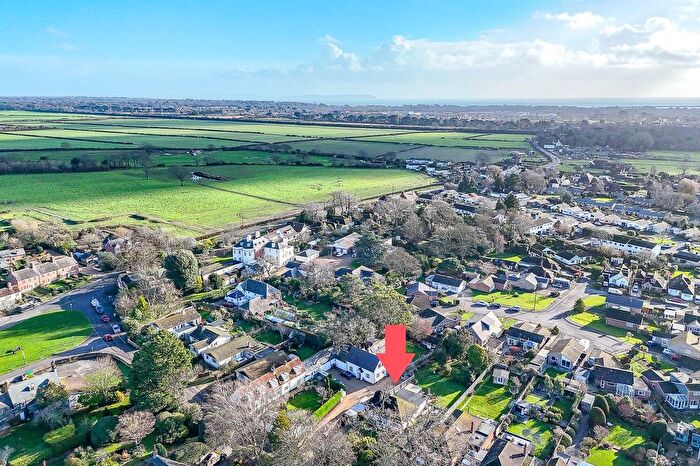
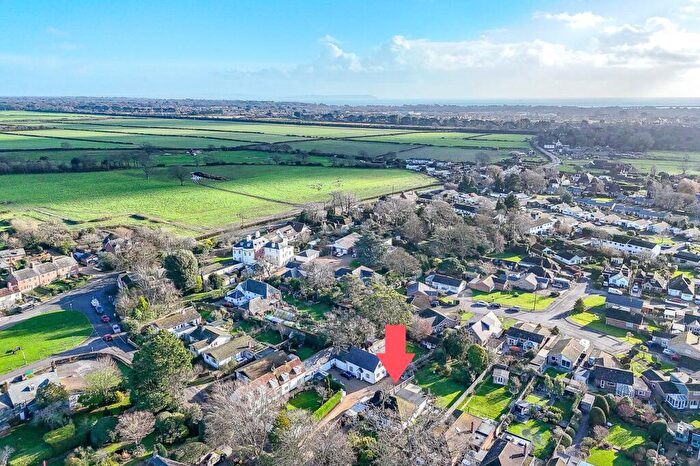
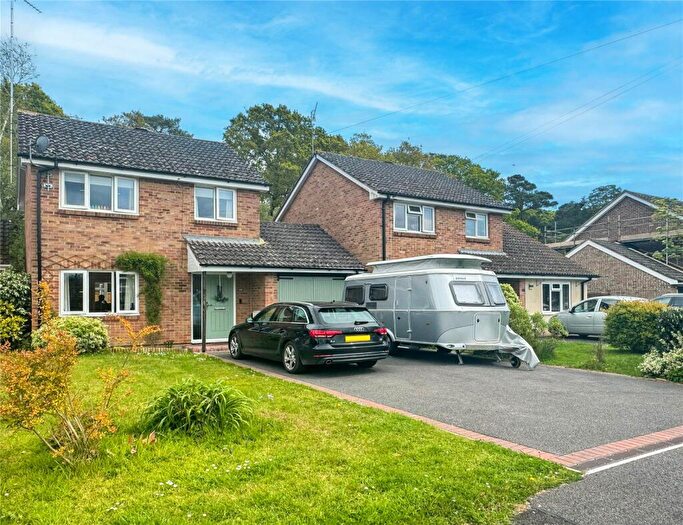
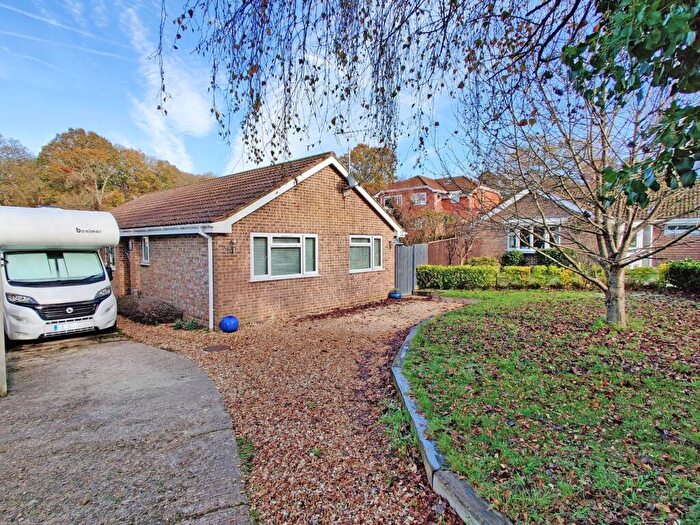
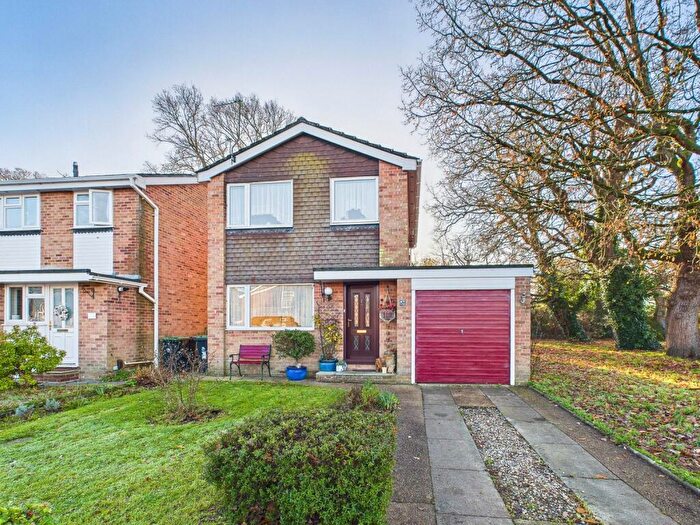
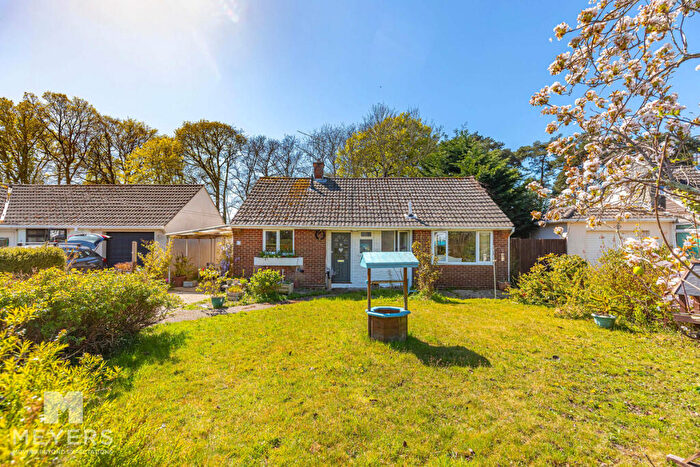
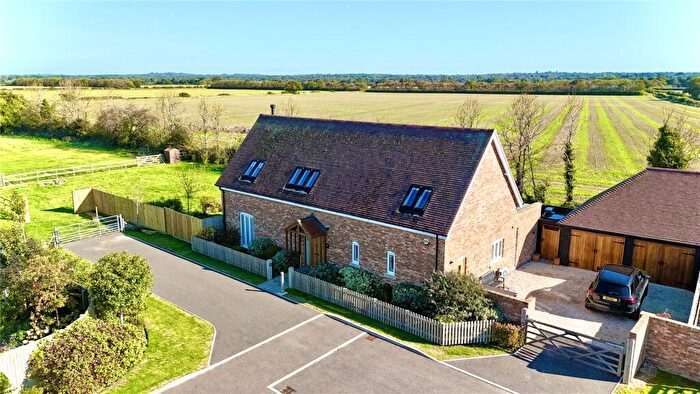
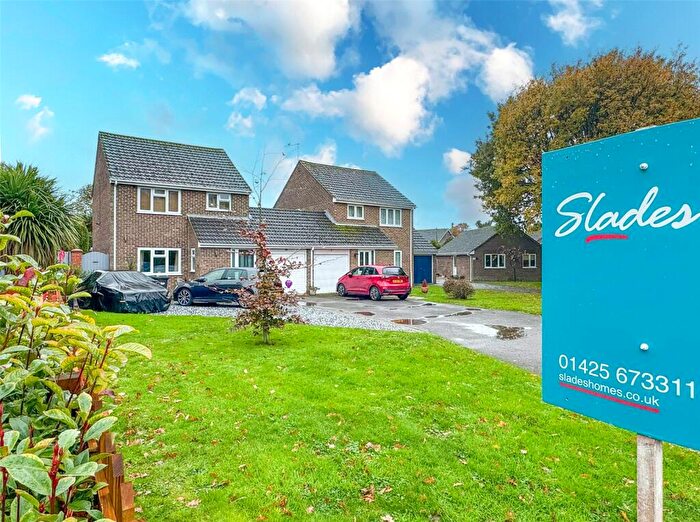
Properties for sale in Ringwood East And Sopley
Roads and Postcodes in Ringwood East And Sopley
Navigate through our locations to find the location of your next house in Ringwood East And Sopley, Christchurch for sale or to rent.
| Streets | Postcodes |
|---|---|
| Anna Lane | BH23 7BH BH23 8ER |
| Arnwood Drive | BH23 8FH |
| Avon Tyrrell | BH23 8EW BH23 8EE |
| Braggers Lane | BH23 8EF |
| Burley Road | BH23 8DN |
| Burnt House Lane | BH23 8AL BH23 8AN BH23 8DD |
| Court Lane | BH23 7BN |
| Derritt Lane | BH23 8AR BH23 8AS BH23 8AT BH23 8AX BH23 8AU |
| Fish Street | BH23 8EU |
| Harpway Lane | BH23 7BU |
| London Lane | BH23 7BL |
| Marryat Way | BH23 8FG |
| Meadow Close | BH23 7BD |
| Mosquito Way | BH23 8HE |
| North End | BH23 7BJ |
| North Ripley | BH23 8EL BH23 8EP BH23 8EX |
| Priests Lane | BH23 7BA |
| Ringwood Road | BH23 7BB BH23 7BE BH23 7BG BH23 7BQ BH23 8AF |
| Ripley | BH23 8ES |
| Shirley | BH23 8EH BH23 8EQ BH23 8EJ |
| South Ripley | BH23 8ET |
| Thatchers Lane | BH23 8EG |
| Thorney Hill | BH23 8ED |
| BH23 7AT BH23 7AU BH23 7AX BH23 7AY BH23 7AZ |
Transport near Ringwood East And Sopley
- FAQ
- Price Paid By Year
- Property Type Price
Frequently asked questions about Ringwood East And Sopley
What is the average price for a property for sale in Ringwood East And Sopley?
The average price for a property for sale in Ringwood East And Sopley is £587,501. This amount is 5% higher than the average price in Christchurch. There are 831 property listings for sale in Ringwood East And Sopley.
What streets have the most expensive properties for sale in Ringwood East And Sopley?
The streets with the most expensive properties for sale in Ringwood East And Sopley are Avon Tyrrell at an average of £2,625,000, Priests Lane at an average of £940,000 and Burnt House Lane at an average of £640,000.
What streets have the most affordable properties for sale in Ringwood East And Sopley?
The streets with the most affordable properties for sale in Ringwood East And Sopley are Arnwood Drive at an average of £375,312, Marryat Way at an average of £453,313 and Ringwood Road at an average of £567,711.
Which train stations are available in or near Ringwood East And Sopley?
Some of the train stations available in or near Ringwood East And Sopley are Hinton Admiral, Christchurch and Pokesdown.
Property Price Paid in Ringwood East And Sopley by Year
The average sold property price by year was:
| Year | Average Sold Price | Price Change |
Sold Properties
|
|---|---|---|---|
| 2025 | £605,125 | -28% |
4 Properties |
| 2024 | £773,925 | 36% |
10 Properties |
| 2023 | £495,200 | -2% |
14 Properties |
| 2022 | £507,187 | -11% |
8 Properties |
| 2021 | £564,975 | -6% |
12 Properties |
| 2020 | £598,750 | 36% |
6 Properties |
| 2019 | £385,714 | -21% |
7 Properties |
| 2018 | £466,728 | 5% |
24 Properties |
| 2017 | £441,669 | -21% |
58 Properties |
| 2016 | £535,289 | 32% |
12 Properties |
| 2015 | £364,055 | -90% |
9 Properties |
| 2014 | £692,500 | 37% |
4 Properties |
| 2013 | £434,642 | -13% |
7 Properties |
| 2012 | £491,833 | -62% |
3 Properties |
| 2011 | £796,250 | 44% |
4 Properties |
| 2010 | £449,245 | 20% |
10 Properties |
| 2009 | £361,428 | -25% |
7 Properties |
| 2008 | £453,000 | -6% |
2 Properties |
| 2007 | £478,977 | 6% |
10 Properties |
| 2006 | £449,958 | 27% |
17 Properties |
| 2005 | £327,635 | -18% |
7 Properties |
| 2004 | £385,464 | 18% |
14 Properties |
| 2003 | £317,829 | -6% |
12 Properties |
| 2002 | £335,700 | 22% |
5 Properties |
| 2001 | £262,250 | 22% |
6 Properties |
| 2000 | £203,332 | -7% |
12 Properties |
| 1999 | £216,650 | -16% |
10 Properties |
| 1998 | £250,750 | 38% |
4 Properties |
| 1997 | £156,295 | 14% |
10 Properties |
| 1996 | £133,827 | -15% |
9 Properties |
| 1995 | £154,000 | - |
6 Properties |
Property Price per Property Type in Ringwood East And Sopley
Here you can find historic sold price data in order to help with your property search.
The average Property Paid Price for specific property types in the last three years are:
| Property Type | Average Sold Price | Sold Properties |
|---|---|---|
| Semi Detached House | £460,055.00 | 9 Semi Detached Houses |
| Detached House | £823,873.00 | 17 Detached Houses |
| Terraced House | £300,370.00 | 10 Terraced Houses |

