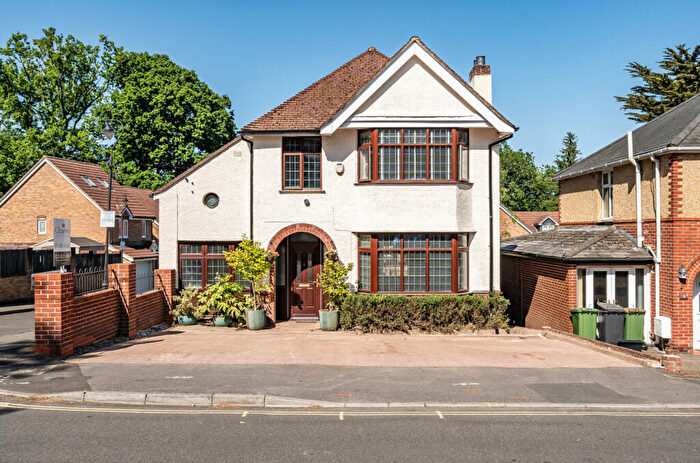
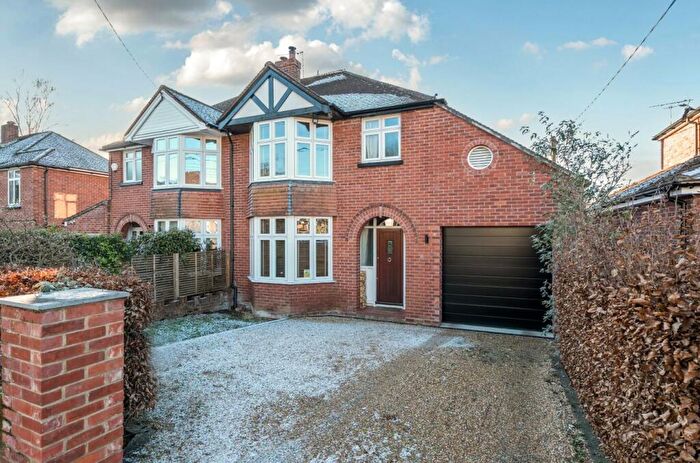
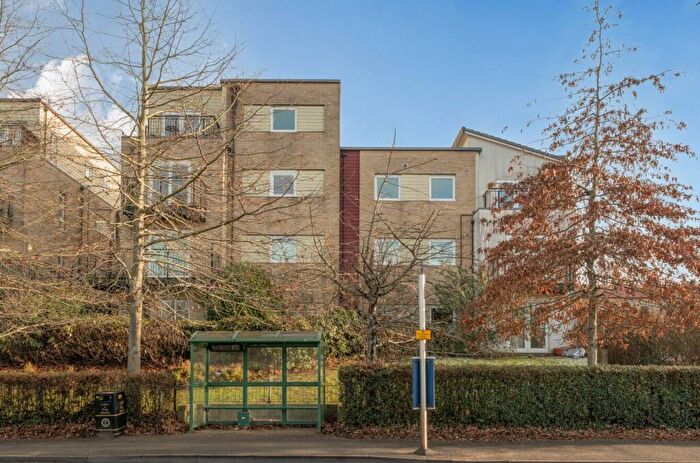
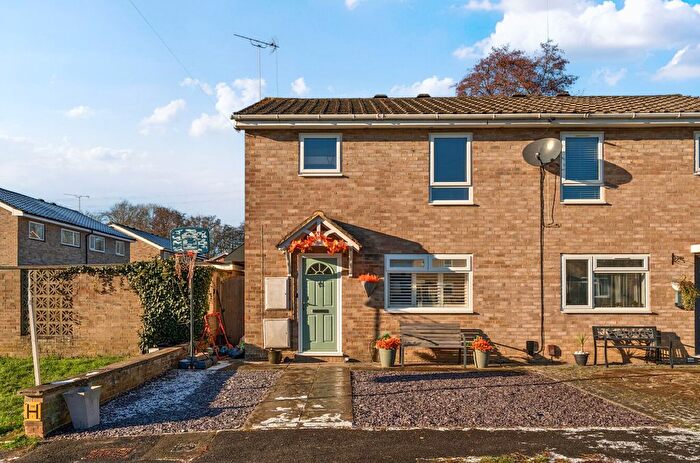
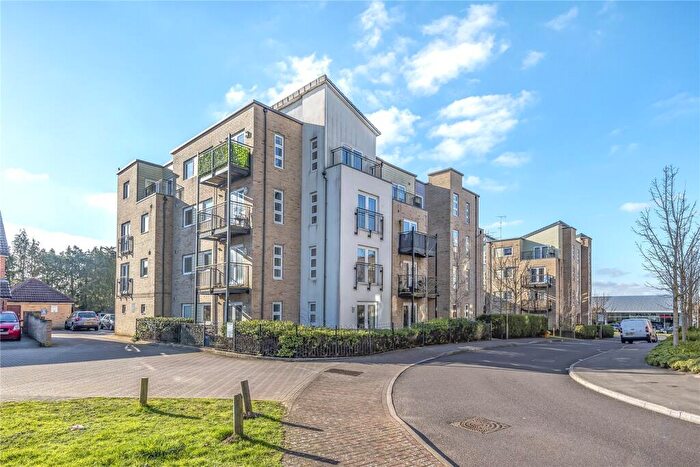
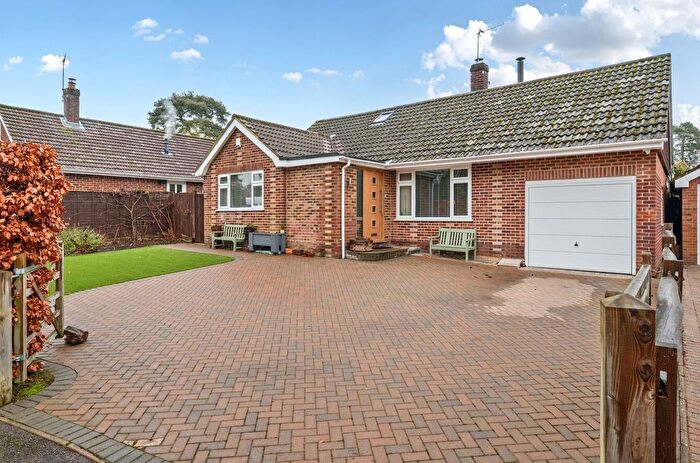
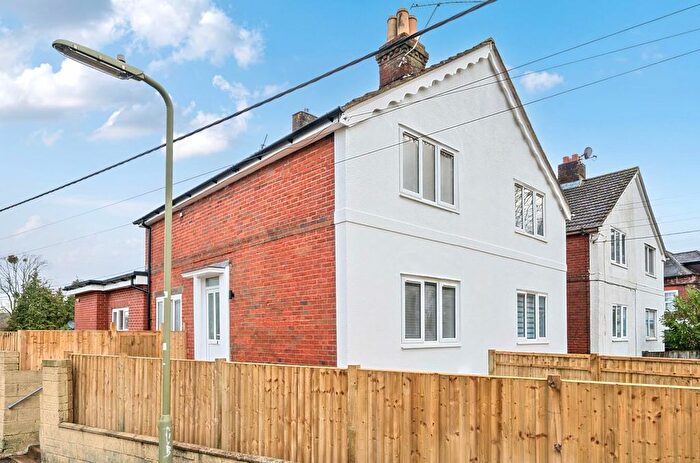
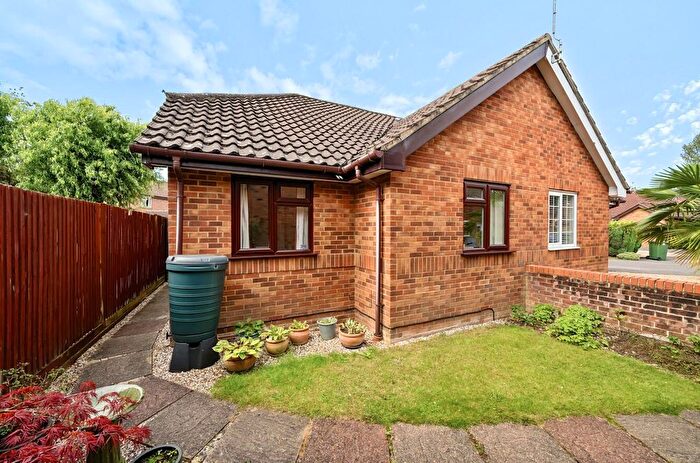
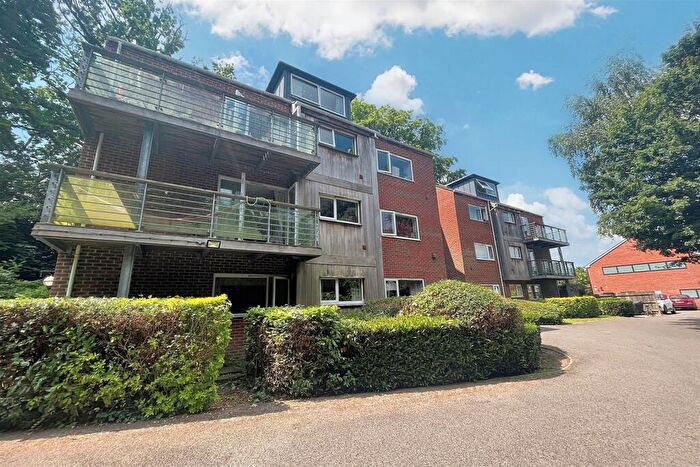
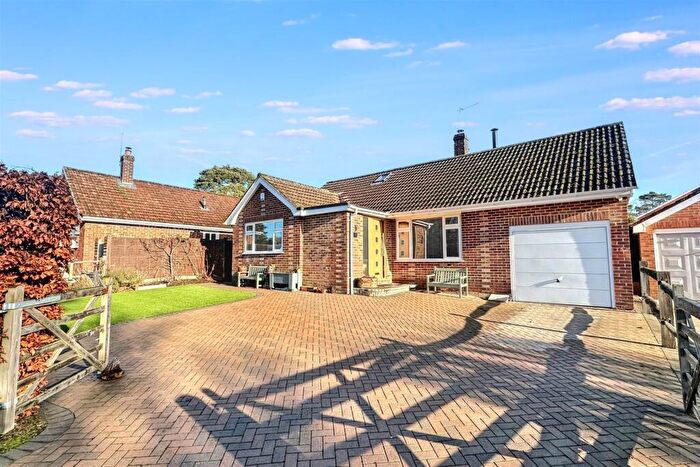
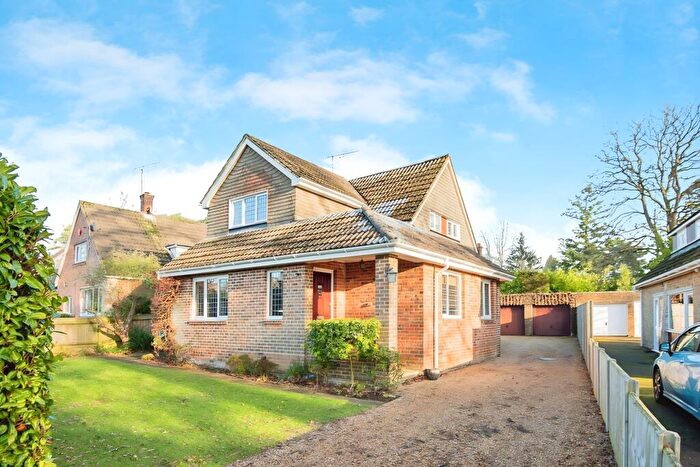
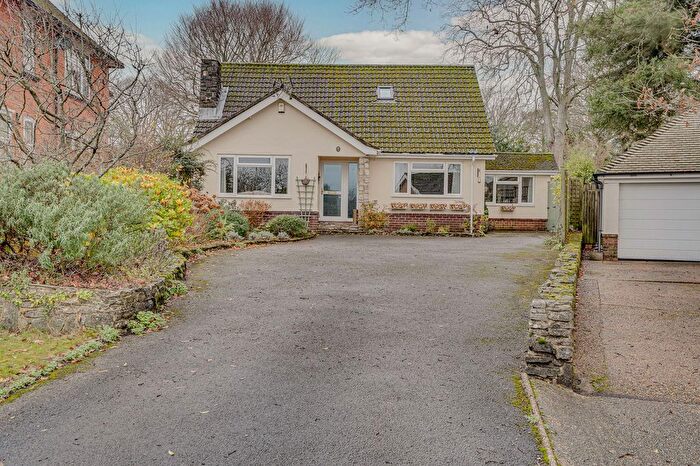
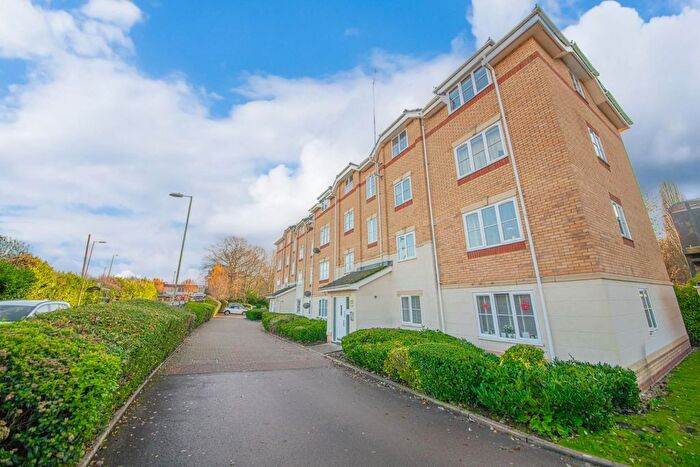
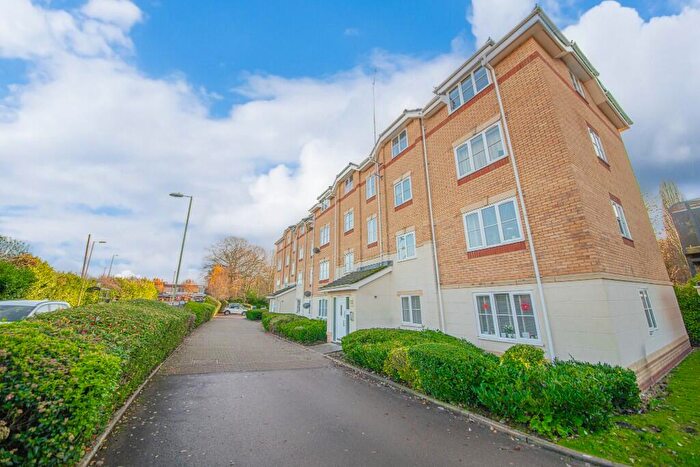
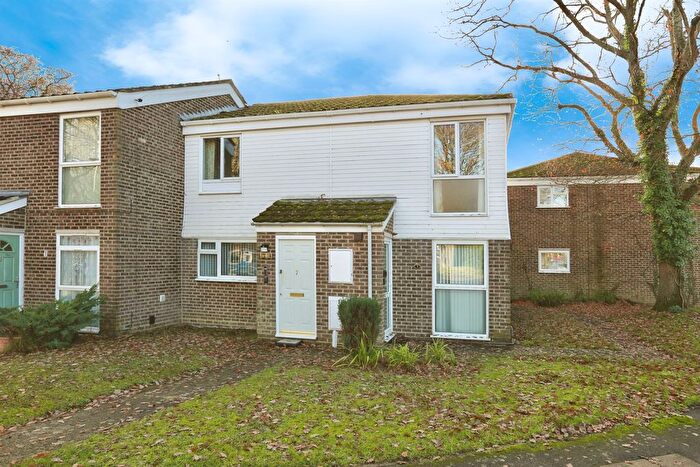
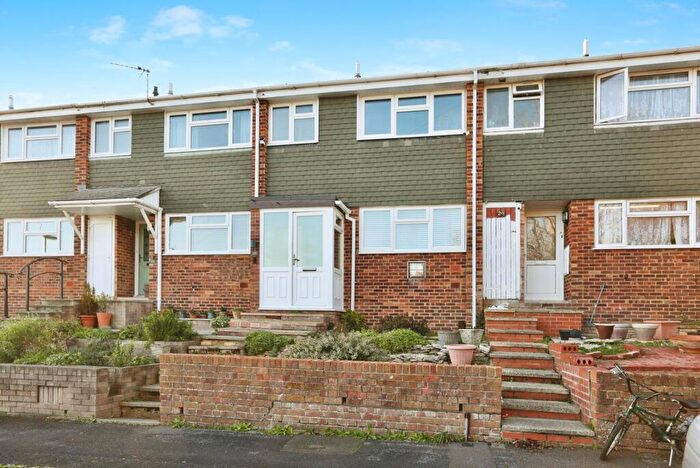
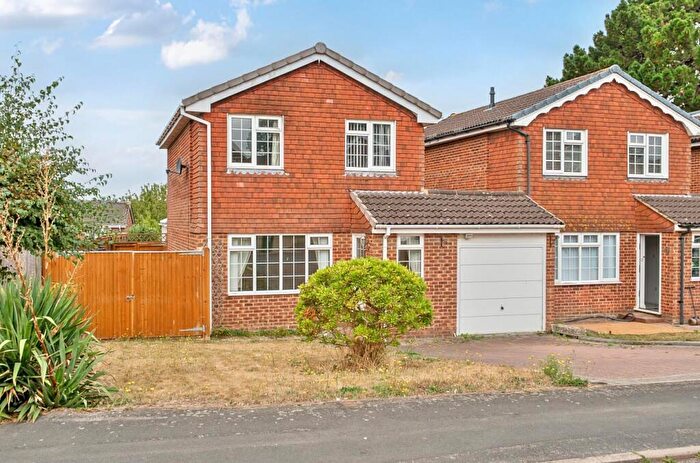
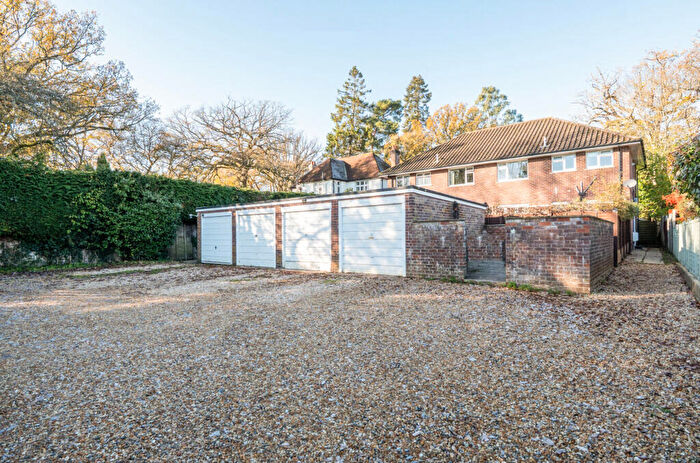
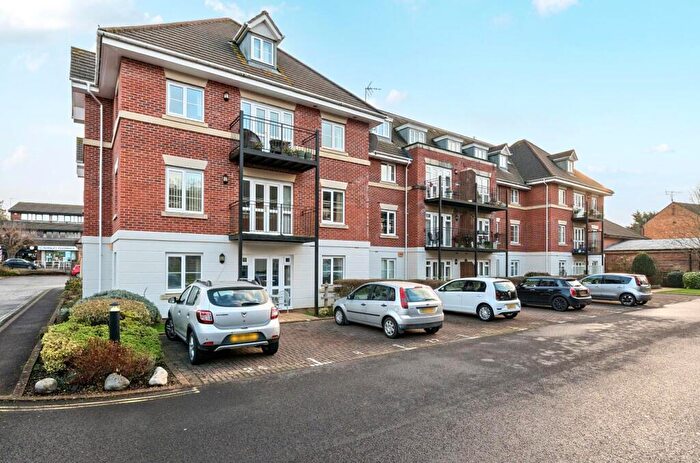
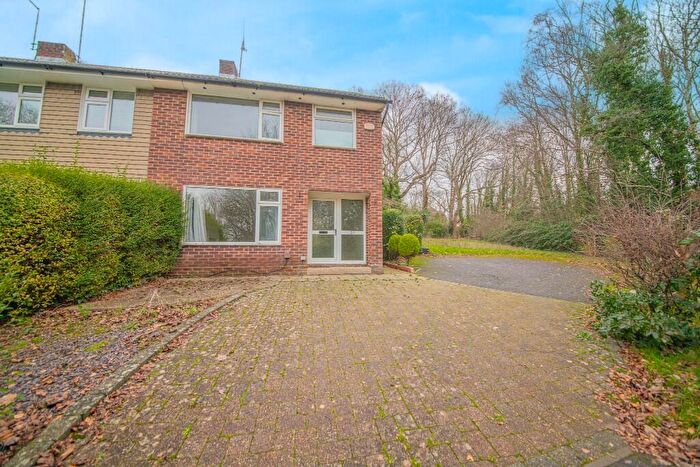
Houses for sale & to rent in Chandlers Ford East, Eastleigh
House Prices in Chandlers Ford East
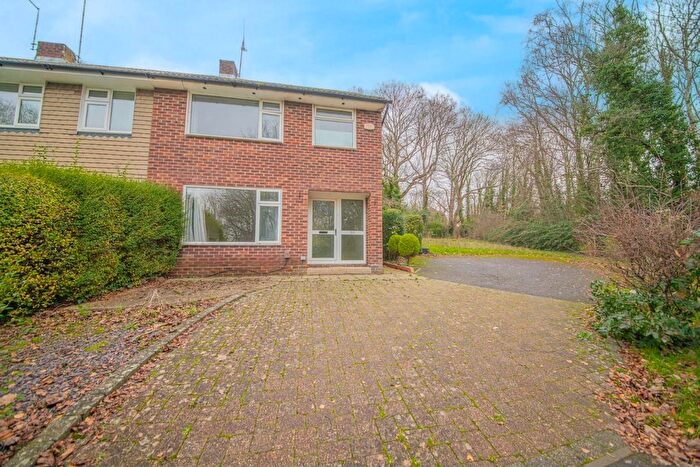
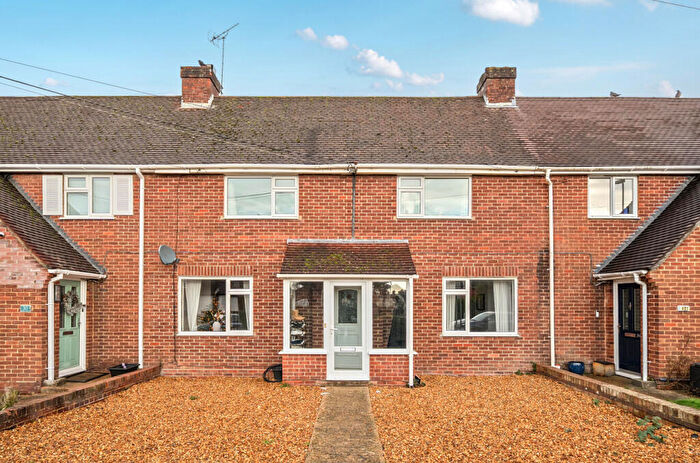
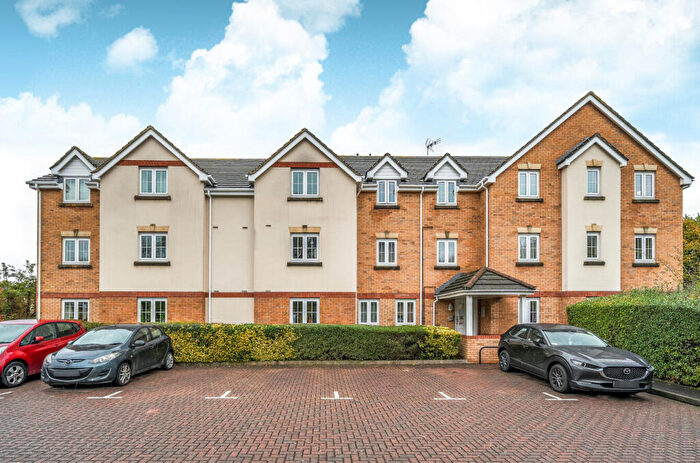
Properties in Chandlers Ford East have an average house price of £344,521.00 and had 270 Property Transactions within the last 3 years¹.
Chandlers Ford East is an area in Eastleigh, Hampshire with 2,018 households², where the most expensive property was sold for £790,000.00.
Properties for sale in Chandlers Ford East
Roads and Postcodes in Chandlers Ford East
Navigate through our locations to find the location of your next house in Chandlers Ford East, Eastleigh for sale or to rent.
| Streets | Postcodes |
|---|---|
| Ashley Gardens | SO53 2JH |
| Avon Green | SO53 2NL |
| Beechcroft Close | SO53 2HU |
| Beechcroft Way | SO53 2HR |
| Beresford Close | SO53 2LX |
| Beresford Gardens | SO53 2LZ |
| Beresford Road | SO53 2JZ SO53 2LU SO53 2LW SO53 2LY |
| Bodycoats Road | SO53 2GW SO53 2GX SO53 2GY SO53 2HA SO53 2HB SO53 2JA SO53 2JB SO53 2JD SO53 2NP |
| Brownhill Gardens | SO53 2PR |
| Brownhill Road | SO53 2EA SO53 2EE SO53 2EG SO53 2EJ |
| Carisbrooke Crescent | SO53 2LQ |
| Carlyn Drive | SO53 2DJ SO53 2DL |
| Cherwell Gardens | SO53 2NH |
| Clanfield Close | SO53 2HL |
| Clanfield Drive | SO53 2HJ |
| Clanfield Way | SO53 2HN |
| Craven Road | SO53 2HD SO53 2HG SO53 2HH |
| Cumberland Avenue | SO53 2JX |
| Cumberland Close | SO53 2JY |
| Fircroft Drive | SO53 2HE |
| Fryern Close | SO53 2LF |
| Greendale Close | SO53 2JJ |
| Greenways | SO53 2LE |
| Hamble Court | SO53 2NN |
| Hardwick Road | SO53 2GZ |
| Heathcote Road | SO53 2HF |
| Highfield Close | SO53 2JU |
| Highfield Road | SO53 2JT SO53 2JW |
| Hillcrest Avenue | SO53 2HP SO53 2HS SO53 2JN SO53 2JP SO53 2JQ SO53 2JR |
| Hillcrest Drive | SO53 2HQ |
| Hursley Road | SO53 2FW SO53 2RT |
| Kings Close | SO53 2FF |
| Kings Road | SO53 2EX SO53 2EY SO53 2FD |
| Kingsway | SO53 2FE SO53 2FG |
| Mead Road | SO53 2EZ SO53 2FB |
| Meadbrook Gardens | SO53 2QE |
| Medina Close | SO53 2NE |
| Meon Crescent | SO53 2PA SO53 2PB |
| Milford Gardens | SO53 2HY |
| Mount Drive | SO53 2PN |
| Oakhill Close | SO53 2PY |
| Oakmount Road | SO53 2ER SO53 2LG SO53 2LJ SO53 2LN SO53 2LS |
| Osborne Drive | SO53 2ND |
| Park Road | SO53 2EL SO53 2ET SO53 2EW |
| Parkway Gardens | SO53 2DZ SO53 2EN |
| Purkess Close | SO53 2ED |
| Regent Road | SO53 2GT SO53 2GU |
| Ribble Close | SO53 2NQ |
| Ridgeway Close | SO53 2LR |
| Ridgeway Walk | SO53 2LT |
| Saxon Walk | SO53 2HZ |
| Seymour Close | SO53 2JE |
| Solent Close | SO53 2HX |
| Springhill Road | SO53 2GP SO53 2GS |
| Tadburn Close | SO53 2NF |
| The Copse | SO53 2HW |
| The Hillway | SO53 2PJ |
| The Precinct | SO53 2GD SO53 2GE |
| Warren Avenue | SO53 2JF SO53 2JL |
| Warren Close | SO53 2JG |
| Welles Road | SO53 2GQ |
| Westmorland Way | SO53 2LA SO53 2LB SO53 2NA |
| Winchester Road | SO53 2GF SO53 2GG SO53 2GJ SO53 2GN SO53 2RD |
| Wyvern Close | SO53 2HT |
Transport near Chandlers Ford East
- FAQ
- Price Paid By Year
- Property Type Price
Frequently asked questions about Chandlers Ford East
What is the average price for a property for sale in Chandlers Ford East?
The average price for a property for sale in Chandlers Ford East is £344,521. This amount is 6% lower than the average price in Eastleigh. There are 1,528 property listings for sale in Chandlers Ford East.
What streets have the most expensive properties for sale in Chandlers Ford East?
The streets with the most expensive properties for sale in Chandlers Ford East are Kingsway at an average of £665,000, The Hillway at an average of £548,000 and Kings Road at an average of £500,140.
What streets have the most affordable properties for sale in Chandlers Ford East?
The streets with the most affordable properties for sale in Chandlers Ford East are Oakhill Close at an average of £149,500, The Precinct at an average of £198,500 and Meadbrook Gardens at an average of £203,500.
Which train stations are available in or near Chandlers Ford East?
Some of the train stations available in or near Chandlers Ford East are Chandlers Ford, Eastleigh and Southampton Airport (Parkway).
Property Price Paid in Chandlers Ford East by Year
The average sold property price by year was:
| Year | Average Sold Price | Price Change |
Sold Properties
|
|---|---|---|---|
| 2025 | £363,901 | 6% |
53 Properties |
| 2024 | £340,517 | -6% |
79 Properties |
| 2023 | £361,101 | 11% |
64 Properties |
| 2022 | £320,575 | 5% |
74 Properties |
| 2021 | £304,670 | 9% |
100 Properties |
| 2020 | £277,364 | 6% |
65 Properties |
| 2019 | £261,230 | -5% |
87 Properties |
| 2018 | £275,110 | -3% |
89 Properties |
| 2017 | £284,676 | 7% |
77 Properties |
| 2016 | £264,326 | 13% |
89 Properties |
| 2015 | £230,846 | 7% |
92 Properties |
| 2014 | £215,803 | 2% |
102 Properties |
| 2013 | £211,568 | 2% |
69 Properties |
| 2012 | £207,692 | 8% |
84 Properties |
| 2011 | £191,187 | -2% |
68 Properties |
| 2010 | £194,885 | 6% |
55 Properties |
| 2009 | £183,184 | -8% |
66 Properties |
| 2008 | £198,518 | -12% |
69 Properties |
| 2007 | £222,126 | 16% |
116 Properties |
| 2006 | £187,241 | -0,1% |
131 Properties |
| 2005 | £187,467 | 5% |
118 Properties |
| 2004 | £178,197 | 10% |
96 Properties |
| 2003 | £159,500 | 9% |
98 Properties |
| 2002 | £145,050 | 16% |
117 Properties |
| 2001 | £122,102 | 12% |
122 Properties |
| 2000 | £107,023 | 18% |
120 Properties |
| 1999 | £87,968 | 13% |
138 Properties |
| 1998 | £76,412 | 10% |
91 Properties |
| 1997 | £68,835 | 10% |
109 Properties |
| 1996 | £62,252 | 1% |
129 Properties |
| 1995 | £61,697 | - |
109 Properties |
Property Price per Property Type in Chandlers Ford East
Here you can find historic sold price data in order to help with your property search.
The average Property Paid Price for specific property types in the last three years are:
| Property Type | Average Sold Price | Sold Properties |
|---|---|---|
| Semi Detached House | £357,520.00 | 79 Semi Detached Houses |
| Detached House | £455,828.00 | 64 Detached Houses |
| Terraced House | £315,185.00 | 87 Terraced Houses |
| Flat | £204,562.00 | 40 Flats |

