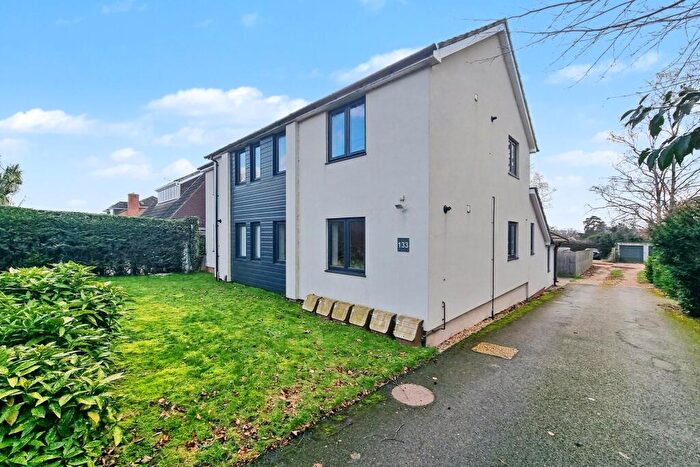
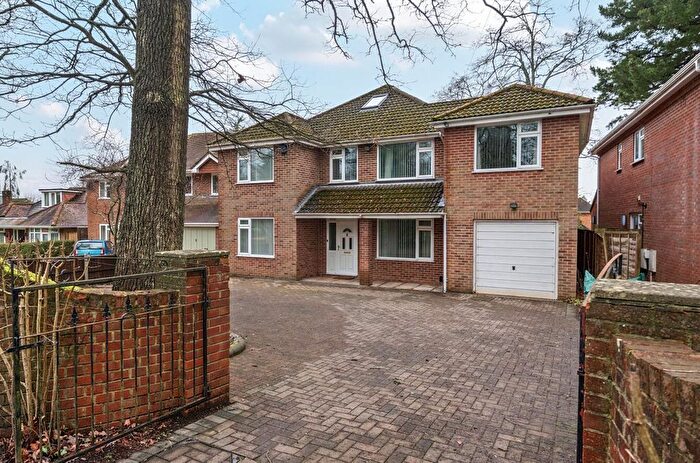
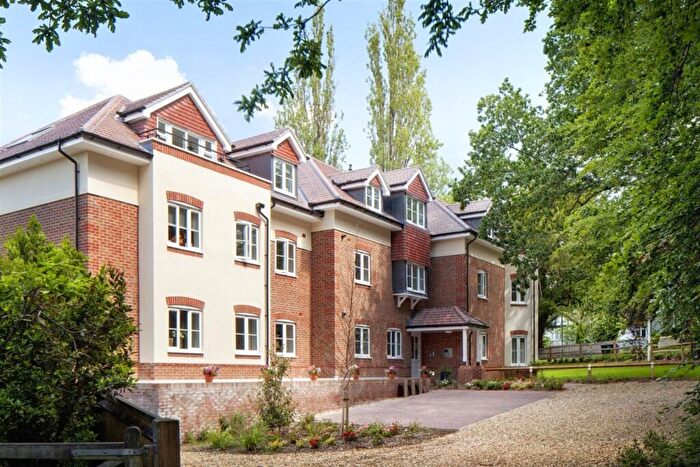
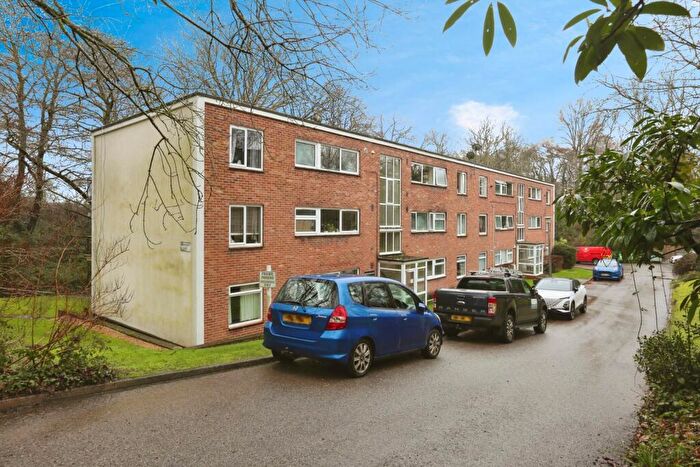
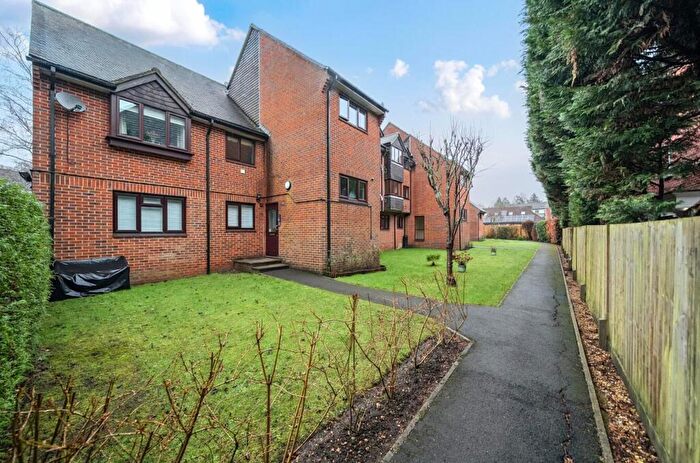
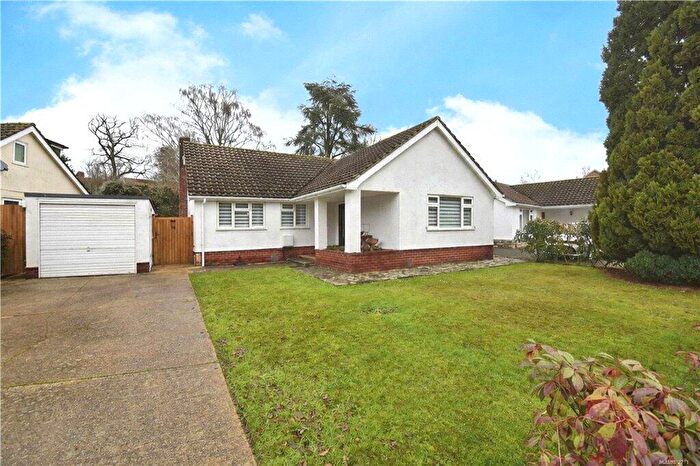
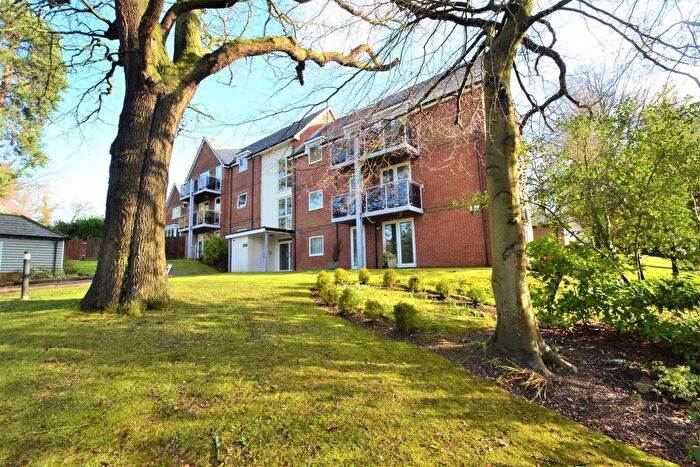
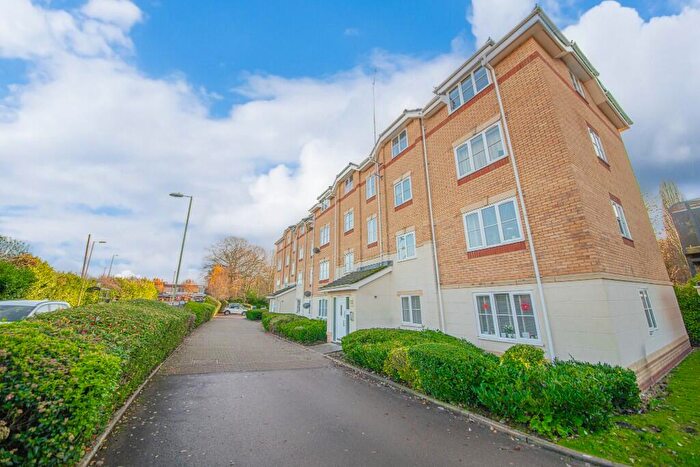
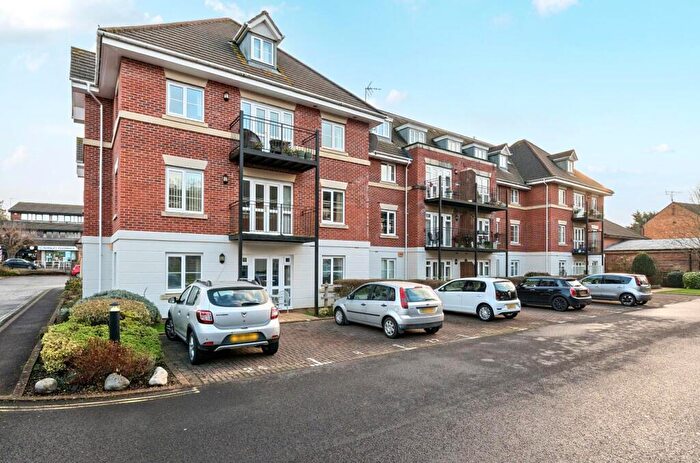
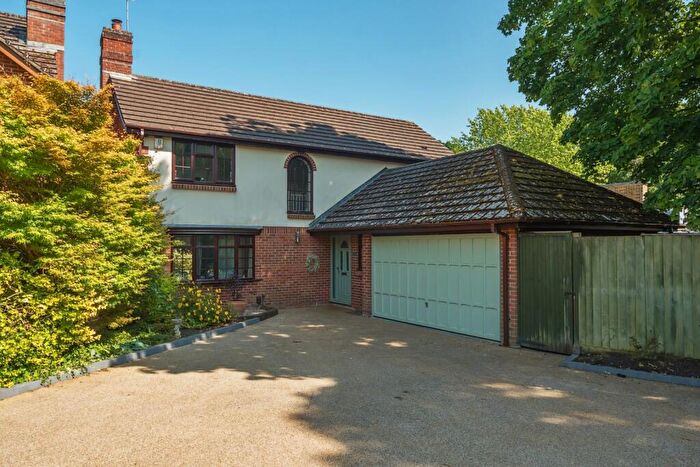
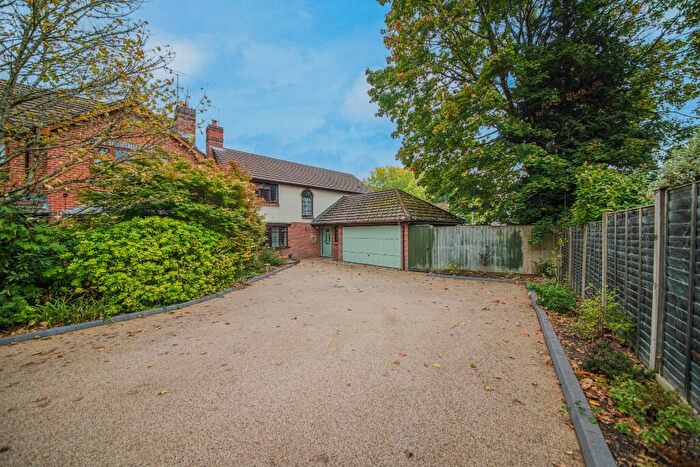
Houses for sale & to rent in Hiltingbury West, Eastleigh
House Prices in Hiltingbury West
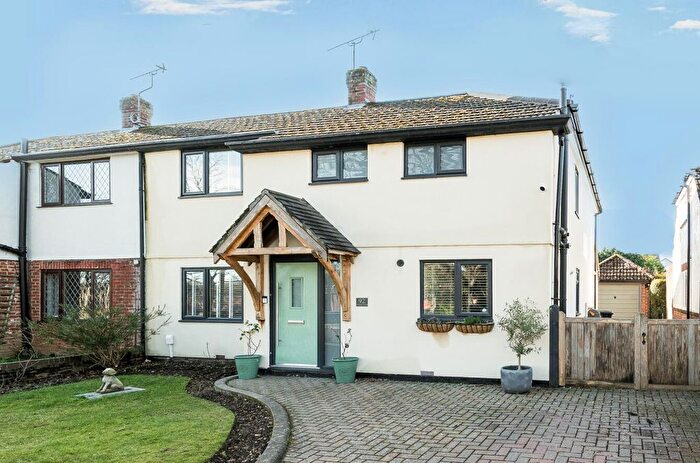
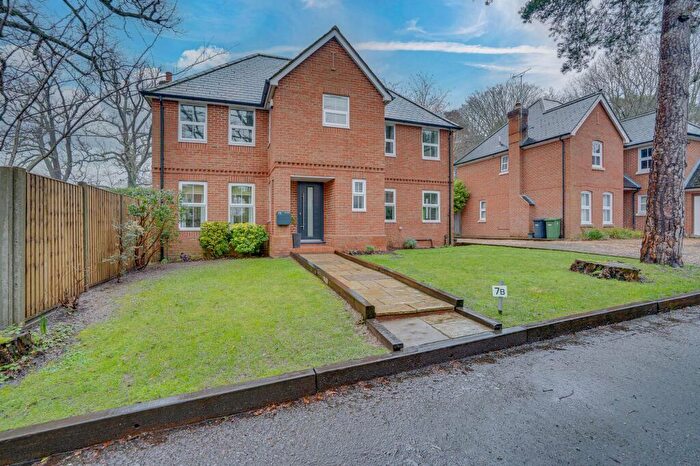
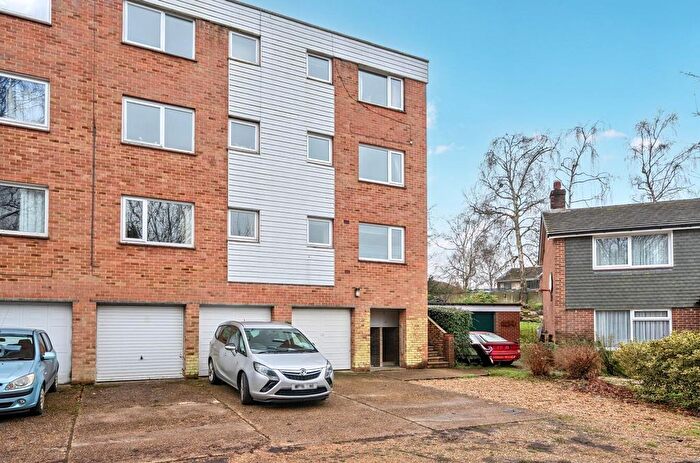
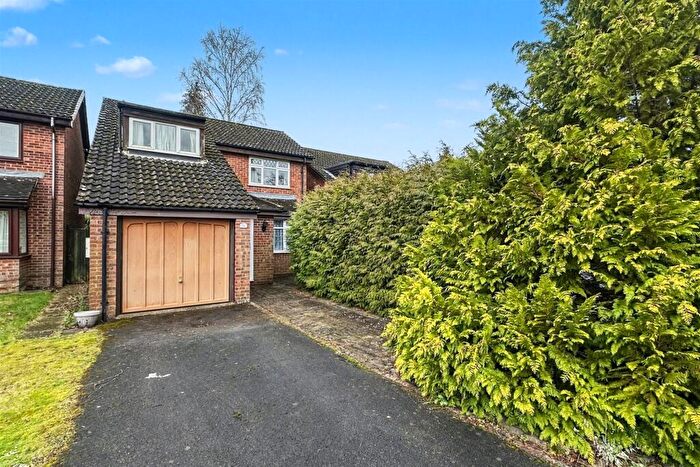
Properties in Hiltingbury West have an average house price of £485,022.00 and had 211 Property Transactions within the last 3 years¹.
Hiltingbury West is an area in Eastleigh, Hampshire with 2,163 households², where the most expensive property was sold for £1,390,000.00.
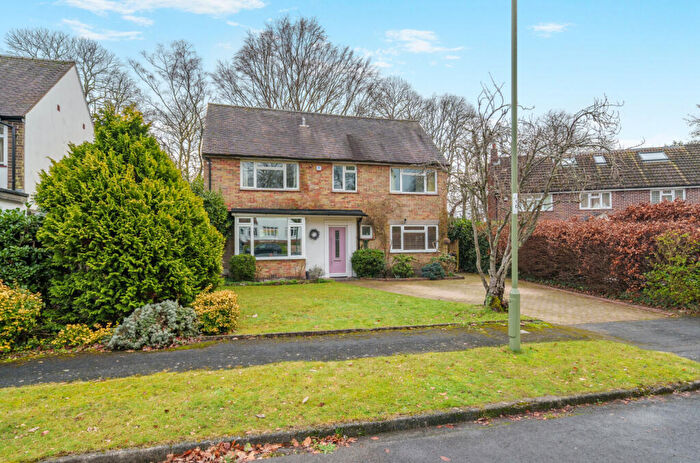
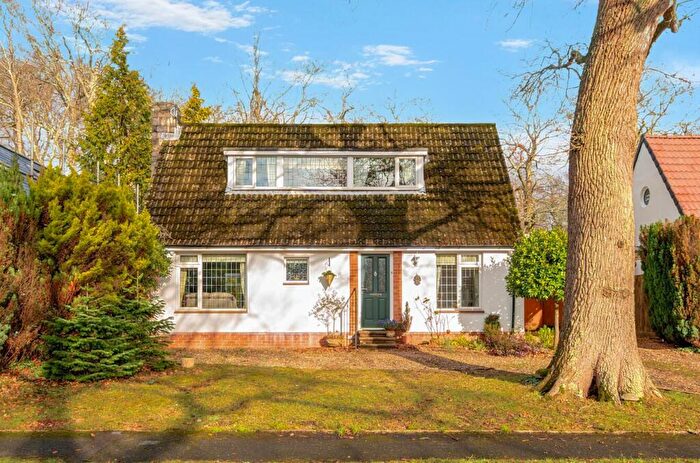
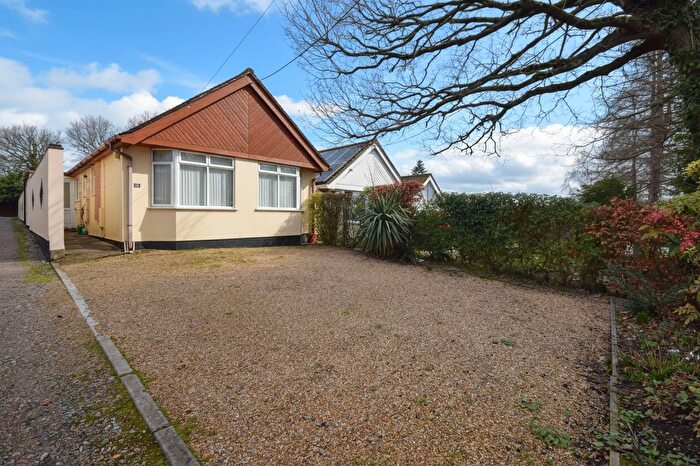
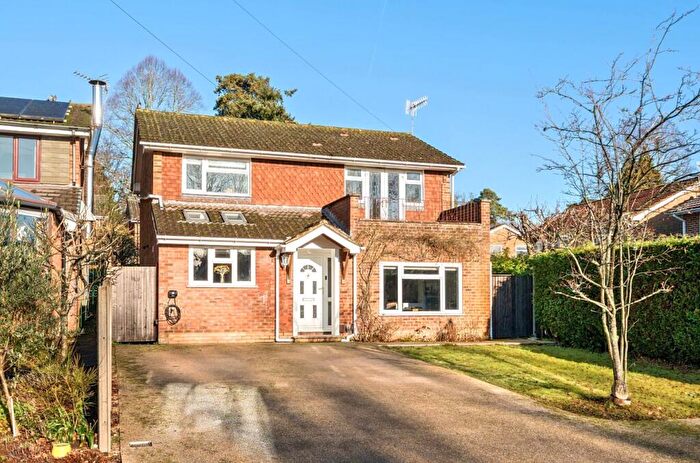
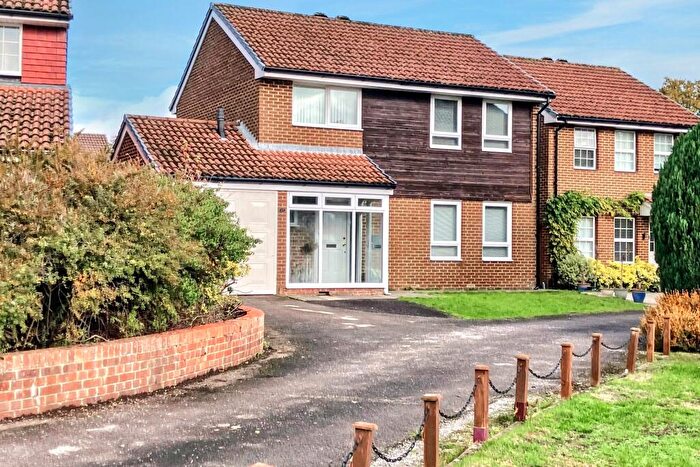
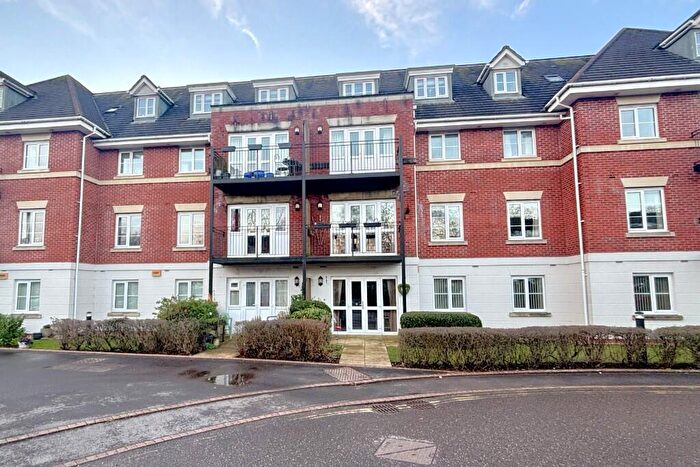
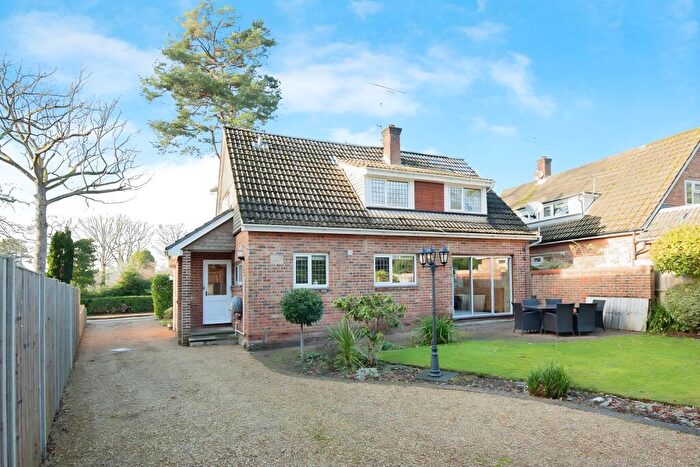
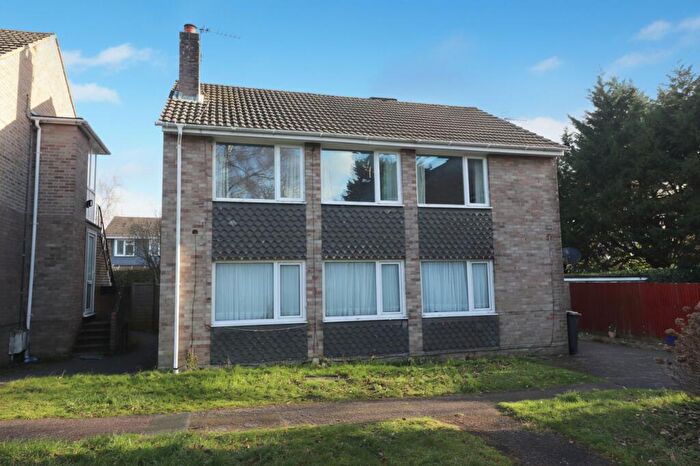
Properties for sale in Hiltingbury West
Roads and Postcodes in Hiltingbury West
Navigate through our locations to find the location of your next house in Hiltingbury West, Eastleigh for sale or to rent.
| Streets | Postcodes |
|---|---|
| Acorn Drive | SO53 1GE |
| Adamson Close | SO53 1ND |
| Albury Place | SO53 1TY |
| Apsley Place | SO53 1TE |
| Ashbridge Rise | SO53 1SA |
| Ashdown Close | SO53 5QF |
| Ashdown Road | SO53 5QG SO53 5QH SO53 5QJ SO53 5QW SO53 5QX SO53 5QZ SO53 5RB |
| Ashton Place | SO53 1UB |
| Avebury Gardens | SO53 1SX |
| Avonborne Way | SO53 1TF |
| Balmoral Close | SO53 1TG |
| Barford Close | SO53 1TH |
| Beech Close | SO53 1NE |
| Beech Road | SO53 1LR SO53 1LT |
| Benmore Gardens | SO53 1TT |
| Boynton Close | SO53 1TQ |
| Brackenway Road | SO53 1JZ SO53 1LA |
| Carne Close | SO53 1HH |
| Charlecote Drive | SO53 1SF |
| Charnwood Close | SO53 5QP |
| Charnwood Crescent | SO53 5QL SO53 5QN SO53 5QT SO53 5QU |
| Charnwood Gardens | SO53 5QR |
| Chillington Gardens | SO53 1SB |
| Clevelands Close | SO53 5PX |
| Colvin Gardens | SO53 1JR |
| Common Close | SO53 1HF |
| Common Gardens | SO53 1HL |
| Common Road | SO53 1HE SO53 1HG SO53 1HJ SO53 1HP SO53 1HU |
| Cranborne Gardens | SO53 1TA |
| Cranford Gardens | SO53 1PU |
| Cuckoo Bushes Lane | SO53 1JW SO53 1JX SO53 1JY |
| Cypress Grove | SO53 1GT |
| Dale Green | SO53 1TS |
| Drummond Way | SO53 1TX |
| Firwood Close | SO53 1HN |
| Forest Close | SO53 1NB |
| Forest Road | SO53 1LZ SO53 1NA |
| Gardner Way | SO53 1JJ SO53 1JL |
| Gordon Road | SO53 5AN SO53 5AP SO53 5AQ |
| Hazel Close | SO53 5RF |
| Heathfield Close | SO53 5RS |
| Heathfield Road | SO53 5RL SO53 5RN SO53 5RP SO53 5RR |
| Hiltingbury Close | SO53 5NY |
| Hiltingbury Road | SO53 5EJ SO53 5EL SO53 5NJ SO53 5NL SO53 5NN SO53 5NP SO53 5NQ SO53 5NR SO53 5NS SO53 5NT SO53 5NU SO53 5NZ |
| Hocombe Drive | SO53 5QE |
| Hocombe Park Close | SO53 5PT |
| Hocombe Road | SO53 5QB |
| Hoveton Grove | SO53 1QQ |
| Hursley Road | SO53 1AL SO53 1JH SO53 1JN SO53 1JP SO53 1JQ SO53 1JS SO53 5PG SO53 5PJ |
| Kelmscott Gardens | SO53 1TD |
| Laidlaw Gardens | SO53 1JA |
| Lakewood Road | SO53 1EU SO53 5AE |
| Lauriston Drive | SO53 1PW |
| Linden Grove | SO53 1LB SO53 1LD SO53 1LE |
| Maytree Road | SO53 5RT SO53 5RU |
| Merdon Avenue | SO53 1ET SO53 1GA SO53 1GD |
| Morley Gardens | SO53 1JF |
| Nichol Road | SO53 5AX SO53 5AY |
| Nickson Close | SO53 1HD |
| North Millers Dale | SO53 1SZ |
| Oakwood Close | SO53 5NW SO53 5NX |
| Oakwood Road | SO53 1LU SO53 1LW SO53 1LX |
| Ormesby Drive | SO53 1SH |
| Park Road | SO53 1HQ SO53 1HS SO53 1HT SO53 1HX SO53 1HY |
| Paulson Close | SO53 1HR |
| Pine Crescent | SO53 1LL SO53 1LN |
| Pine Road | SO53 1JT SO53 1JU SO53 1LF SO53 1LG SO53 1LH SO53 1LJ SO53 1LP SO53 1LQ |
| Polesden Close | SO53 1TW |
| Richmond Close | SO53 5RA |
| Rosemoor Grove | SO53 1TB |
| Rothville Place | SO53 5LS |
| Stratfield Drive | SO53 1SG |
| Sycamore Avenue | SO53 5QY SO53 5RE SO53 5RG SO53 5RH SO53 5RJ SO53 5RW |
| The Deanery | SO53 1TL |
| The Maples | SO53 1DZ |
| The Tanyards | SO53 1TJ |
| Tithewood Close | SO53 5PY |
| Valley Road | SO53 1GQ |
| Vanburgh Way | SO53 1SE |
| Wallington Drive | SO53 1TR |
| Walnut Close | SO53 5RQ |
| Weavers Place | SO53 1TU |
Transport near Hiltingbury West
-
Chandlers Ford Station
-
Eastleigh Station
-
Shawford Station
-
Southampton Airport (Parkway) Station
-
Swaythling Station
-
Romsey Station
- FAQ
- Price Paid By Year
- Property Type Price
Frequently asked questions about Hiltingbury West
What is the average price for a property for sale in Hiltingbury West?
The average price for a property for sale in Hiltingbury West is £485,022. This amount is 32% higher than the average price in Eastleigh. There are 1,185 property listings for sale in Hiltingbury West.
What streets have the most expensive properties for sale in Hiltingbury West?
The streets with the most expensive properties for sale in Hiltingbury West are Lakewood Road at an average of £1,200,000, Beech Road at an average of £980,000 and Merdon Avenue at an average of £960,000.
What streets have the most affordable properties for sale in Hiltingbury West?
The streets with the most affordable properties for sale in Hiltingbury West are Ashton Place at an average of £188,166, Charnwood Close at an average of £205,000 and Charnwood Crescent at an average of £285,055.
Which train stations are available in or near Hiltingbury West?
Some of the train stations available in or near Hiltingbury West are Chandlers Ford, Eastleigh and Shawford.
Property Price Paid in Hiltingbury West by Year
The average sold property price by year was:
| Year | Average Sold Price | Price Change |
Sold Properties
|
|---|---|---|---|
| 2025 | £480,934 | 1% |
65 Properties |
| 2024 | £476,717 | -5% |
85 Properties |
| 2023 | £500,950 | 1% |
61 Properties |
| 2022 | £495,429 | 4% |
71 Properties |
| 2021 | £476,900 | 14% |
104 Properties |
| 2020 | £410,139 | 6% |
79 Properties |
| 2019 | £385,600 | -2% |
88 Properties |
| 2018 | £392,004 | -7% |
74 Properties |
| 2017 | £418,170 | 2% |
89 Properties |
| 2016 | £409,172 | 10% |
89 Properties |
| 2015 | £368,127 | 3% |
87 Properties |
| 2014 | £358,578 | 17% |
94 Properties |
| 2013 | £296,536 | 0,2% |
86 Properties |
| 2012 | £295,837 | -1% |
91 Properties |
| 2011 | £298,945 | -11% |
83 Properties |
| 2010 | £330,398 | 16% |
76 Properties |
| 2009 | £277,377 | -1% |
74 Properties |
| 2008 | £279,614 | -1% |
87 Properties |
| 2007 | £283,470 | 3% |
108 Properties |
| 2006 | £275,424 | 8% |
138 Properties |
| 2005 | £252,709 | -7% |
141 Properties |
| 2004 | £270,754 | 7% |
154 Properties |
| 2003 | £252,488 | 20% |
113 Properties |
| 2002 | £202,524 | 16% |
104 Properties |
| 2001 | £169,492 | 13% |
119 Properties |
| 2000 | £146,966 | 20% |
105 Properties |
| 1999 | £117,961 | 4% |
119 Properties |
| 1998 | £113,097 | 12% |
105 Properties |
| 1997 | £99,895 | 11% |
103 Properties |
| 1996 | £88,700 | 0,4% |
104 Properties |
| 1995 | £88,379 | - |
108 Properties |
Property Price per Property Type in Hiltingbury West
Here you can find historic sold price data in order to help with your property search.
The average Property Paid Price for specific property types in the last three years are:
| Property Type | Average Sold Price | Sold Properties |
|---|---|---|
| Semi Detached House | £393,232.00 | 28 Semi Detached Houses |
| Detached House | £629,675.00 | 121 Detached Houses |
| Terraced House | £381,700.00 | 15 Terraced Houses |
| Flat | £200,276.00 | 47 Flats |

