
Houses for sale in Eastleigh, Hampshire
House Prices in Eastleigh
Properties in Eastleigh have an average house price of £369k and had 3,417 Property Transactions within the last 3 years.¹
Eastleigh is an area in Hampshire with 34,617 households², where the most expensive property was sold for £2M.
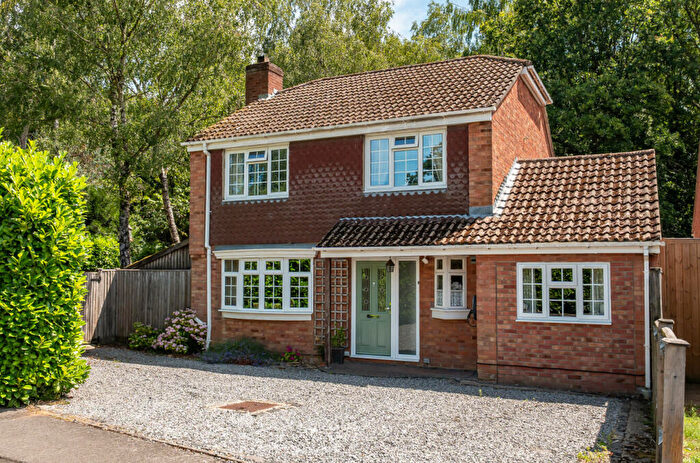
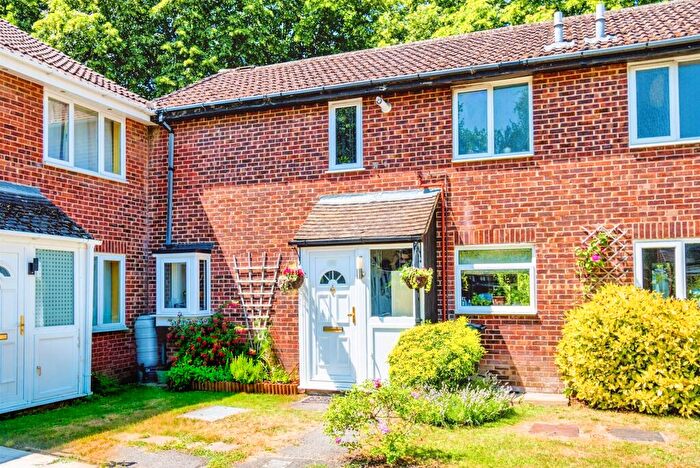
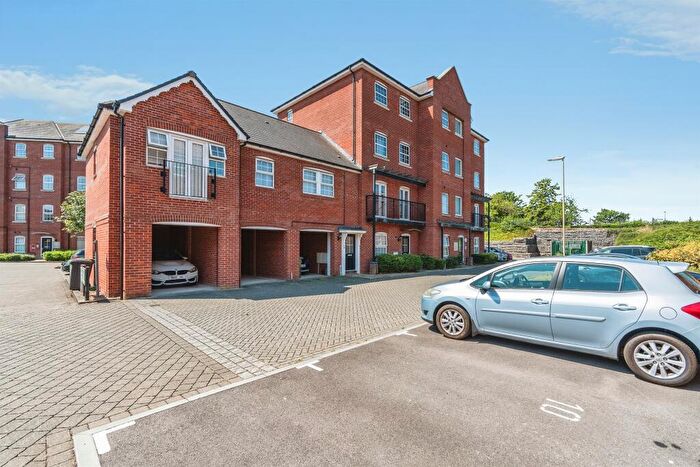
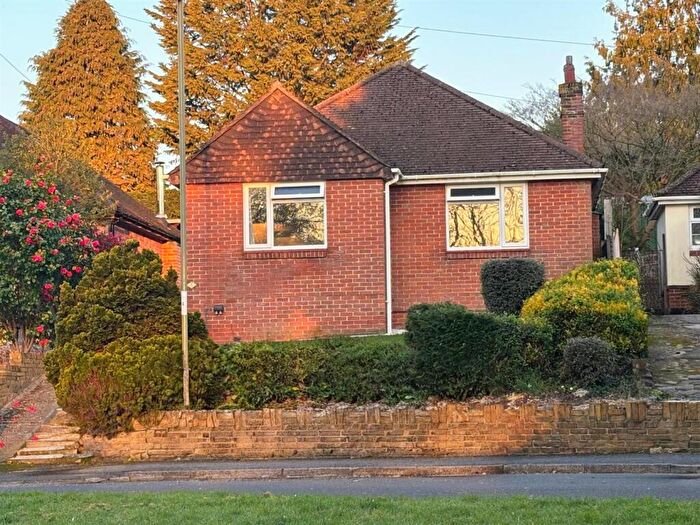
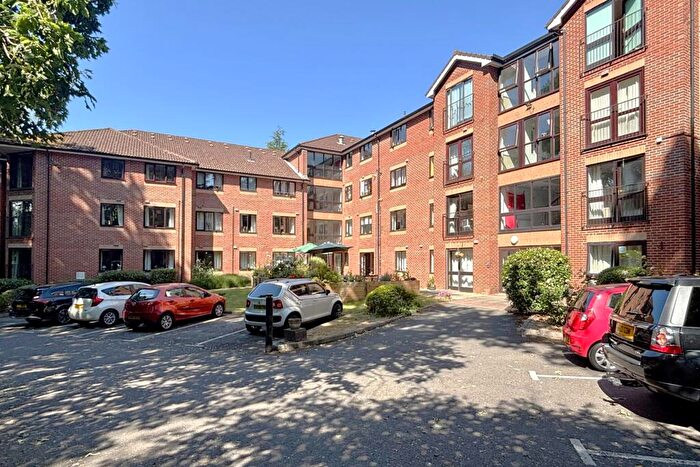
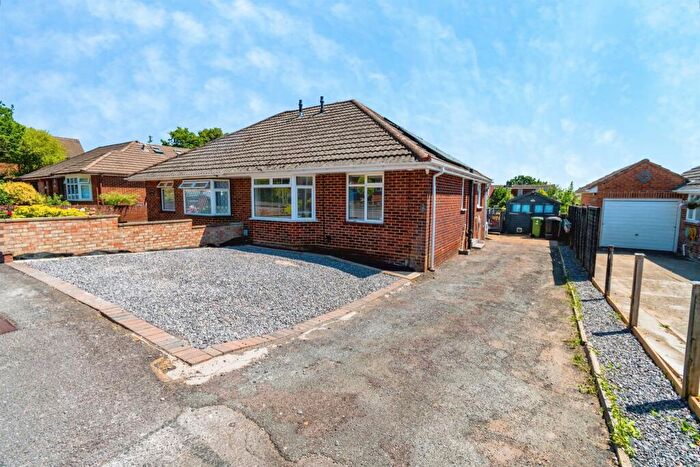
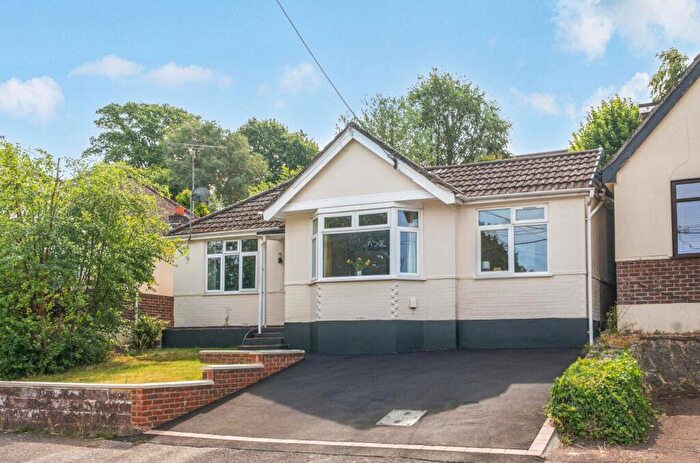
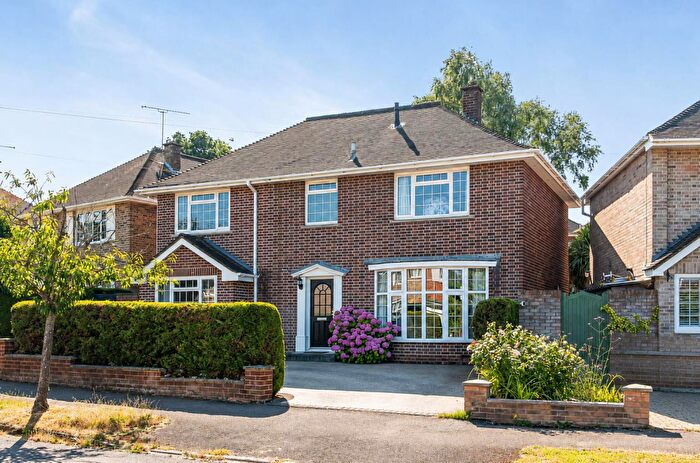
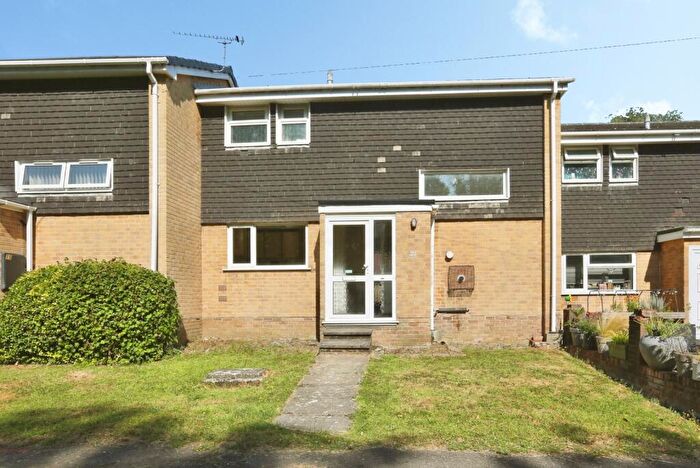
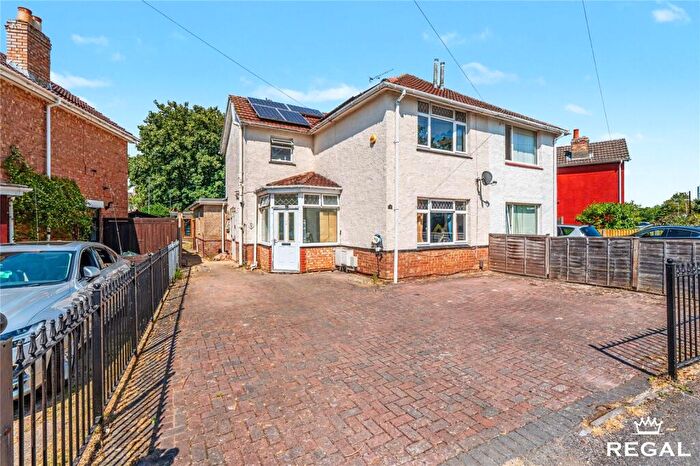
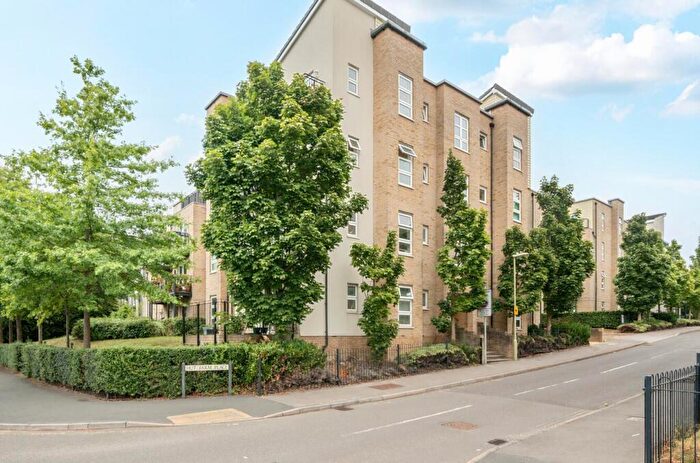
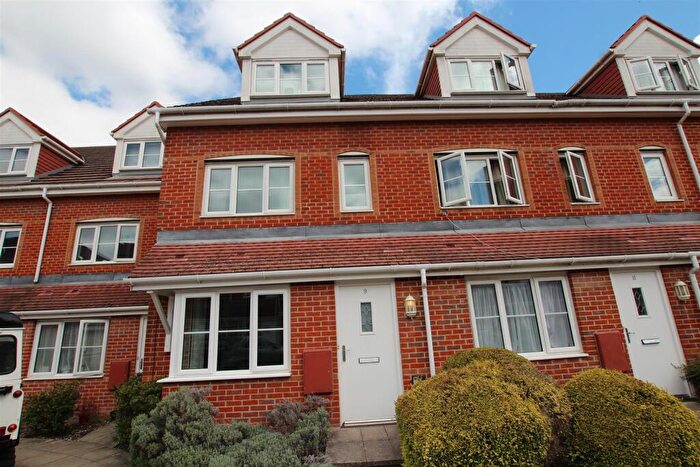
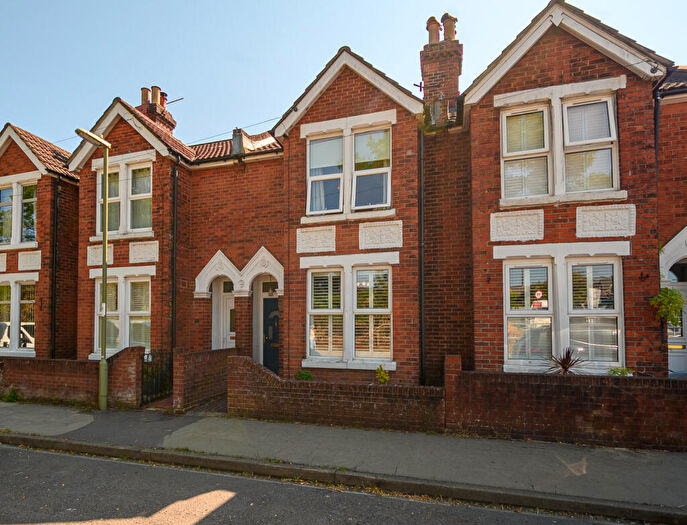
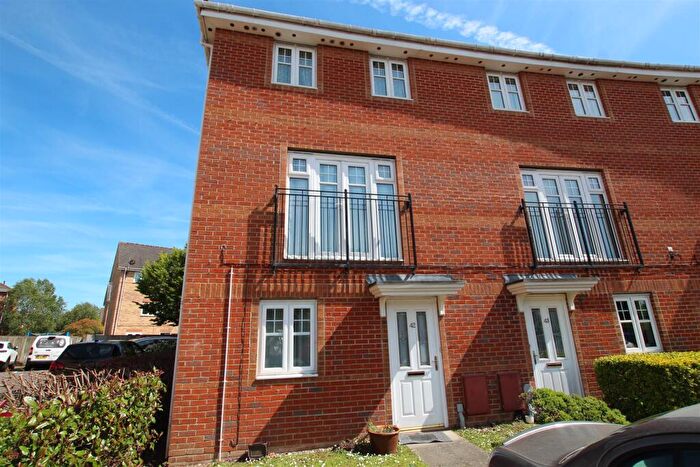
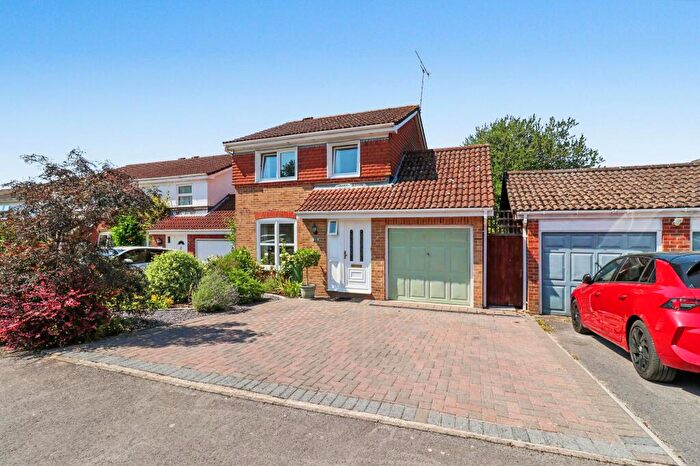
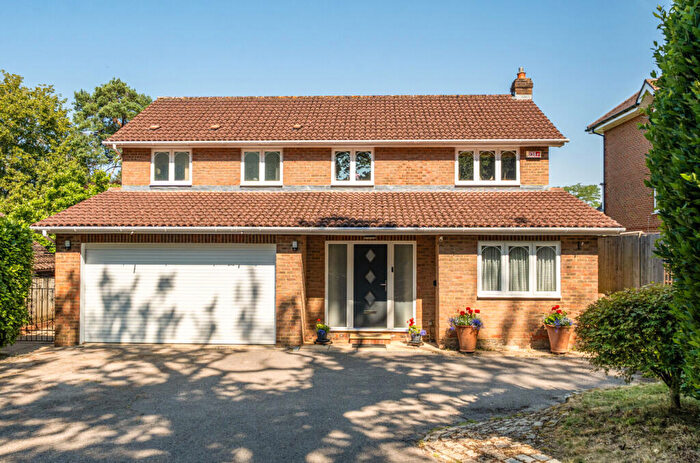
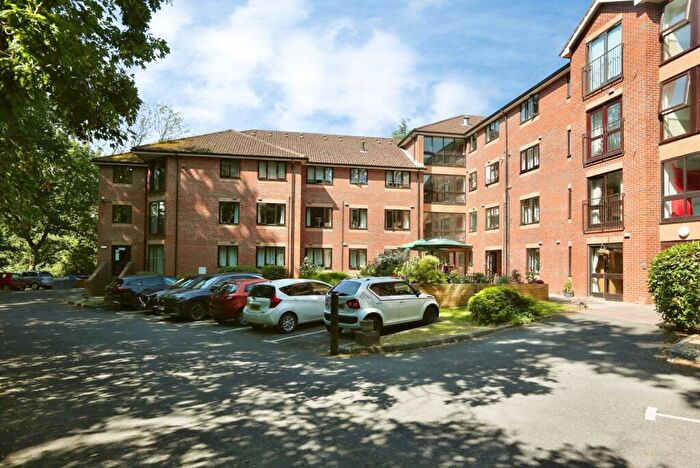
Properties for sale in Eastleigh

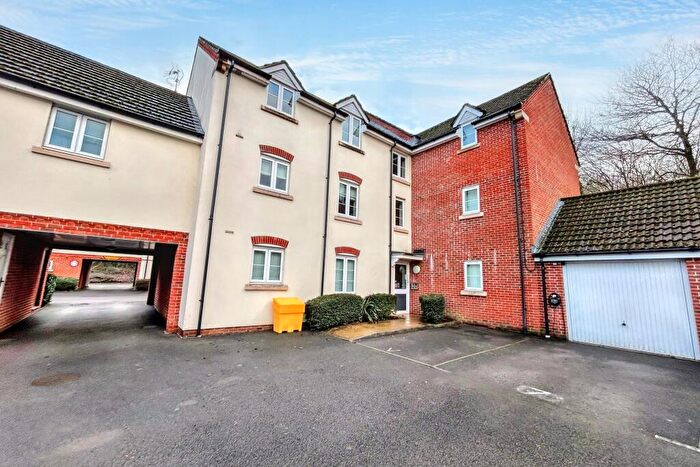
![]()
If you are looking to sell your house, let it out, or receive a property valuation, an expert can help you.
Click the button below to get started.
Neighbourhoods in Eastleigh
Navigate through our locations to find the location of your next house in Eastleigh, Hampshire for sale or to rent.
- Ampfield And Braishfield
- Bishopstoke East
- Bishopstoke West
- Chandlers Ford East
- Chandlers Ford West
- Colden Common And Twyford
- Compton And Otterbourne
- Eastleigh Central
- Eastleigh North
- Eastleigh South
- Fair Oak And Horton Heath
- Hiltingbury East
- Hiltingbury West
- Valley Park
- West End North
- Badger Farm and Oliver's Battery
- Bishopstoke
- Fair Oak & Horton Heath
- Chilworth, Nursling & Rownhams
- Chandler's Ford
- Hiltingbury
Property price trends in Eastleigh
According to the latest Land Registry data, the average home in Eastleigh sold for £361,697 in 2026. That figure comes from a substantial record of 46,786 sales logged over the past 31 years.
Prices have softened over the last three years. Compared with 2023, when the typical sale came in around £371,956, that's a fall of roughly 2.8%.
Looking back five years, average prices are up about 1.9% since 2021, a gain of around £6,842 in cash terms.
Zoom out to the past decade for the fuller picture. Back in 2016, homes here averaged £297,278, so the typical sold price has climbed about 21.7% since then, roughly 2% a year. Stretch the view to fifteen years and that annual pace edges up closer to 2.9%.
Frequently asked questions about Eastleigh
What is the average price for a property for sale in Eastleigh?
The average price for a property for sale in Eastleigh is £368,655. This amount is 12% lower than the average price in Hampshire. There are more than 10,000 property listings for sale in Eastleigh.
What locations have the most expensive properties for sale in Eastleigh?
The locations with the most expensive properties for sale in Eastleigh are Compton And Otterbourne at an average of £970,166, Ampfield And Braishfield at an average of £582,795 and Hiltingbury East at an average of £582,381.
What locations have the most affordable properties for sale in Eastleigh?
The locations with the most affordable properties for sale in Eastleigh are Eastleigh Central at an average of £249,530, Eastleigh South at an average of £307,456 and Eastleigh North at an average of £330,857.
Which train stations are available in or near Eastleigh?
Some of the train stations available in or near Eastleigh are Eastleigh, Chandlers Ford and Southampton Airport (Parkway).
Property Price Paid in Eastleigh by Year
The average sold property price by year was:
| Year | Average Sold Price | Price Change |
Sold Properties
|
|---|---|---|---|
| 2026 | £361,697 | -2% |
100 Properties |
| 2025 | £370,325 | 2% |
1,125 Properties |
| 2024 | £364,488 | -2% |
1,127 Properties |
| 2023 | £371,956 | 0,4% |
1,065 Properties |
| 2022 | £370,563 | 4% |
1,316 Properties |
| 2021 | £354,855 | 7% |
1,746 Properties |
| 2020 | £331,203 | 2% |
1,249 Properties |
| 2019 | £325,055 | 3% |
1,386 Properties |
| 2018 | £313,780 | -3% |
1,421 Properties |
| 2017 | £324,241 | 8% |
1,570 Properties |
Property Price per Property Type in Eastleigh
Here you can find historic sold price data in order to help with your property search.
The average Property Paid Price for specific property types in the last three years are:
| Property Type | Average Sold Price | Sold Properties |
|---|---|---|
| Semi Detached House | £352,568.00 | 785 Semi Detached Houses |
| Terraced House | £299,246.00 | 921 Terraced Houses |
| Detached House | £548,232.00 | 1,047 Detached Houses |
| Flat | £200,791.00 | 664 Flats |
Transport in Eastleigh
Please see below transportation links in this area:
