
Houses for sale & to rent in Fareham East, Fareham
House Prices in Fareham East
Properties in Fareham East have an average house price of £301k and had 379 Property Transactions within the last 3 years¹.
Fareham East is an area in Fareham, Hampshire with 3,166 households², where the most expensive property was sold for £1.25M.
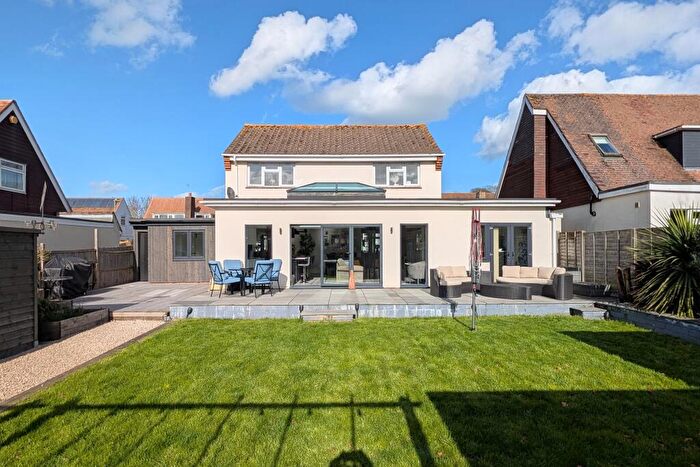
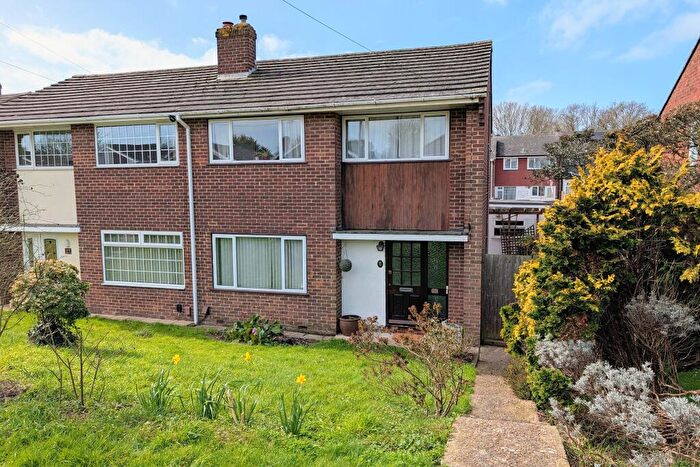
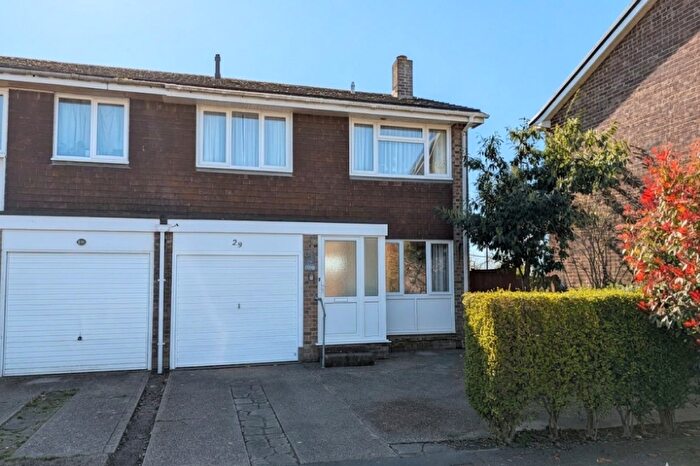
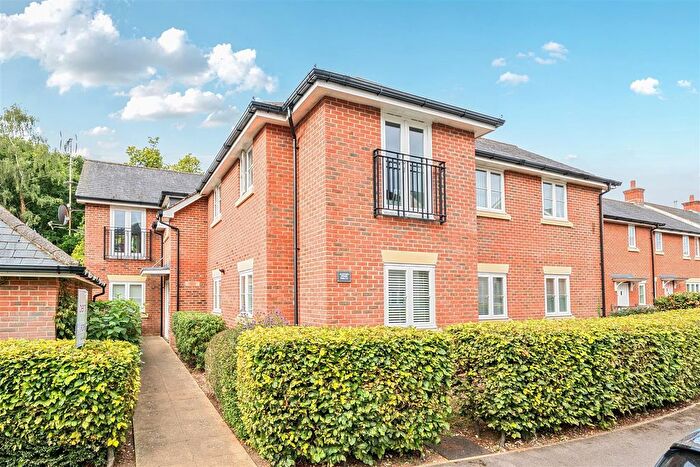
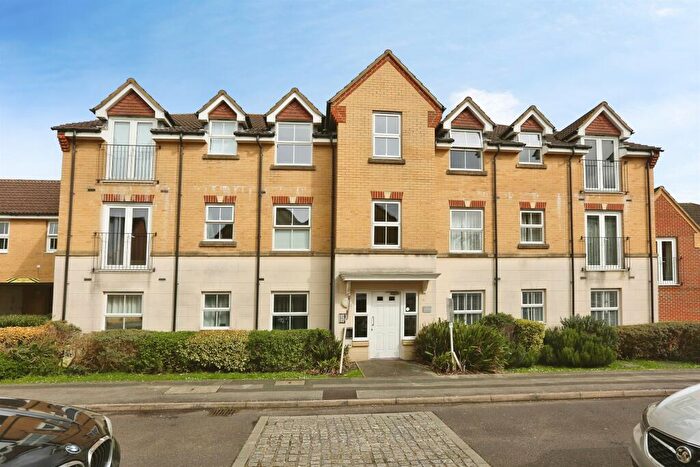
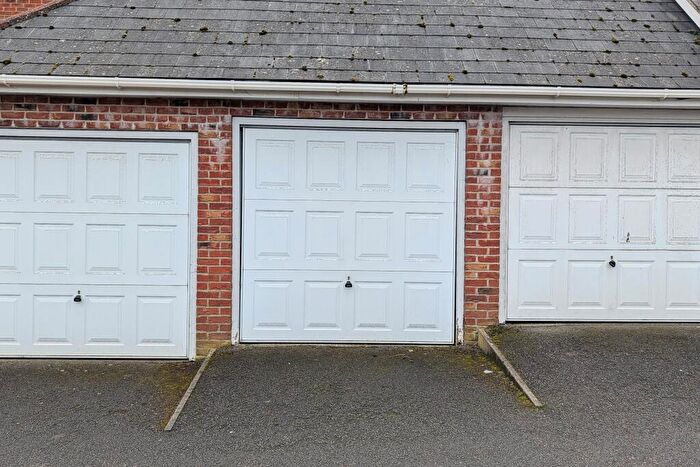
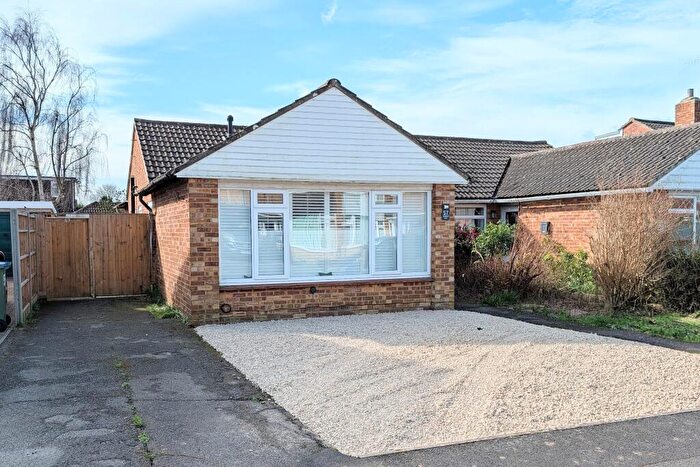
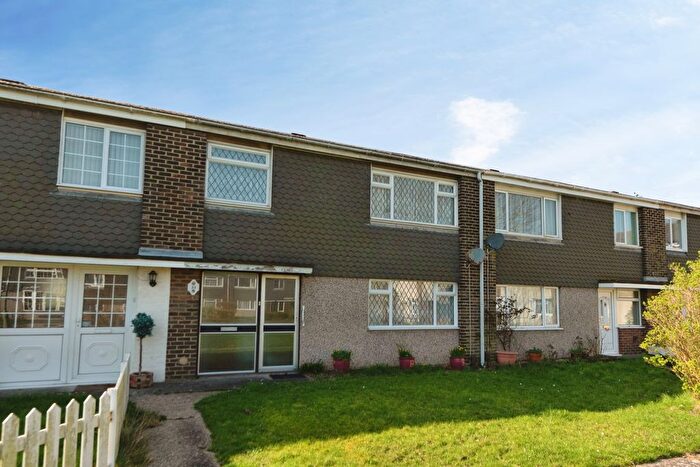
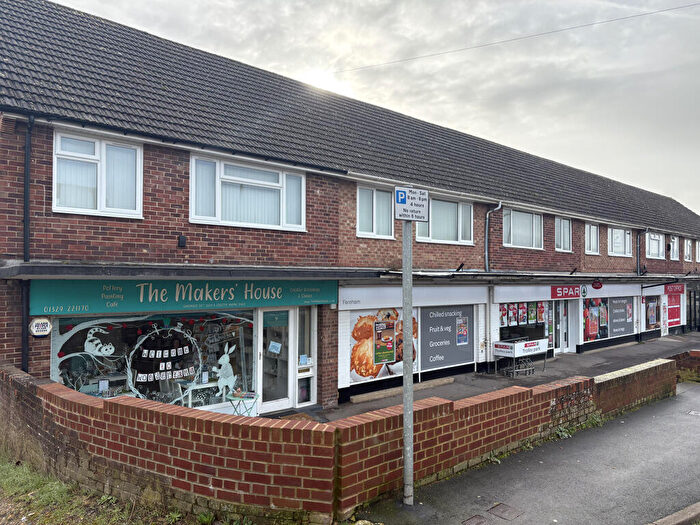
Properties for sale in Fareham East


![]()
If you are looking to sell your house, let it out, or receive a property valuation, an expert can help you.
Click the button below to get started.


Roads and Postcodes in Fareham East
Navigate through our locations to find the location of your next house in Fareham East, Fareham for sale or to rent.
Transport near Fareham East

- FAQ
- Price Paid By Year
- Property Type Price
Frequently asked questions about Fareham East
What is the average price for a property for sale in Fareham East?
The average price for a property for sale in Fareham East is £300,922. This amount is 17% lower than the average price in Fareham. There are 6,319 property listings for sale in Fareham East.
What streets have the most expensive properties for sale in Fareham East?
The streets with the most expensive properties for sale in Fareham East are Forest Lane at an average of £1,072,500, Bridgefoot Drive at an average of £726,000 and Delme Drive at an average of £718,000.
What streets have the most affordable properties for sale in Fareham East?
The streets with the most affordable properties for sale in Fareham East are Westbury Road at an average of £130,826, Trinity Street at an average of £151,428 and Northwood Square at an average of £162,000.
Which train stations are available in or near Fareham East?
Some of the train stations available in or near Fareham East are Fareham, Portchester and Swanwick.
Property Price Paid in Fareham East by Year
The average sold property price by year was:
| Year | Average Sold Price | Price Change |
Sold Properties
|
|---|---|---|---|
| 2025 | £320,246 | 6% |
113 Properties |
| 2024 | £300,834 | 6% |
137 Properties |
| 2023 | £284,086 | -5% |
129 Properties |
| 2022 | £299,332 | -4% |
156 Properties |
| 2021 | £311,325 | -2% |
196 Properties |
| 2020 | £317,387 | 18% |
110 Properties |
| 2019 | £258,795 | 0,1% |
189 Properties |
| 2018 | £258,420 | -6% |
179 Properties |
| 2017 | £272,669 | 16% |
165 Properties |
| 2016 | £229,751 | 6% |
205 Properties |
| 2015 | £215,473 | -6% |
214 Properties |
| 2014 | £227,949 | 12% |
166 Properties |
| 2013 | £201,565 | -7% |
136 Properties |
| 2012 | £215,982 | 2% |
94 Properties |
| 2011 | £211,701 | 2% |
108 Properties |
| 2010 | £208,032 | 4% |
107 Properties |
| 2009 | £200,523 | -2% |
92 Properties |
| 2008 | £204,966 | 2% |
106 Properties |
| 2007 | £200,949 | -1% |
218 Properties |
| 2006 | £203,640 | 6% |
252 Properties |
| 2005 | £190,899 | -2% |
189 Properties |
| 2004 | £195,380 | 11% |
168 Properties |
| 2003 | £174,077 | 11% |
175 Properties |
| 2002 | £155,248 | 14% |
194 Properties |
| 2001 | £133,185 | 18% |
209 Properties |
| 2000 | £109,289 | 10% |
188 Properties |
| 1999 | £97,864 | -1% |
273 Properties |
| 1998 | £98,582 | 7% |
244 Properties |
| 1997 | £91,227 | 11% |
240 Properties |
| 1996 | £81,304 | 12% |
184 Properties |
| 1995 | £71,609 | - |
136 Properties |
Property Price per Property Type in Fareham East
Here you can find historic sold price data in order to help with your property search.
The average Property Paid Price for specific property types in the last three years are:
| Property Type | Average Sold Price | Sold Properties |
|---|---|---|
| Flat | £157,743.00 | 140 Flats |
| Semi Detached House | £341,144.00 | 85 Semi Detached Houses |
| Detached House | £514,666.00 | 72 Detached Houses |
| Terraced House | £316,000.00 | 82 Terraced Houses |