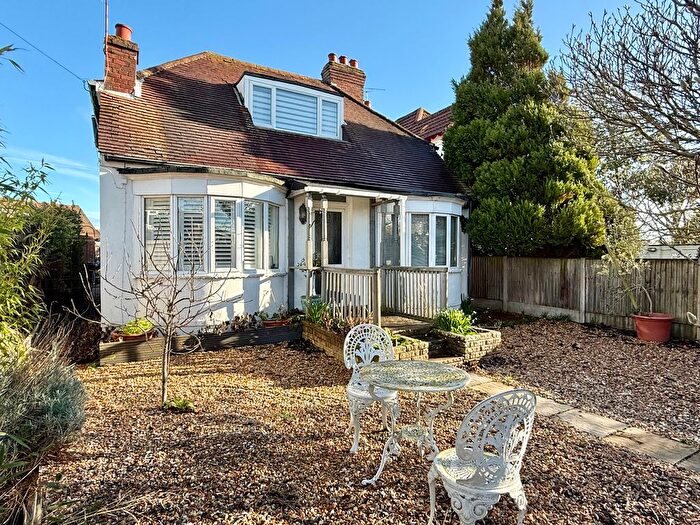
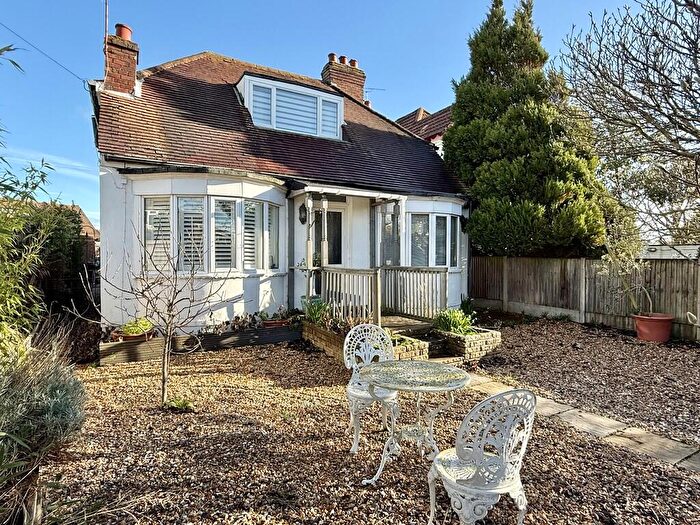
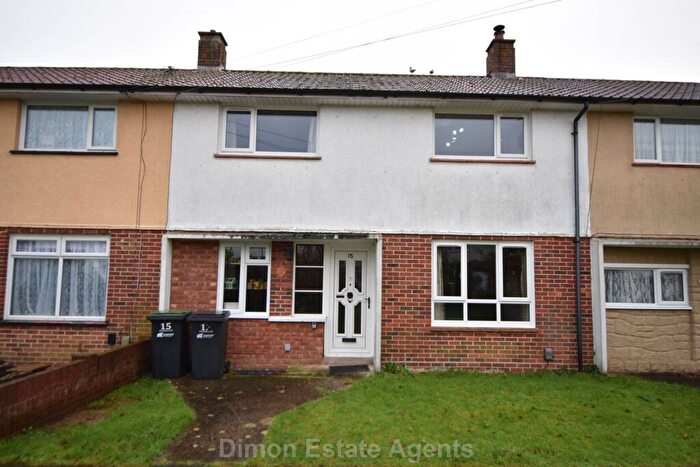
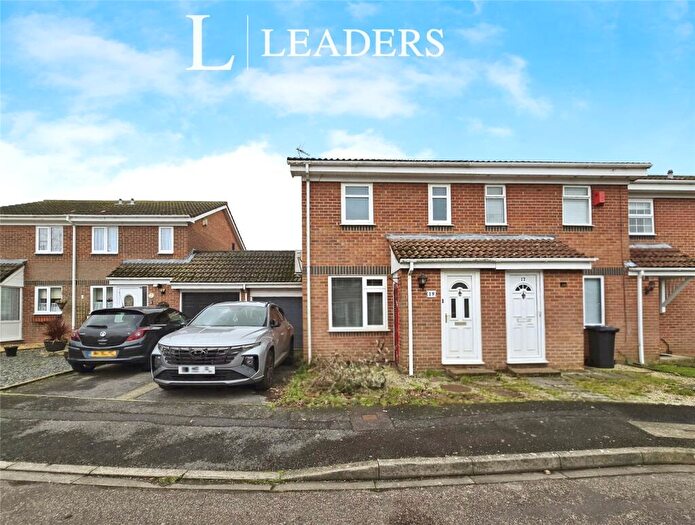
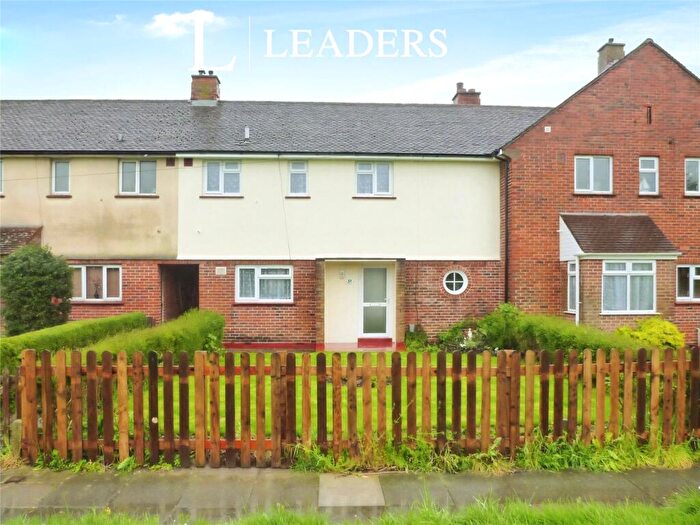
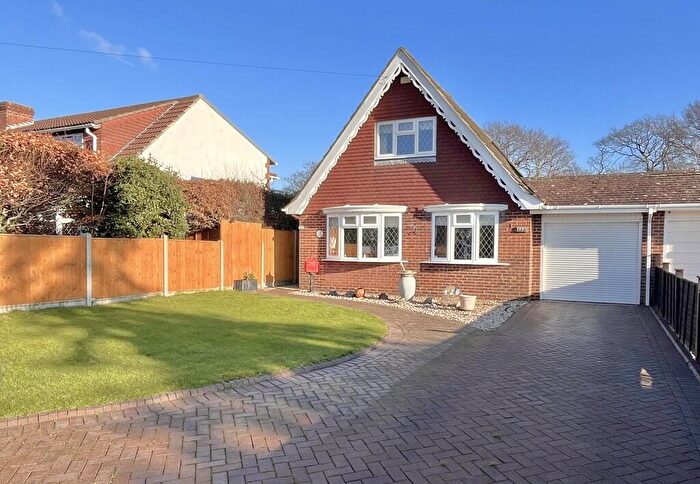
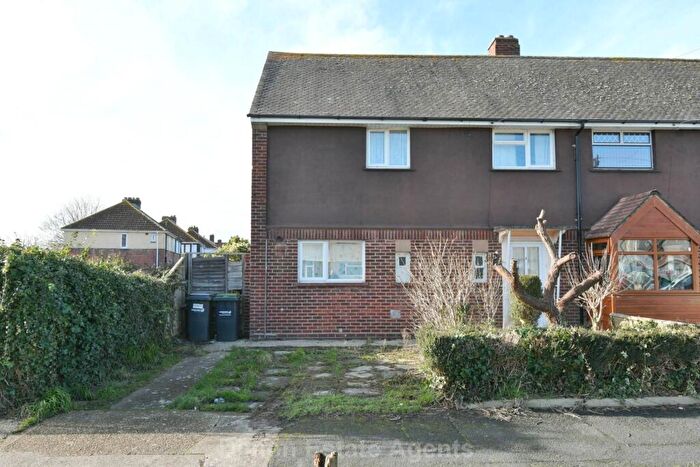
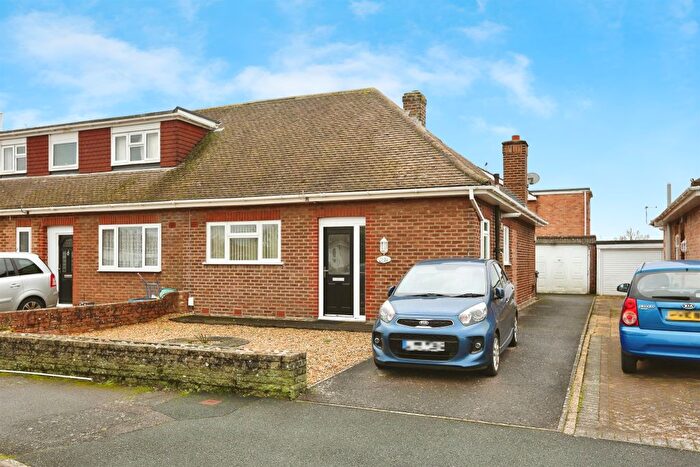
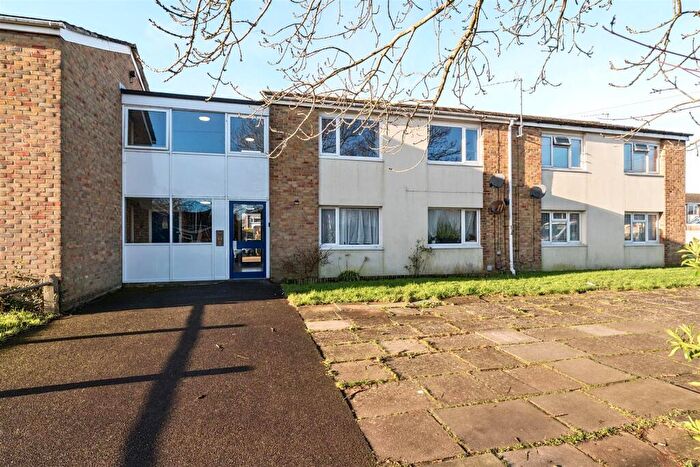
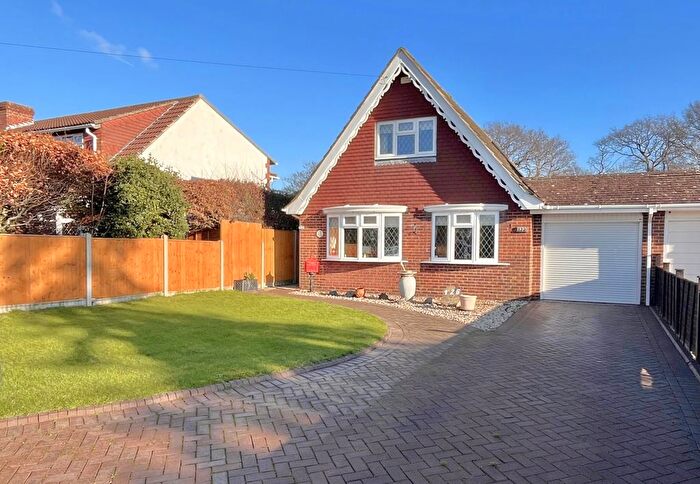
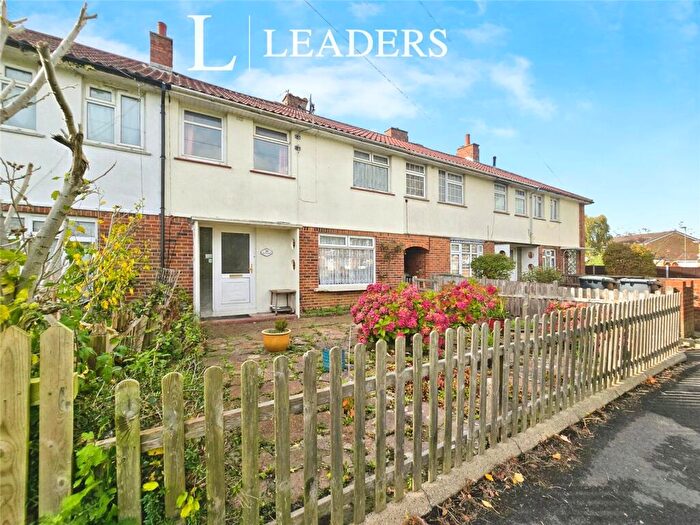
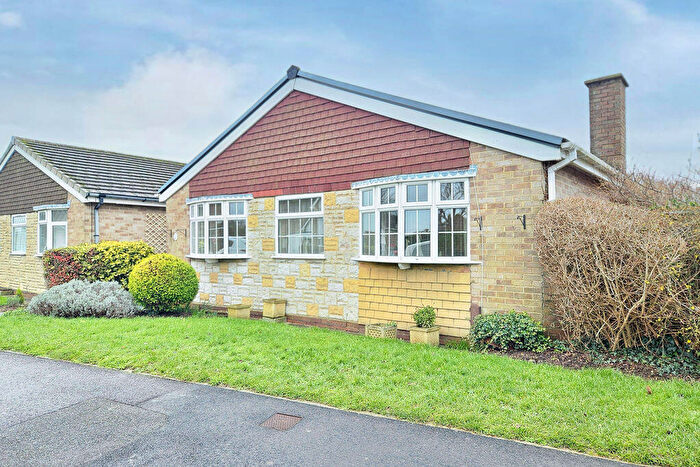
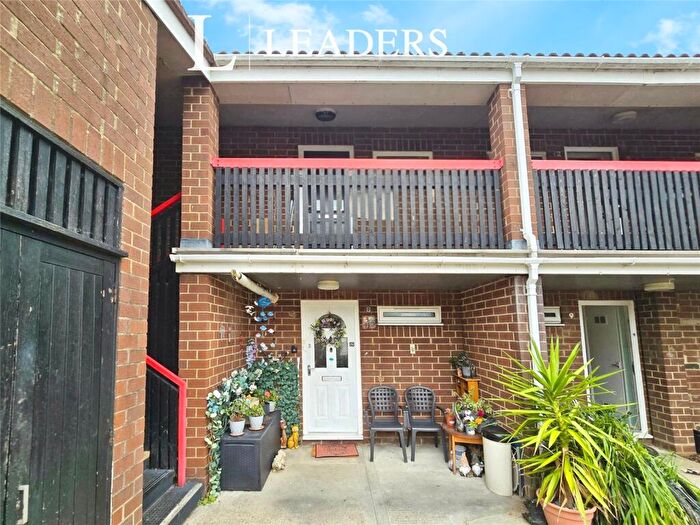
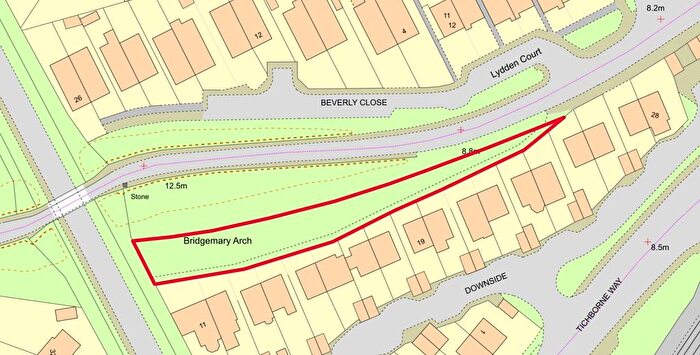
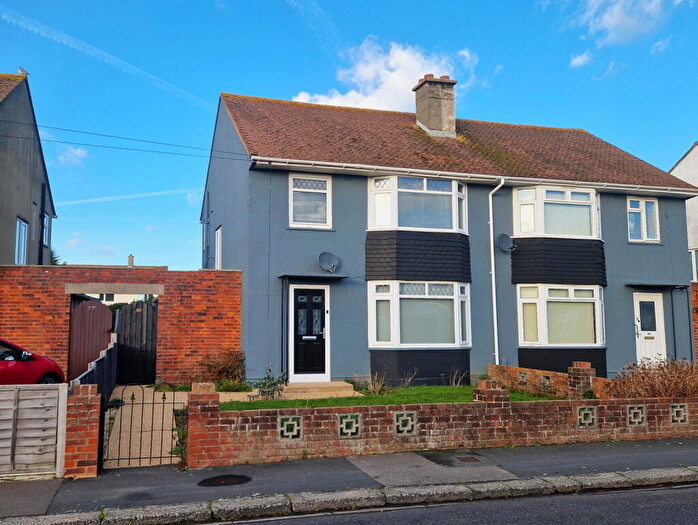
Houses for sale & to rent in Bridgemary South, Gosport
House Prices in Bridgemary South
Properties in Bridgemary South have an average house price of £258,949.00 and had 110 Property Transactions within the last 3 years¹.
Bridgemary South is an area in Gosport, Hampshire with 1,933 households², where the most expensive property was sold for £380,000.00.
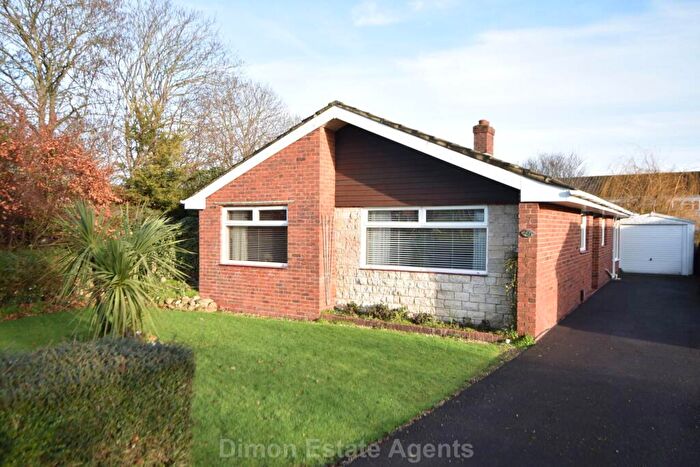
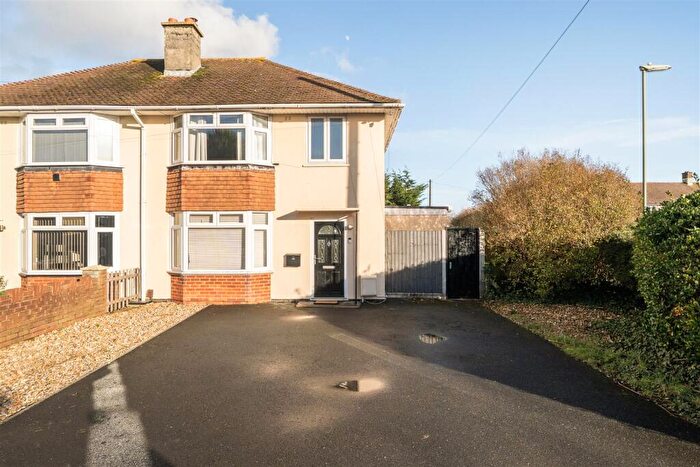
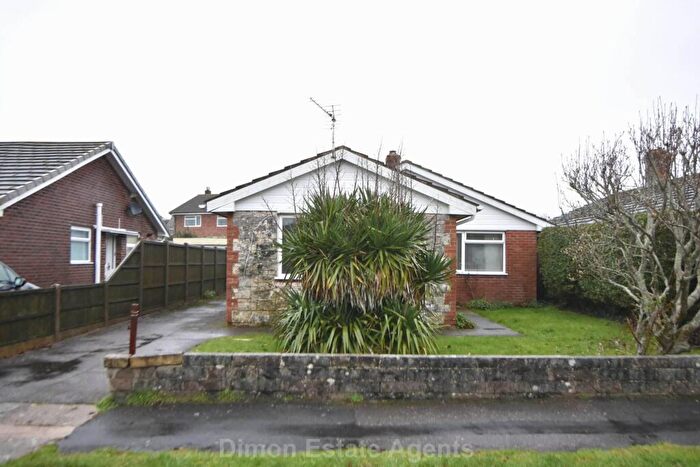
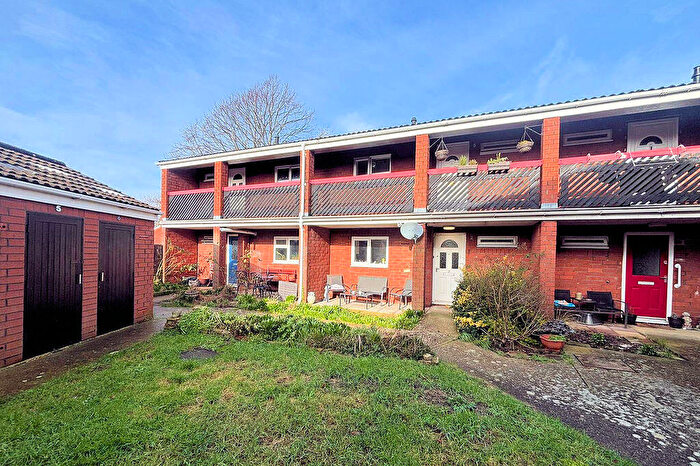
Properties for sale in Bridgemary South
Roads and Postcodes in Bridgemary South
Navigate through our locations to find the location of your next house in Bridgemary South, Gosport for sale or to rent.
| Streets | Postcodes |
|---|---|
| Acorn Close | PO13 0DA |
| Aerodrome Road | PO13 0FG PO13 0FJ PO13 0FQ PO13 0GW PO13 0GY |
| Agnew Road | PO13 0JD |
| Balmoral Close | PO13 0XJ |
| Beauchamp Avenue | PO13 0LG PO13 0LH PO13 0LQ PO13 0LJ PO13 0PU |
| Bedenham Lane | PO13 0LW |
| Beverly Close | PO13 0LB |
| Braemar Close | PO13 0YE |
| Braemar Road | PO13 0XY PO13 0XZ PO13 0YA PO13 0YB |
| Brewers Lane | PO13 0JU PO13 0JX PO13 0JY PO13 0JZ PO13 0LA PO13 0LD |
| Bridgemary Avenue | PO13 0XS PO13 0XT |
| Cameron Close | PO13 0JE |
| Camp Road | PO13 0XU |
| Copse Lane | PO13 0DH |
| Cunningham Drive | PO13 0YF PO13 0YJ |
| Downside | PO13 0JS PO13 0JT |
| Duncton Way | PO13 0FD |
| Fareham Road | PO13 0AG PO13 0XL PO13 0XN PO13 0BB |
| Fisher Road | PO13 0JJ |
| Founders Way | PO13 0LR |
| Gorselands Way | PO13 0DG PO13 0EA |
| Green Crescent | PO13 0DL PO13 0DN PO13 0DP PO13 0DS PO13 0DW |
| Gregson Avenue | PO13 0HP PO13 0HR PO13 0PJ PO13 0UP PO13 0UR PO13 0UX PO13 0UU |
| Hardy Close | PO13 0JW |
| Harman Road | PO13 0BD |
| Harris Road | PO13 0UY |
| Hawkins Road | PO13 0LE |
| Holland Place | PO13 0LL |
| Horton Road | PO13 0XA |
| Jacomb Place | PO13 0LS |
| Keyes Close | PO13 0JB |
| Keyes Road | PO13 0HZ PO13 0JA |
| Layton Road | PO13 0JG PO13 0JQ |
| Lerryn Road | PO13 0YG |
| Montgomery Road | PO13 0UZ |
| Nicholl Place | PO13 0LN |
| Nobes Avenue | PO13 0HS PO13 0HT PO13 0HU PO13 0HX PO13 0HY |
| Nobes Close | PO13 0JL |
| Perth Road | PO13 0XX |
| Phoenix Way | PO13 0BE |
| Portal Road | PO13 0JH |
| Ramsay Place | PO13 0LP |
| Rosemary Terrace | PO13 0GN |
| Rowner Close | PO13 0LY |
| Rowner Road | PO13 9UF |
| Southway | PO13 0XB PO13 0XD |
| Stocker Place | PO13 0LT PO13 0NA |
| Tait Place | PO13 0LX |
| Tarius Close | PO13 0NJ |
| Tedder Road | PO13 0XP |
| The Spinney | PO13 0DJ |
| Thyme Close | PO13 0GP |
| Venture Industrial Park | PO13 0BA |
| Walker Place | PO13 0LU |
| Wavell Road | PO13 0XR |
| Wych Lane | PO13 0JN PO13 0NL |
Transport near Bridgemary South
-
Fareham Station
-
Portchester Station
-
Portsmouth Harbour Station
-
Portsmouth and Southsea Station
-
Fratton Station
-
Cosham Station
-
Hilsea Station
- FAQ
- Price Paid By Year
- Property Type Price
Frequently asked questions about Bridgemary South
What is the average price for a property for sale in Bridgemary South?
The average price for a property for sale in Bridgemary South is £258,949. This amount is 5% higher than the average price in Gosport. There are 1,167 property listings for sale in Bridgemary South.
What streets have the most expensive properties for sale in Bridgemary South?
The streets with the most expensive properties for sale in Bridgemary South are Balmoral Close at an average of £393,748, Nicholl Place at an average of £340,000 and Perth Road at an average of £331,872.
What streets have the most affordable properties for sale in Bridgemary South?
The streets with the most affordable properties for sale in Bridgemary South are Hardy Close at an average of £87,500, Braemar Road at an average of £202,937 and Gorselands Way at an average of £210,000.
Which train stations are available in or near Bridgemary South?
Some of the train stations available in or near Bridgemary South are Fareham, Portchester and Portsmouth Harbour.
Property Price Paid in Bridgemary South by Year
The average sold property price by year was:
| Year | Average Sold Price | Price Change |
Sold Properties
|
|---|---|---|---|
| 2025 | £280,017 | 14% |
28 Properties |
| 2024 | £239,789 | -11% |
45 Properties |
| 2023 | £266,308 | 1% |
37 Properties |
| 2022 | £262,524 | 14% |
45 Properties |
| 2021 | £226,535 | 3% |
56 Properties |
| 2020 | £219,760 | 5% |
47 Properties |
| 2019 | £209,396 | 2% |
54 Properties |
| 2018 | £204,974 | 2% |
52 Properties |
| 2017 | £200,110 | 3% |
50 Properties |
| 2016 | £194,646 | 10% |
60 Properties |
| 2015 | £174,737 | 5% |
74 Properties |
| 2014 | £165,711 | 10% |
62 Properties |
| 2013 | £149,773 | 0,2% |
53 Properties |
| 2012 | £149,452 | 4% |
43 Properties |
| 2011 | £143,101 | -2% |
37 Properties |
| 2010 | £145,531 | 7% |
33 Properties |
| 2009 | £134,852 | -6% |
34 Properties |
| 2008 | £142,538 | -3% |
39 Properties |
| 2007 | £147,364 | 11% |
99 Properties |
| 2006 | £130,681 | -2% |
87 Properties |
| 2005 | £133,446 | - |
59 Properties |
| 2004 | £133,452 | 11% |
65 Properties |
| 2003 | £118,562 | 13% |
63 Properties |
| 2002 | £103,027 | 26% |
96 Properties |
| 2001 | £75,877 | 2% |
64 Properties |
| 2000 | £74,703 | 20% |
63 Properties |
| 1999 | £59,670 | 6% |
83 Properties |
| 1998 | £55,931 | 8% |
55 Properties |
| 1997 | £51,488 | 8% |
64 Properties |
| 1996 | £47,402 | -2% |
57 Properties |
| 1995 | £48,193 | - |
37 Properties |
Property Price per Property Type in Bridgemary South
Here you can find historic sold price data in order to help with your property search.
The average Property Paid Price for specific property types in the last three years are:
| Property Type | Average Sold Price | Sold Properties |
|---|---|---|
| Semi Detached House | £267,300.00 | 73 Semi Detached Houses |
| Detached House | £311,000.00 | 9 Detached Houses |
| Terraced House | £245,295.00 | 22 Terraced Houses |
| Flat | £129,333.00 | 6 Flats |

