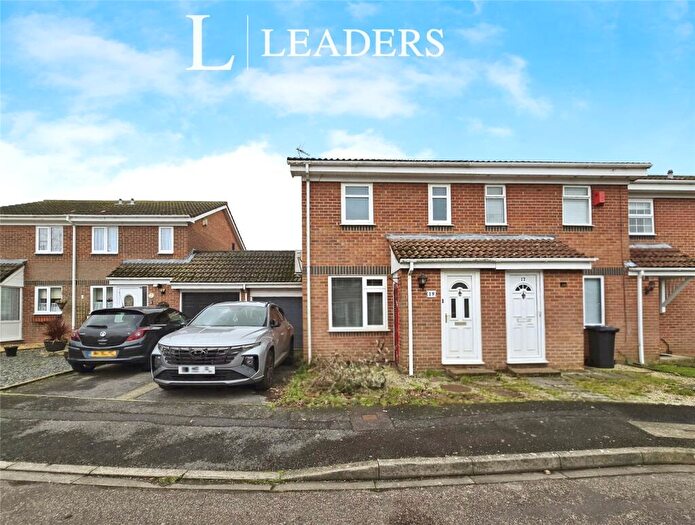
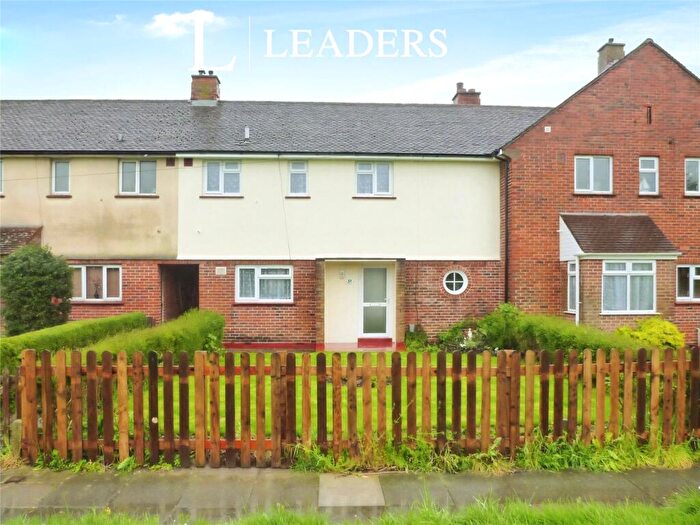
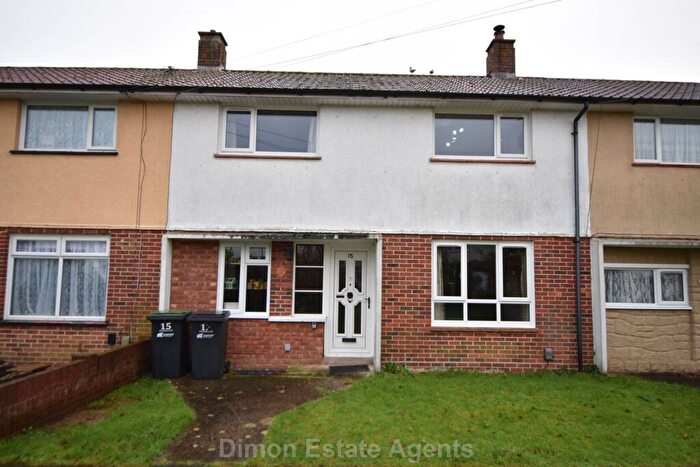
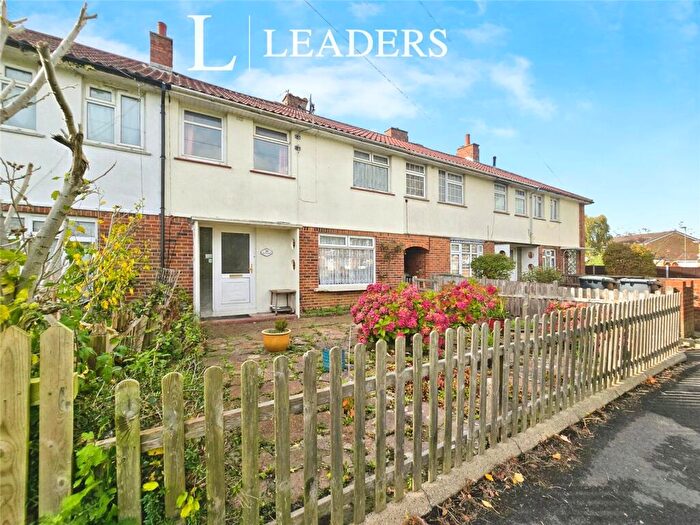
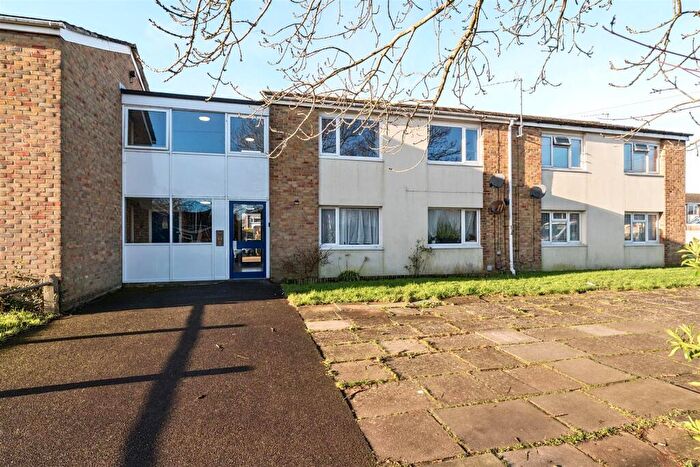
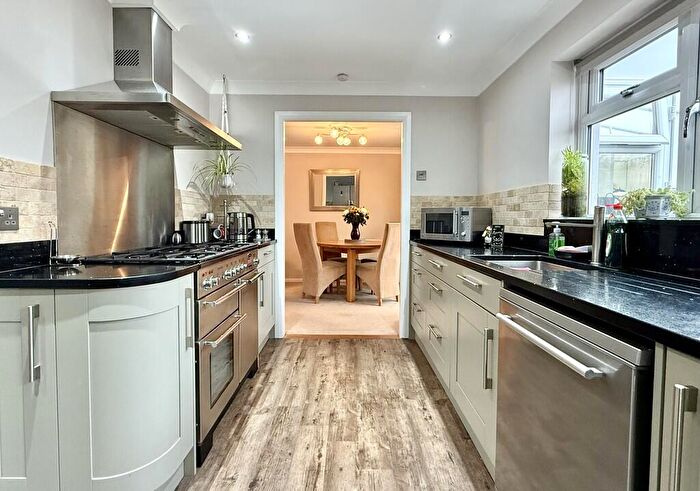
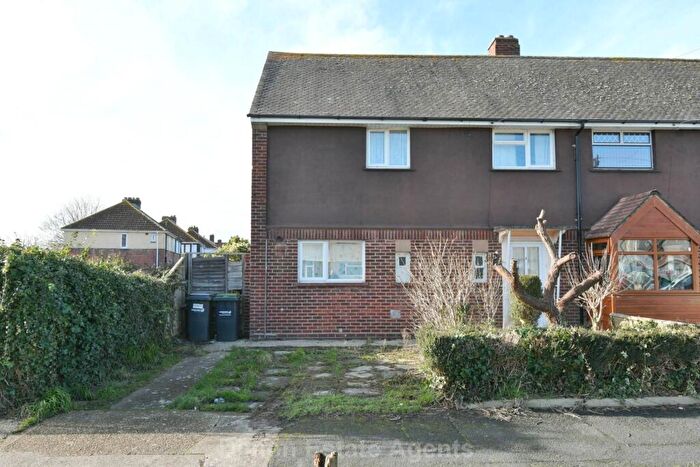
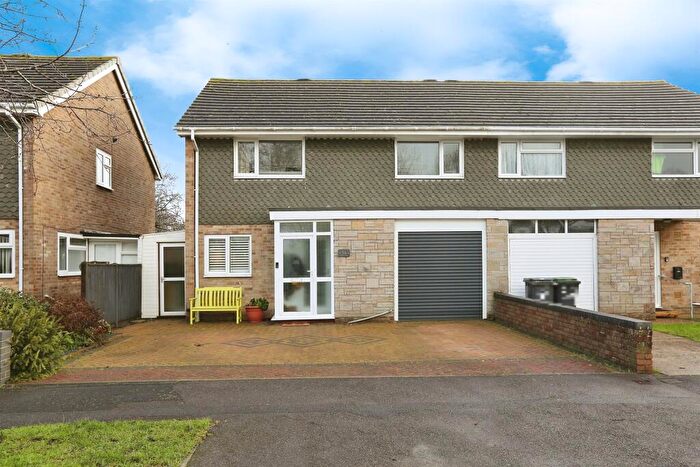
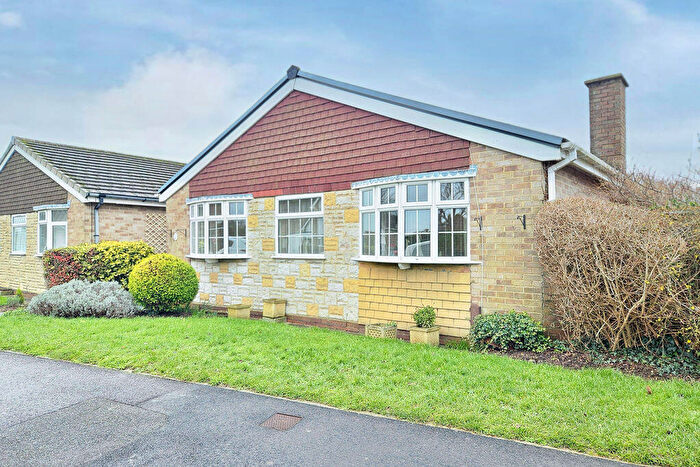
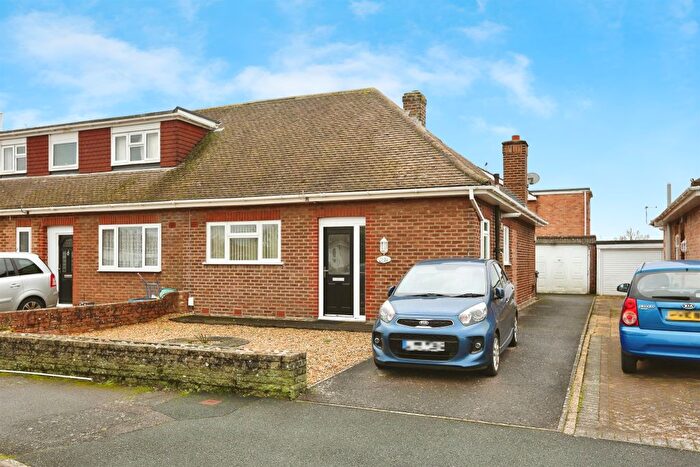
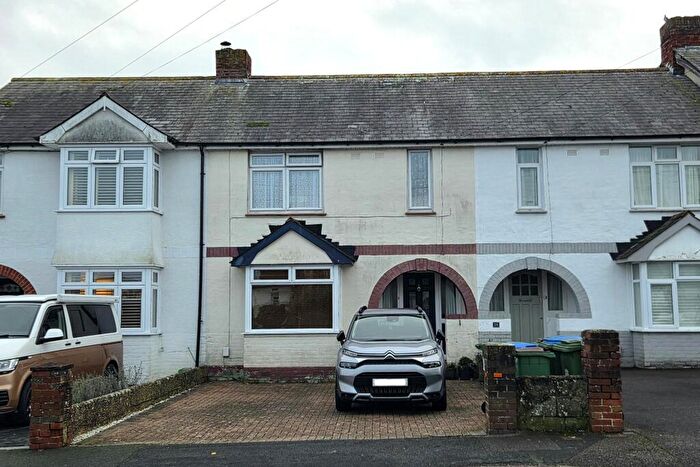
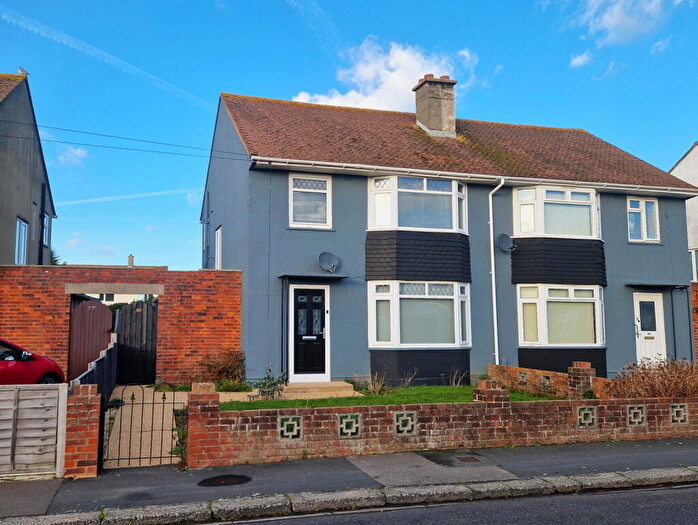
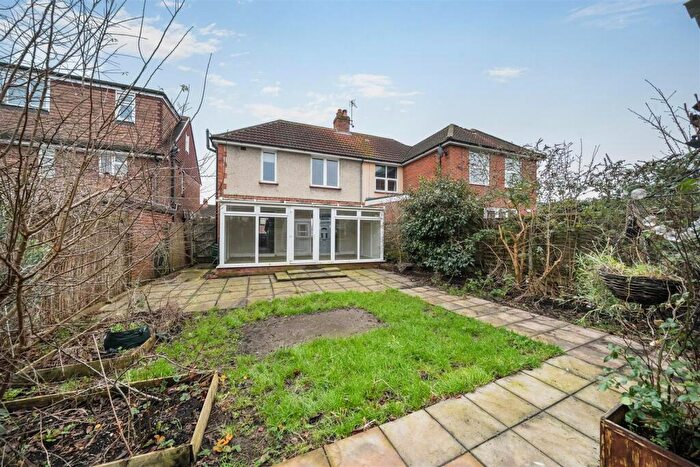
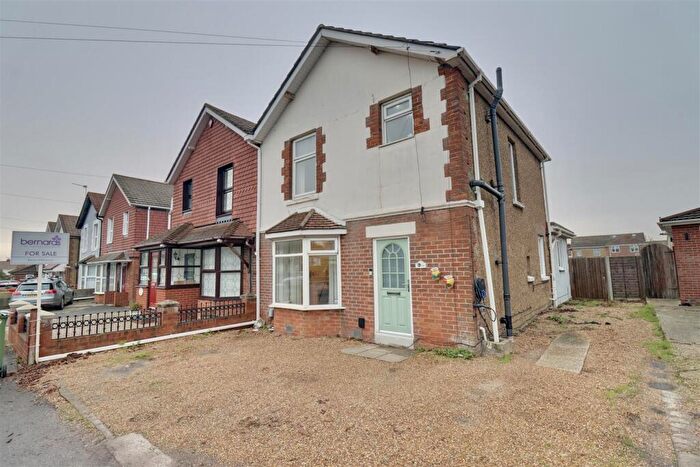
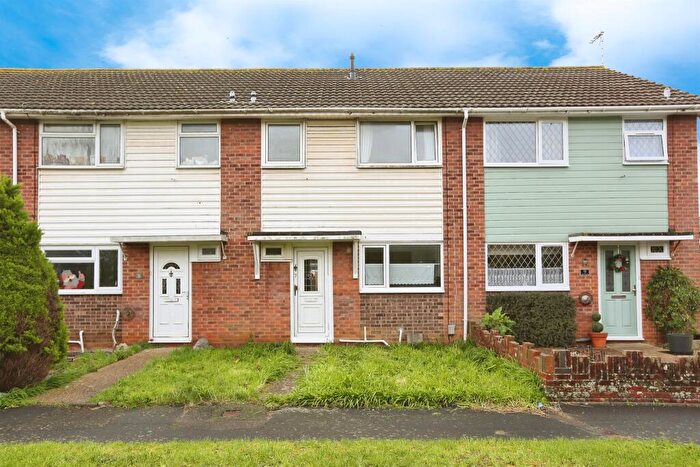
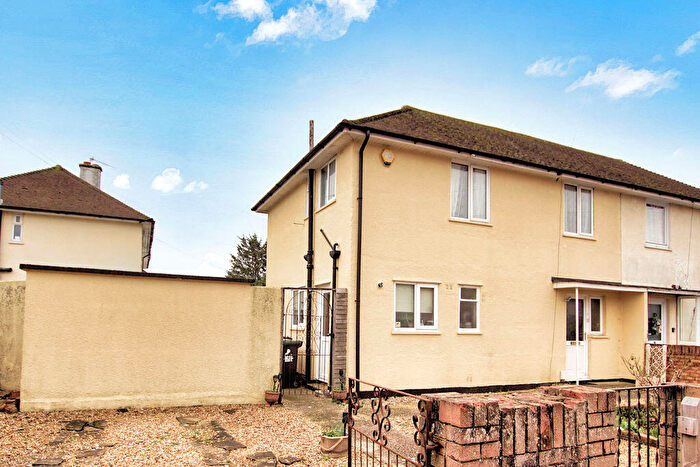
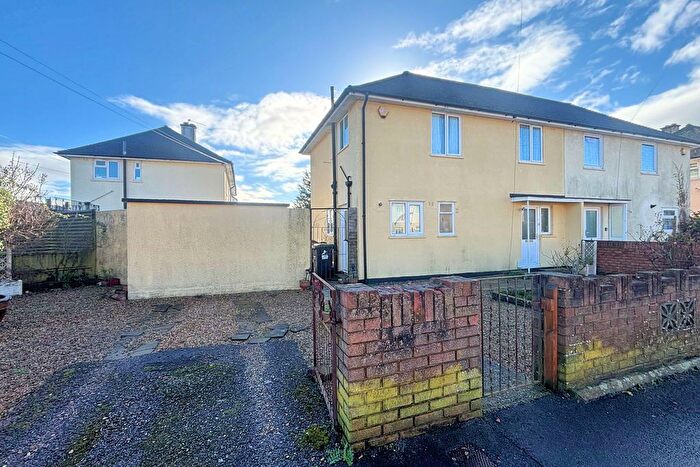
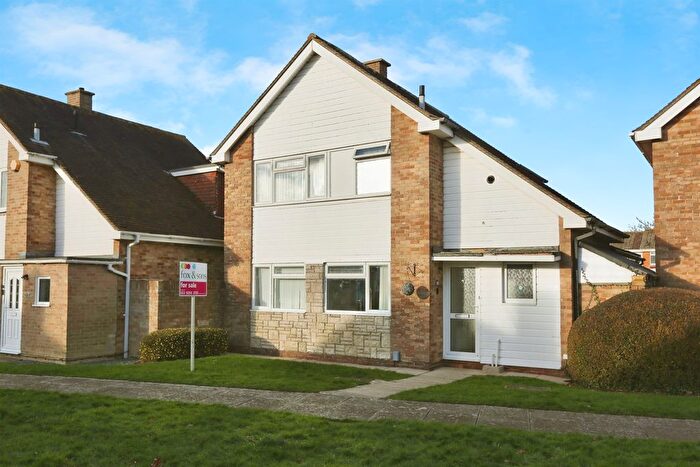
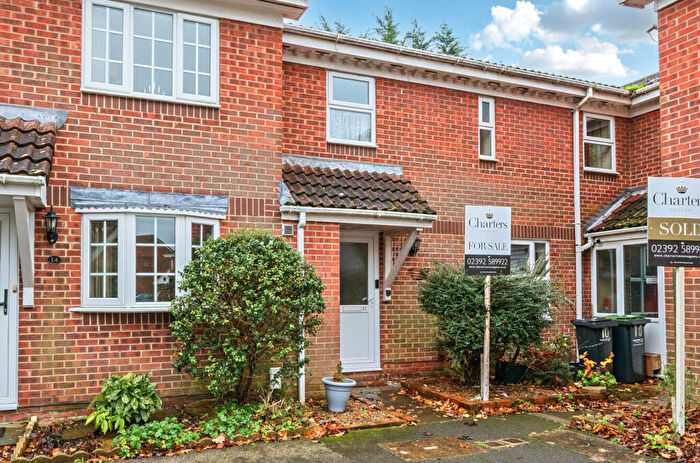
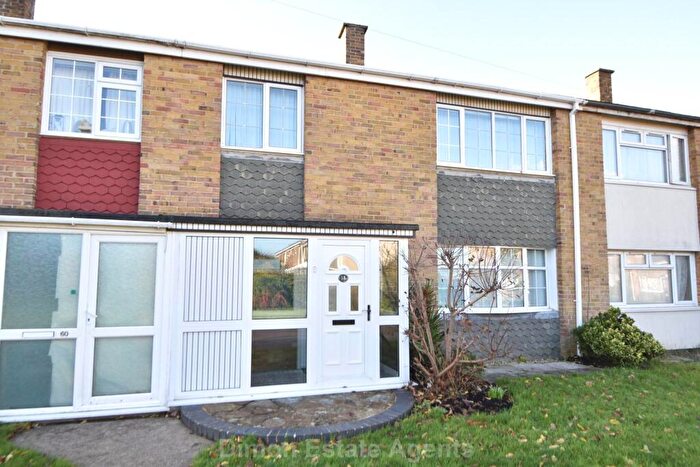
Houses for sale & to rent in Bridgemary North, Gosport
House Prices in Bridgemary North
Properties in Bridgemary North have an average house price of £287,237.00 and had 125 Property Transactions within the last 3 years¹.
Bridgemary North is an area in Gosport, Hampshire with 1,893 households², where the most expensive property was sold for £500,000.00.
Properties for sale in Bridgemary North
Roads and Postcodes in Bridgemary North
Navigate through our locations to find the location of your next house in Bridgemary North, Gosport for sale or to rent.
| Streets | Postcodes |
|---|---|
| Barwell Lane | PO13 0EQ PO13 0AU PO13 0FF |
| Birch Drive | PO13 0UN |
| Boyd Road | PO13 0TL |
| Bridgemary Grove | PO13 0UG |
| Bridgemary Road | PO13 0UH PO13 0UJ PO13 0UT |
| Bridgemary Way | PO13 0UQ |
| Brookside | PO13 0YS |
| Burnside | PO13 0YR |
| Chatfield Road | PO13 0TN |
| Conifer Grove | PO13 0TP |
| Dale Drive | PO13 0ST |
| Dayshes Close | PO13 0SL |
| Fareham Road | PO13 0AB PO13 0AD PO13 0AQ PO13 0AA PO13 0AT PO13 0AW PO13 0FN PO13 0FW |
| Ferndale Mews | PO13 0SW |
| Field Close | PO13 0YP |
| Foxbury Lane | PO13 0AY |
| Fraser Road | PO13 0UD |
| Gregson Avenue | PO13 0YL |
| Gregson Close | PO13 0PL |
| Hanbidge Crescent | PO13 0YD |
| Hanbidge Walk | PO13 0UA |
| Harwood Close | PO13 0TY |
| Harwood Road | PO13 0TT PO13 0TU |
| James Close | PO13 0TS |
| James Road | PO13 0TF |
| Keast Walk | PO13 0UB |
| Kent Road | PO13 0SP |
| Lapthorn Close | PO13 0SR |
| Lederle Lane | PO13 0AX PO13 0FE PO13 0FZ PO13 0LF |
| Maynard Close | PO13 0XH |
| Meadow Walk | PO13 0YN |
| Morris Close | PO13 0SS |
| Mountbatten Close | PO13 0UL |
| Nesbitt Close | PO13 0SX |
| Northway | PO13 0XE PO13 0XF |
| Nursery Close | PO13 0TH |
| Osborn Crescent | PO13 0SN |
| Pettycot Crescent | PO13 0SJ |
| Prideaux Brune Avenue | PO13 0PP PO13 0TZ PO13 0UE |
| Primrose Close | PO13 0WP |
| Rutherford Terrace | PO13 0UF |
| Springcroft | PO13 0YW |
| Stoners Close | PO13 0SH |
| The Mead | PO13 0TJ |
| The Parade | PO13 0SQ |
| Tukes Avenue | PO13 0SA PO13 0SB PO13 0SD PO13 0SE PO13 0SF PO13 0SG |
| Vian Close | PO13 0TX PO13 0FY |
| Woodside | PO13 0YT PO13 0YU PO13 0YX PO13 0YY PO13 0YZ |
| Wych Lane | PO13 0NN PO13 0SU PO13 0SZ PO13 0TA PO13 0TB PO13 0TD PO13 0TE PO13 0FB PO13 0SY |
| Wycote Road | PO13 0TG |
Transport near Bridgemary North
-
Fareham Station
-
Portchester Station
-
Portsmouth Harbour Station
-
Portsmouth and Southsea Station
-
Cosham Station
-
Swanwick Station
- FAQ
- Price Paid By Year
- Property Type Price
Frequently asked questions about Bridgemary North
What is the average price for a property for sale in Bridgemary North?
The average price for a property for sale in Bridgemary North is £287,237. This amount is 16% higher than the average price in Gosport. There are 1,037 property listings for sale in Bridgemary North.
What streets have the most expensive properties for sale in Bridgemary North?
The streets with the most expensive properties for sale in Bridgemary North are Fareham Road at an average of £407,600, Brookside at an average of £372,500 and Woodside at an average of £360,090.
What streets have the most affordable properties for sale in Bridgemary North?
The streets with the most affordable properties for sale in Bridgemary North are Springcroft at an average of £80,000, Dayshes Close at an average of £171,000 and Prideaux Brune Avenue at an average of £217,742.
Which train stations are available in or near Bridgemary North?
Some of the train stations available in or near Bridgemary North are Fareham, Portchester and Portsmouth Harbour.
Property Price Paid in Bridgemary North by Year
The average sold property price by year was:
| Year | Average Sold Price | Price Change |
Sold Properties
|
|---|---|---|---|
| 2025 | £305,875 | 7% |
28 Properties |
| 2024 | £285,209 | 2% |
51 Properties |
| 2023 | £278,141 | -3% |
46 Properties |
| 2022 | £287,488 | 13% |
45 Properties |
| 2021 | £250,642 | 9% |
65 Properties |
| 2020 | £227,716 | 5% |
60 Properties |
| 2019 | £217,411 | -2% |
68 Properties |
| 2018 | £221,960 | 5% |
51 Properties |
| 2017 | £209,812 | 7% |
55 Properties |
| 2016 | £194,274 | 11% |
49 Properties |
| 2015 | £173,367 | 6% |
54 Properties |
| 2014 | £163,322 | 4% |
60 Properties |
| 2013 | £157,229 | 1% |
52 Properties |
| 2012 | £155,204 | 7% |
56 Properties |
| 2011 | £143,647 | -9% |
39 Properties |
| 2010 | £156,054 | 8% |
40 Properties |
| 2009 | £144,166 | -7% |
40 Properties |
| 2008 | £154,929 | -3% |
23 Properties |
| 2007 | £159,299 | 9% |
103 Properties |
| 2006 | £144,855 | 5% |
81 Properties |
| 2005 | £137,970 | 3% |
71 Properties |
| 2004 | £133,888 | 8% |
87 Properties |
| 2003 | £123,017 | 17% |
81 Properties |
| 2002 | £102,193 | 18% |
75 Properties |
| 2001 | £83,651 | 8% |
89 Properties |
| 2000 | £76,941 | 12% |
57 Properties |
| 1999 | £67,771 | 15% |
79 Properties |
| 1998 | £57,719 | -3% |
68 Properties |
| 1997 | £59,563 | 13% |
104 Properties |
| 1996 | £51,572 | -1% |
56 Properties |
| 1995 | £52,152 | - |
54 Properties |
Property Price per Property Type in Bridgemary North
Here you can find historic sold price data in order to help with your property search.
The average Property Paid Price for specific property types in the last three years are:
| Property Type | Average Sold Price | Sold Properties |
|---|---|---|
| Semi Detached House | £305,261.00 | 63 Semi Detached Houses |
| Detached House | £345,766.00 | 15 Detached Houses |
| Terraced House | £252,879.00 | 44 Terraced Houses |
| Flat | £120,000.00 | 3 Flats |

