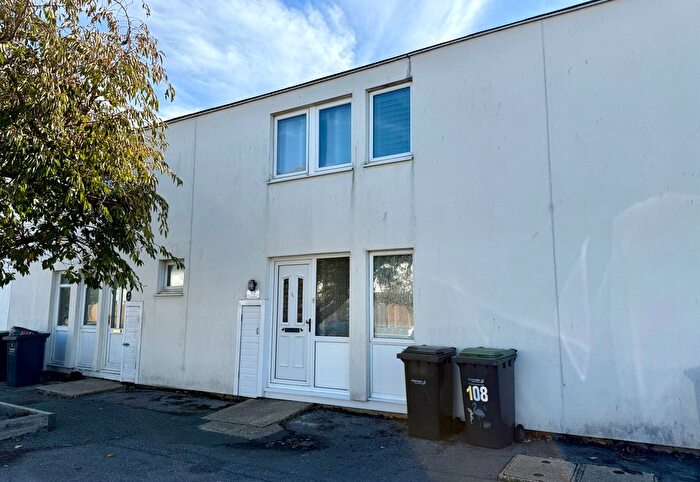
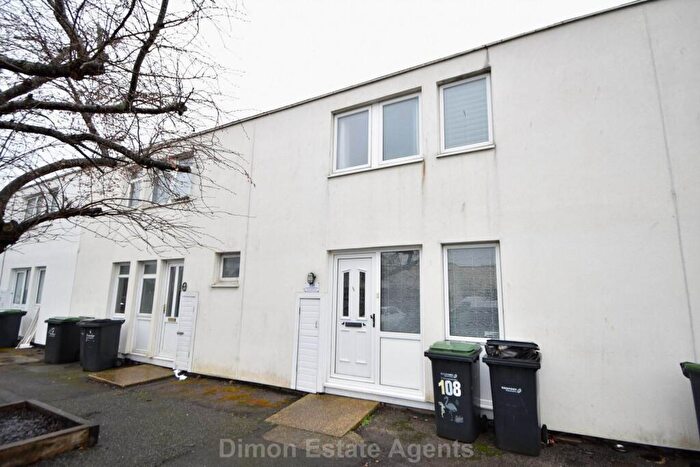
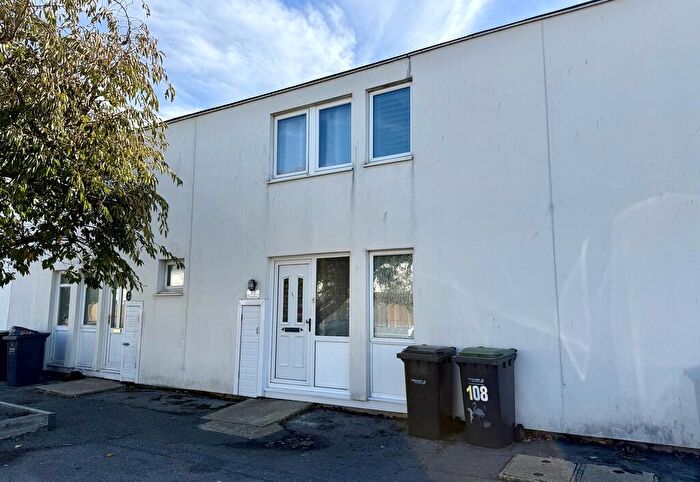
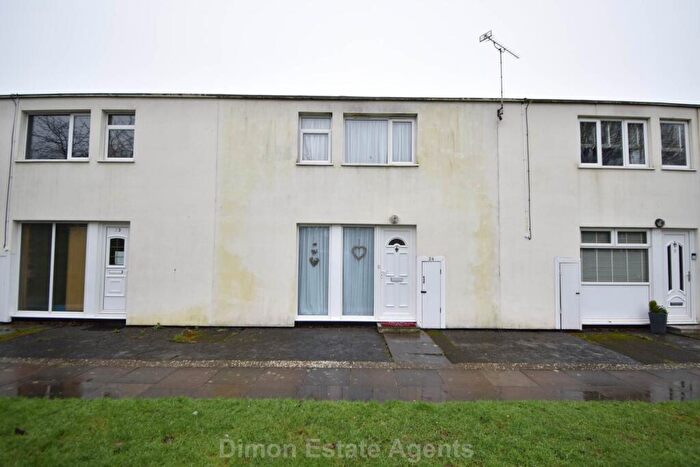
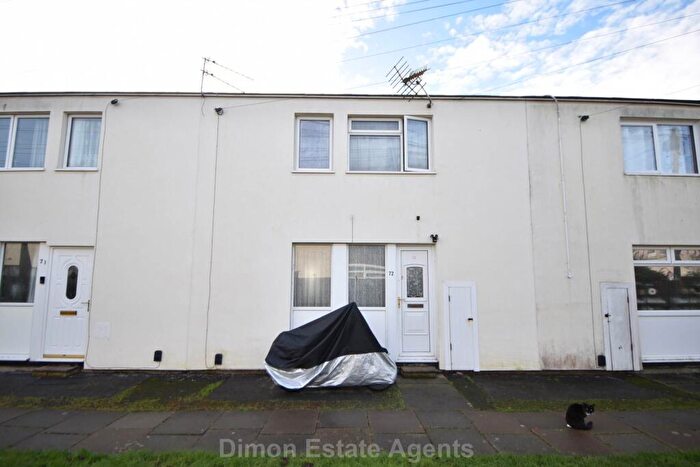
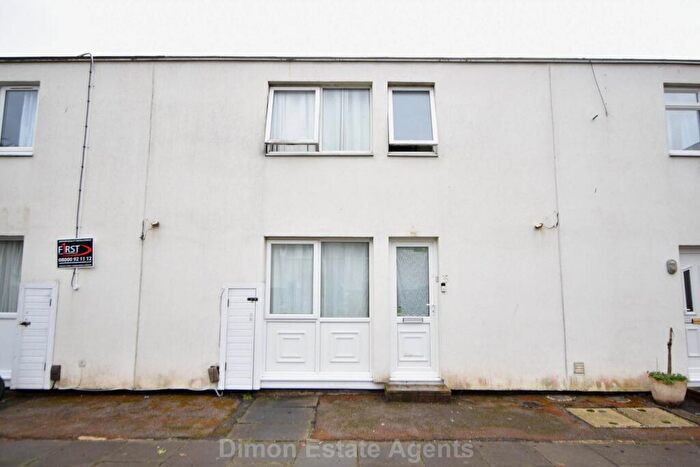
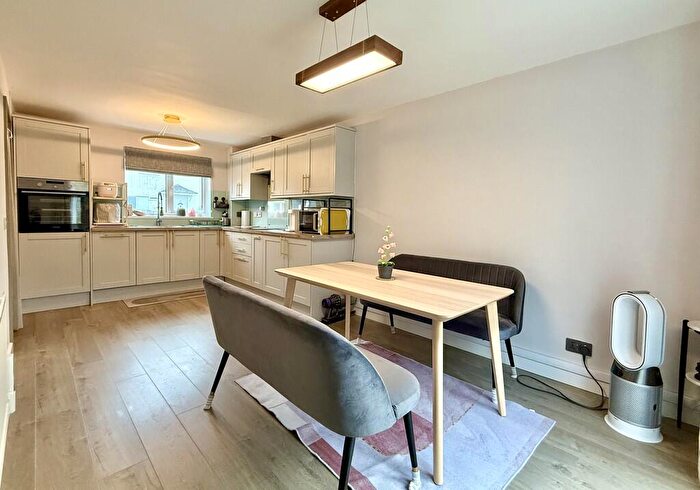
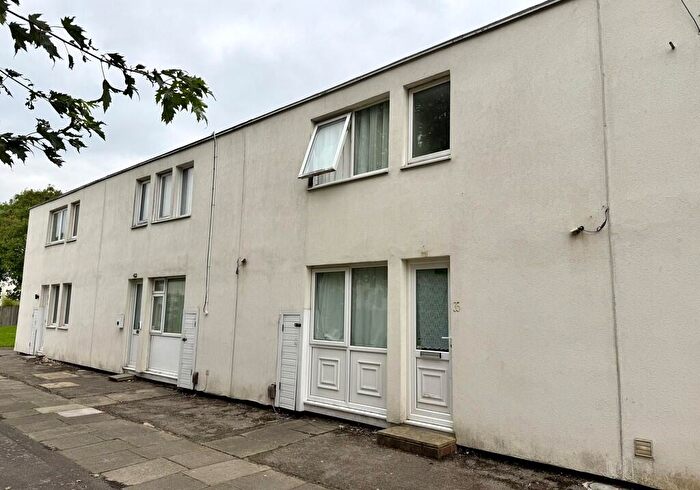
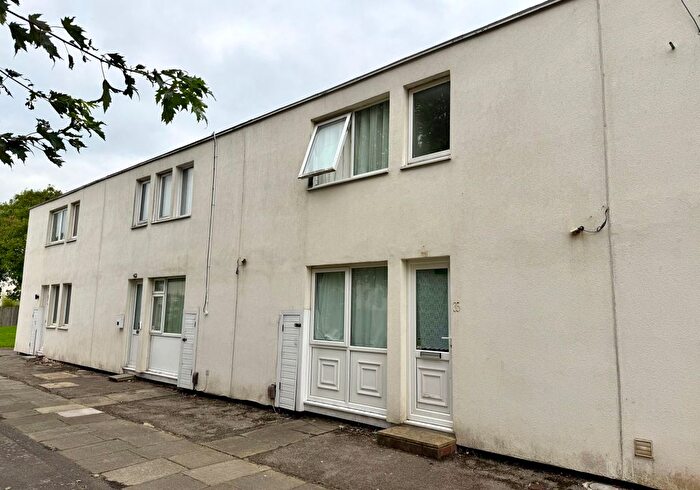
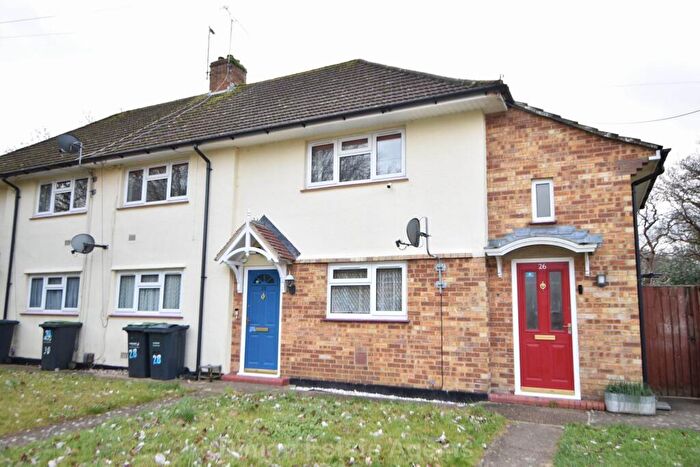
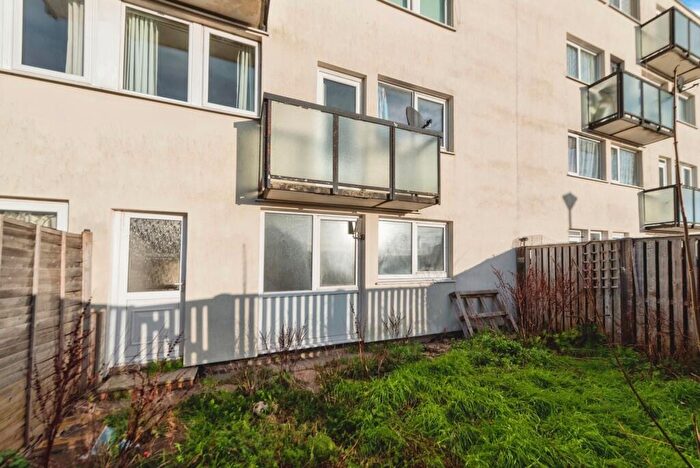
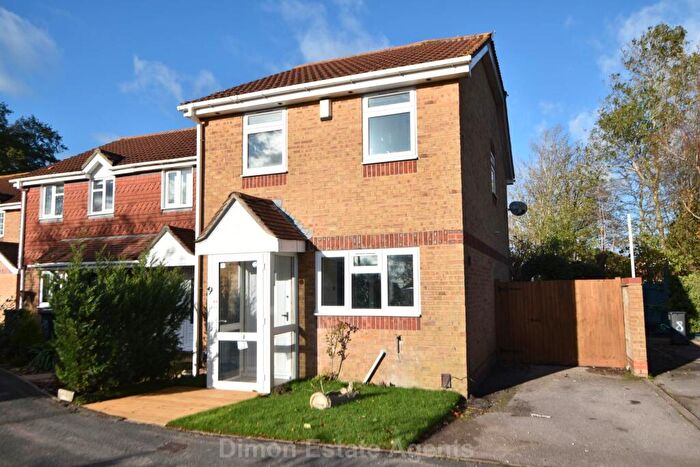
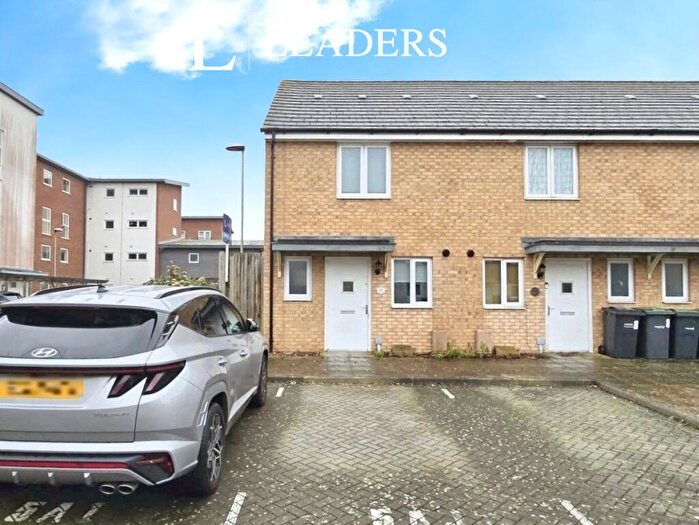
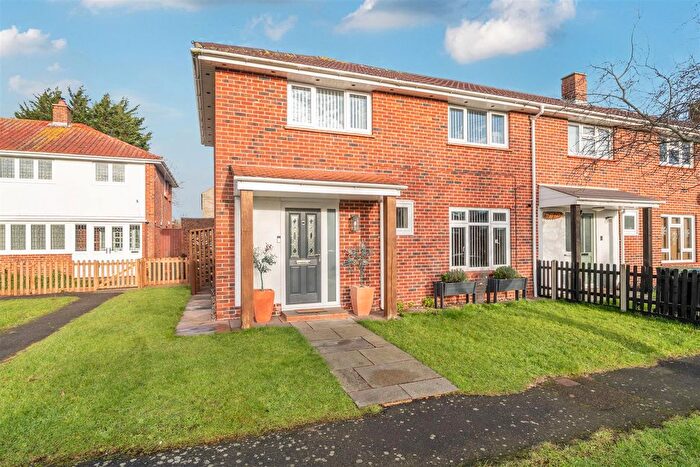
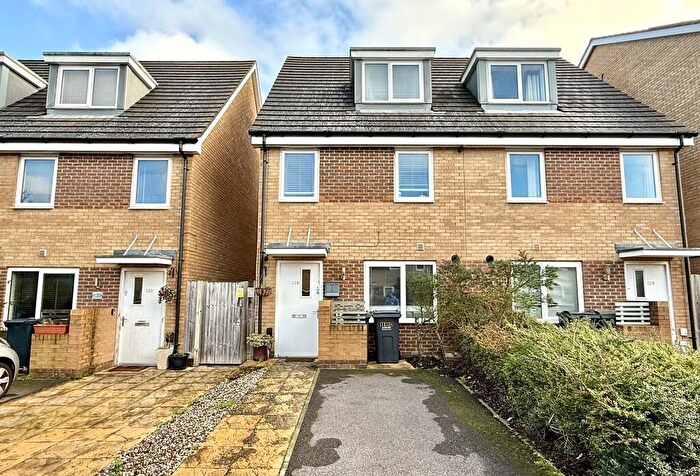
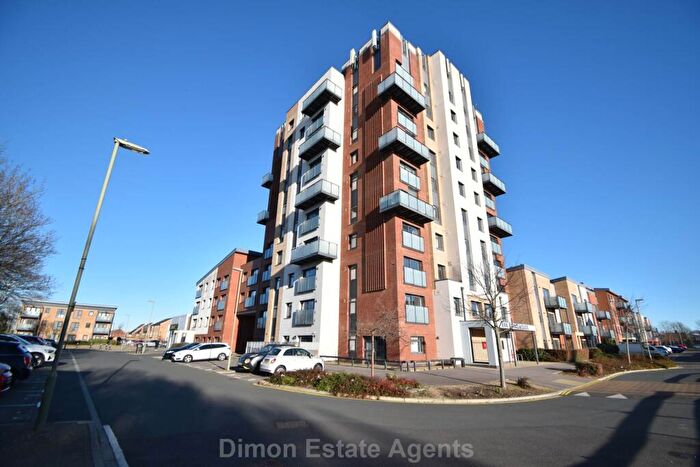
Houses for sale & to rent in Rowner And Holbrook, Gosport
House Prices in Rowner And Holbrook
Properties in Rowner And Holbrook have an average house price of £240,783.00 and had 141 Property Transactions within the last 3 years¹.
Rowner And Holbrook is an area in Gosport, Hampshire with 1,874 households², where the most expensive property was sold for £580,000.00.
Properties for sale in Rowner And Holbrook
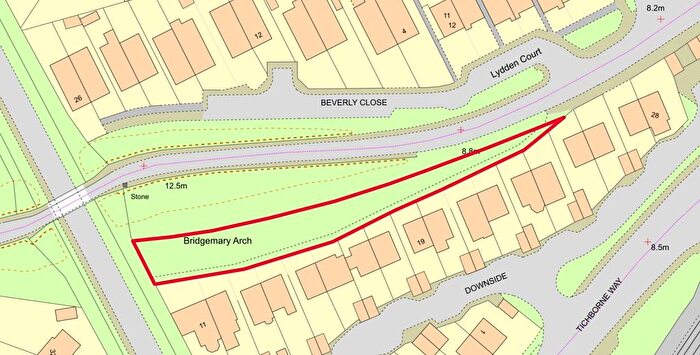
Roads and Postcodes in Rowner And Holbrook
Navigate through our locations to find the location of your next house in Rowner And Holbrook, Gosport for sale or to rent.
| Streets | Postcodes |
|---|---|
| Alliance Close | PO13 0DD |
| Almondside | PO13 0ZS |
| Ashdown | PO13 0DF |
| Aspengrove | PO13 0ZY |
| Austerberry Way | PO13 0BY |
| Biddlecombe Close | PO13 9TD |
| Bracklesham Road | PO13 0EN |
| Brune Lane | PO13 9RA PO13 9SL |
| Bucksey Road | PO13 9TE PO13 9TF |
| Charden Road | PO13 0ED PO13 0EE PO13 0EF PO13 0EG |
| Charnwood | PO13 0ZF |
| Connigar Close | PO13 9TX |
| Davis Close | PO13 9SZ |
| Dormy Way | PO13 9RF |
| Edgecombe Crescent | PO13 9RD |
| Fareham Road | PO13 0AE PO13 0ZX |
| Filmer Close | PO13 9SD |
| Fleet Close | PO13 0DR |
| Forest Way | PO13 0WU |
| Franklin Road | PO13 9TP PO13 9TR PO13 9TS |
| Gilbert Close | PO13 0BP |
| Gorselands Way | PO13 0EB |
| Grange Lane | PO13 9RX |
| Henville Close | PO13 9SE |
| Highwood Road | PO13 9TU |
| Homer Close | PO13 9TJ PO13 9TL |
| Kielder Grove | PO13 0ZA |
| Landon Road | PO13 0EP |
| Lawn Close | PO13 0BZ |
| Lombardy Close | PO13 0ZE |
| Madison Close | PO13 9UL |
| Malthouse Gardens | PO13 9FN |
| Mansfield Road | PO13 9SY |
| Marles Close | PO13 9SH |
| Masten Crescent | PO13 9SX |
| Newbroke Road | PO13 9RT PO13 9UJ |
| Oakdene | PO13 0DB |
| Orangegrove | PO13 0ZQ |
| Owen Close | PO13 9TT |
| Pinewood | PO13 0ZP |
| Pound Close | PO13 0EH |
| Rowallan Avenue | PO13 9RE |
| Rowner Lane | PO13 9SP PO13 9SS PO13 9SR PO13 9ST PO13 9SU PO13 9UR |
| Rowner Road | PO13 0EW PO13 0PR PO13 9UA PO13 9UB PO13 9UD PO13 9UE |
| Savernake Close | PO13 0ZB |
| Sedgewick Close | PO13 9RB |
| Shackleton Road | PO13 9SG PO13 9SQ |
| Snape Close | PO13 9TB |
| St Nicholas Avenue | PO13 9RL PO13 9RS PO13 9TA PO13 9RJ PO13 9TG |
| Sycamore Close | PO13 0ZH |
| The Chine | PO13 0ZW |
| The Coppice | PO13 0WX |
| The Firs | PO13 0ZN |
| The Glen | PO13 0ZR |
| The Hoe | PO13 0ZJ |
| The Limes | PO13 0ZG |
| The Mount | PO13 0ZZ |
| The Nook | PO13 0ZT |
| The Thicket | PO13 0ZL |
| Tichborne Way | PO13 0BH PO13 0BJ PO13 0BL PO13 0BN |
| Tudor Close | PO13 0EJ |
| Turner Avenue | PO13 0BS PO13 0BT PO13 0BU PO13 0BX |
| Vanstone Road | PO13 9SJ |
| Vineside | PO13 0ZU |
| Withies Road | PO13 0EL |
| Yewside | PO13 0ZD |
Transport near Rowner And Holbrook
-
Portsmouth Harbour Station
-
Fareham Station
-
Portchester Station
-
Portsmouth and Southsea Station
-
Fratton Station
-
Cosham Station
-
Hilsea Station
- FAQ
- Price Paid By Year
- Property Type Price
Frequently asked questions about Rowner And Holbrook
What is the average price for a property for sale in Rowner And Holbrook?
The average price for a property for sale in Rowner And Holbrook is £240,783. This amount is 3% lower than the average price in Gosport. There are 1,311 property listings for sale in Rowner And Holbrook.
What streets have the most expensive properties for sale in Rowner And Holbrook?
The streets with the most expensive properties for sale in Rowner And Holbrook are Ashdown at an average of £400,500, Edgecombe Crescent at an average of £358,333 and Oakdene at an average of £354,000.
What streets have the most affordable properties for sale in Rowner And Holbrook?
The streets with the most affordable properties for sale in Rowner And Holbrook are Rowner Lane at an average of £115,000, Homer Close at an average of £153,083 and Orangegrove at an average of £166,000.
Which train stations are available in or near Rowner And Holbrook?
Some of the train stations available in or near Rowner And Holbrook are Portsmouth Harbour, Fareham and Portchester.
Property Price Paid in Rowner And Holbrook by Year
The average sold property price by year was:
| Year | Average Sold Price | Price Change |
Sold Properties
|
|---|---|---|---|
| 2025 | £243,145 | 5% |
34 Properties |
| 2024 | £229,857 | -15% |
35 Properties |
| 2023 | £265,064 | 17% |
39 Properties |
| 2022 | £221,242 | -4% |
33 Properties |
| 2021 | £229,915 | 13% |
56 Properties |
| 2020 | £199,233 | -5% |
31 Properties |
| 2019 | £208,592 | 4% |
38 Properties |
| 2018 | £200,083 | 4% |
48 Properties |
| 2017 | £192,956 | 14% |
43 Properties |
| 2016 | £165,482 | 8% |
43 Properties |
| 2015 | £152,335 | 6% |
59 Properties |
| 2014 | £142,988 | -12% |
43 Properties |
| 2013 | £159,436 | 18% |
46 Properties |
| 2012 | £129,958 | -5% |
94 Properties |
| 2011 | £136,210 | 6% |
22 Properties |
| 2010 | £127,535 | -12% |
17 Properties |
| 2009 | £143,269 | 2% |
32 Properties |
| 2008 | £140,028 | -4% |
37 Properties |
| 2007 | £145,882 | 6% |
52 Properties |
| 2006 | £137,043 | 2% |
71 Properties |
| 2005 | £134,880 | 10% |
50 Properties |
| 2004 | £121,244 | 2% |
49 Properties |
| 2003 | £118,669 | 27% |
53 Properties |
| 2002 | £86,257 | 8% |
68 Properties |
| 2001 | £79,432 | 14% |
52 Properties |
| 2000 | £68,176 | 17% |
54 Properties |
| 1999 | £56,901 | 7% |
51 Properties |
| 1998 | £53,084 | 1% |
48 Properties |
| 1997 | £52,288 | 10% |
39 Properties |
| 1996 | £47,062 | 1% |
41 Properties |
| 1995 | £46,542 | - |
34 Properties |
Property Price per Property Type in Rowner And Holbrook
Here you can find historic sold price data in order to help with your property search.
The average Property Paid Price for specific property types in the last three years are:
| Property Type | Average Sold Price | Sold Properties |
|---|---|---|
| Semi Detached House | £289,269.00 | 39 Semi Detached Houses |
| Detached House | £403,277.00 | 9 Detached Houses |
| Terraced House | £233,937.00 | 57 Terraced Houses |
| Flat | £158,472.00 | 36 Flats |

