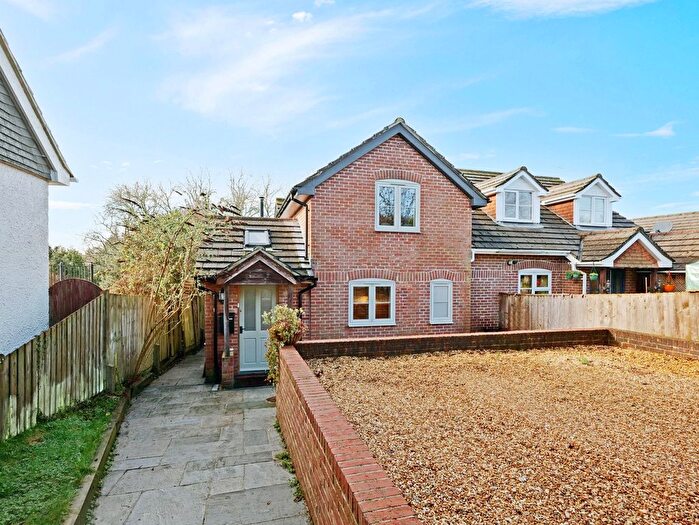
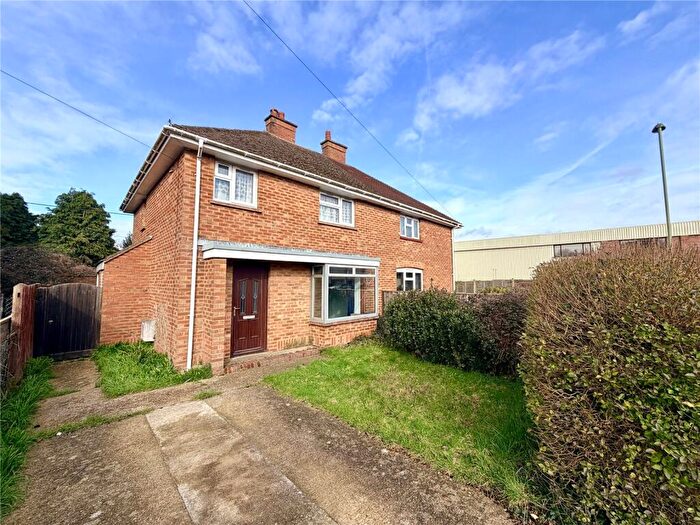
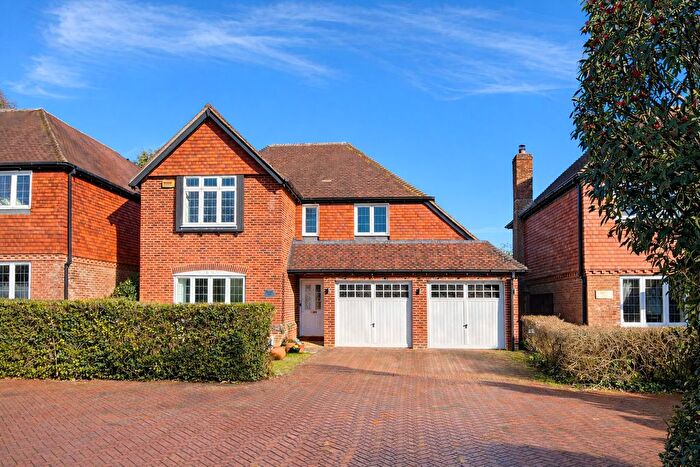
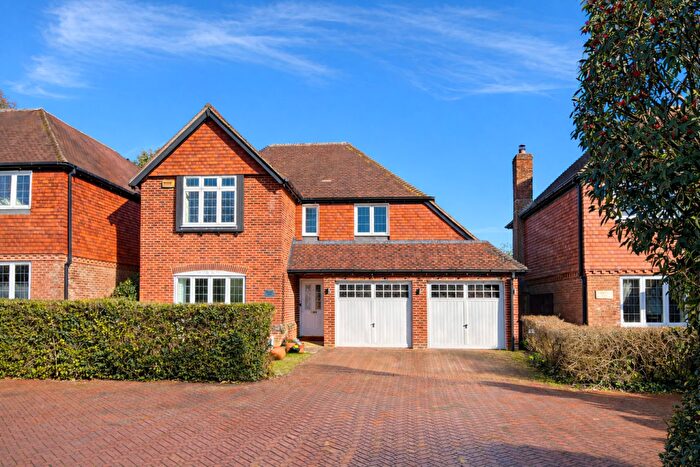
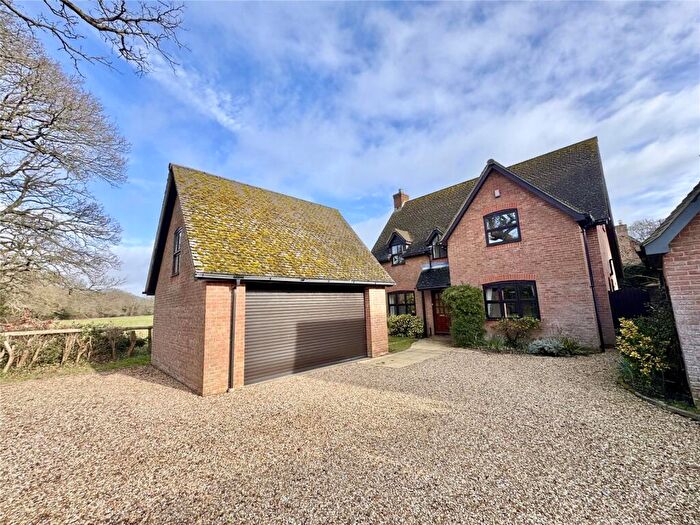
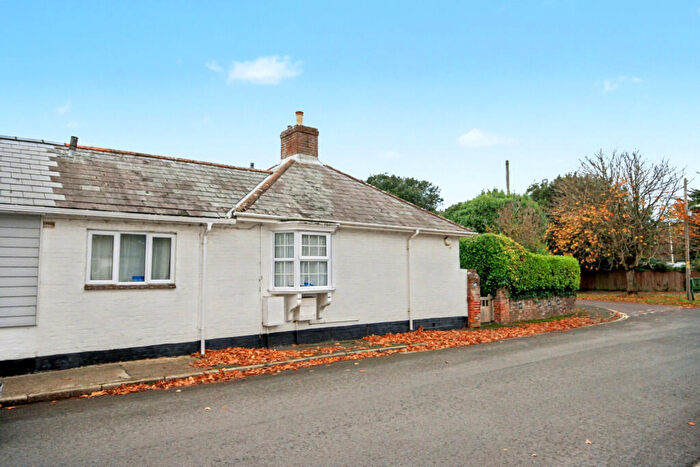
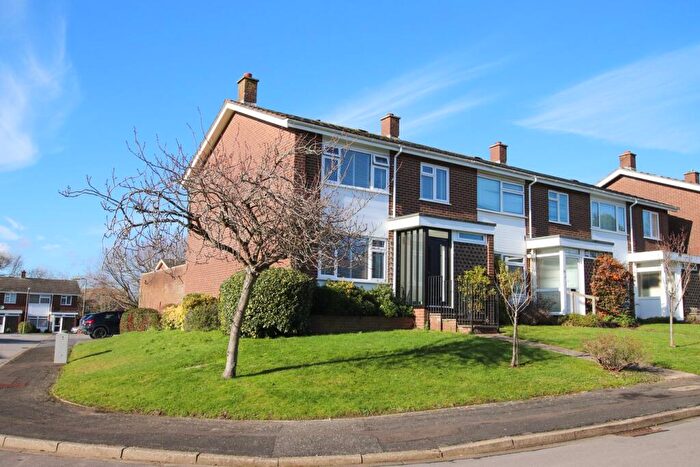
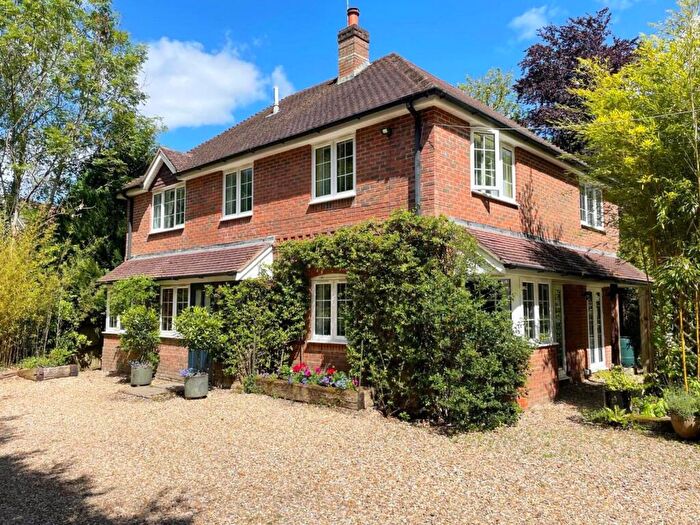
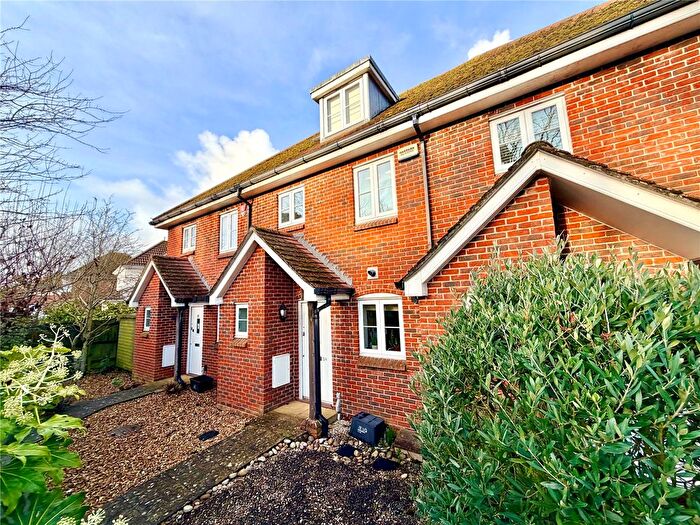
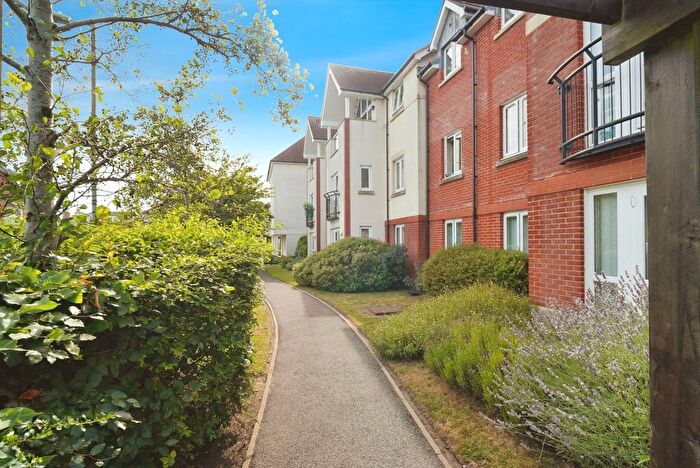
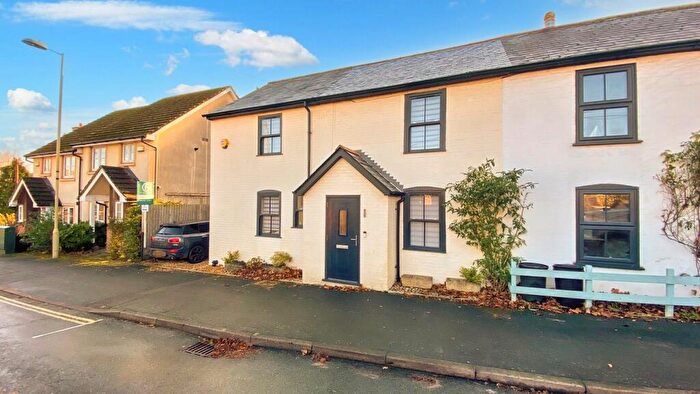
Houses for sale & to rent in Boldre And Sway, Lymington
House Prices in Boldre And Sway
Properties in Boldre And Sway have an average house price of £845,200.00 and had 158 Property Transactions within the last 3 years¹.
Boldre And Sway is an area in Lymington, Hampshire with 2,255 households², where the most expensive property was sold for £3,953,516.00.
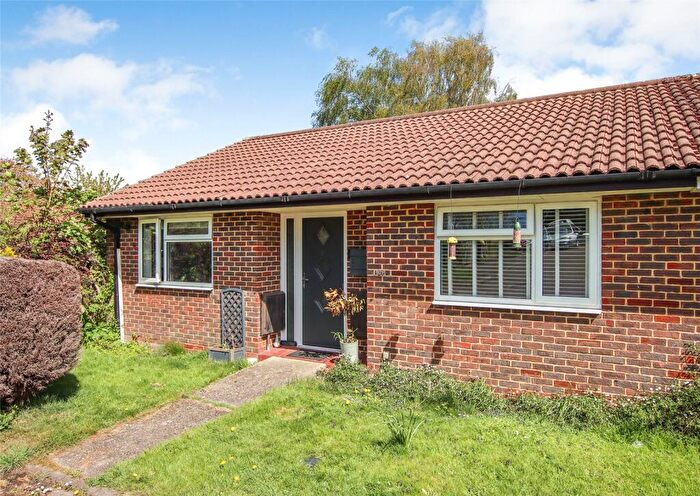
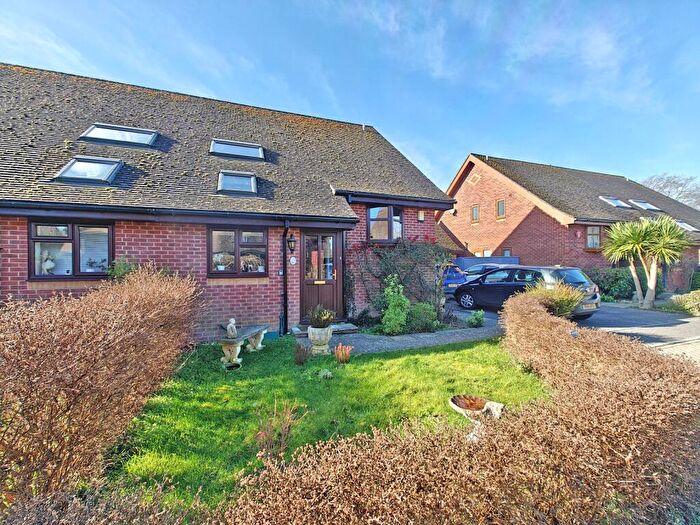
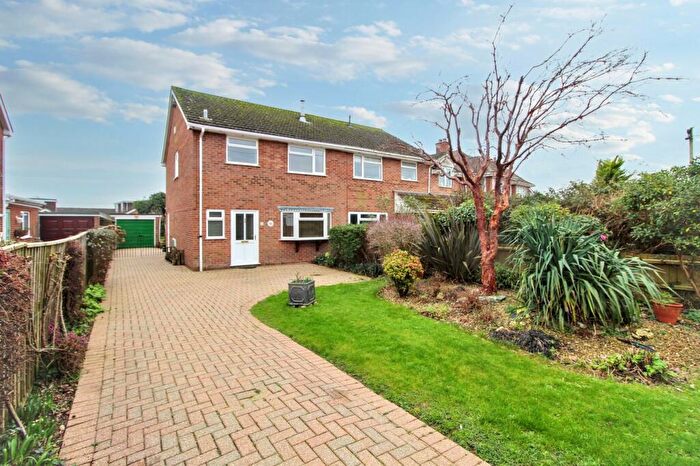
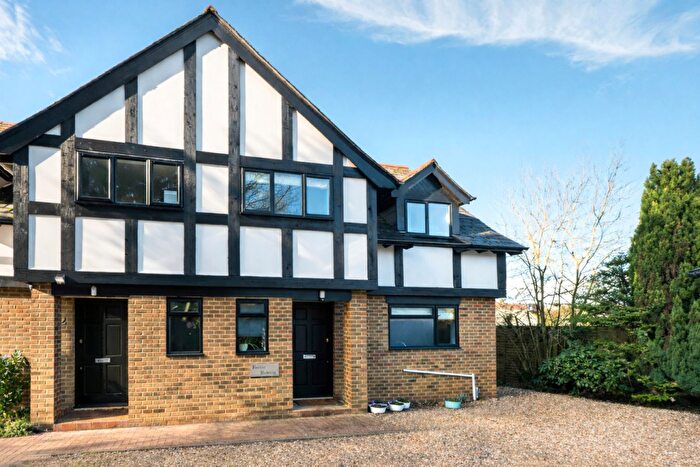
Properties for sale in Boldre And Sway
Roads and Postcodes in Boldre And Sway
Navigate through our locations to find the location of your next house in Boldre And Sway, Lymington for sale or to rent.
| Streets | Postcodes |
|---|---|
| Adlams Lane | SO41 6EG |
| Agars Lane | SO41 0FL SO41 6FL |
| Anderwood Drive | SO41 6AW |
| Arnewood Bridge Road | SO41 6DA SO41 6ER |
| Back Lane | SO41 6BU |
| Badgers Close | SO41 6EW |
| Barrows Lane | SO41 6DD SO41 6DE |
| Birchy Hill | SO41 6BJ |
| Boldre Lane | SO41 8PA SO41 8PD |
| Bond Close | SO41 6DR |
| Boundway Hill | SO41 6EN |
| Brickfield Lane | SO41 5RD |
| Brighton Road | SO41 6EA SO41 6EB |
| Brook Hill | SO41 5RQ |
| Buldowne Walk | SO41 6DU |
| Bull Hill | SO41 5RA |
| Burnt House Lane | SO41 5QN |
| Centenary Close | SO41 6GB |
| Chapel Lane | SO41 6BS SO41 6BT |
| Church Lane | SO41 5PG SO41 5QL SO41 6AD |
| Church Lane Corner | SO41 5QH |
| Coombe Lane | SO41 6BN SO41 6BP |
| Coxhill | SO41 8PS |
| Crabbswood Lane | SO41 6EQ |
| Crittall Close | SO41 6AH |
| Cruse Close | SO41 6AY |
| Durnstown | SO41 6AL |
| Durrant Way | SO41 6DQ |
| Fairlight Lane | SO41 6FB |
| Ferry Point | SO41 5TB |
| Fleur-de-lys Park Hill | SO41 5QJ |
| Flexford Lane | SO41 6DN |
| Forest Edge Close | SO41 6EX |
| Gilpin Close | SO41 5RY |
| Gilpin Hill | SO41 6DT |
| Gilpin Place | SO41 6EU |
| Hawthorn Drive | SO41 6DX |
| Heron Close | SO41 6ET |
| Highfield Close | SO41 6AU |
| Highfield Gardens | SO41 6BY |
| Hollies Close | SO41 6BD |
| Holly Lane | SO41 5QY SO41 5QZ |
| Hudson Davies Close | SO41 5PA |
| Hundred Lane | SO41 5RG |
| Hurstly Lane | SO41 8PQ |
| Hyde Close | SO41 6AJ |
| Jordans Lane | SO41 5QW SO41 6AR SO41 5QX SO41 5RL |
| Joys Lane | SO41 5RW |
| Jubilee Court | SO41 6HA |
| Kings Hyde | SO41 8LT |
| Kings Lane | SO41 6BQ |
| Kitchers Close | SO41 6DS |
| Linnies Lane | SO41 6ES |
| Lisle Court Road | SO41 5SH |
| Little Burn | SO41 6DZ |
| Lower Mead End Road | SO41 6EL |
| Lower Sandy Down Lane | SO41 8PP SO41 8PR |
| Lucky Lane | SO41 5QS |
| Lymington Road | SO41 5SL SO41 5SY |
| Main Road | SO41 5RF |
| Manchester Road | SO41 6AP SO41 6AS |
| Marley Mount | SO41 6EP |
| May Lane | SO41 5QR |
| Mead End Road | SO41 6EE SO41 6EH |
| Middle Road | SO41 6AT SO41 6BB SO41 6EJ SO41 6FX |
| Mill Lane | SO41 8LN |
| Monument Lane | SO41 5SE SO41 5SZ |
| Moser Grove | SO41 6GA |
| Mount Pleasant Lane | SO41 8LS |
| New Road | SO41 5RZ |
| Normandy Close | SO41 6EF |
| Northover Lane | SO41 6FS |
| Oakenbrow | SO41 6DY |
| Old Vicarage Lane | SO41 6BH |
| Oxford Terrace | SO41 6AQ |
| Pauls Lane | SO41 6BR |
| Peppercorn | SO41 6FA |
| Pilley Bailey | SO41 5QT |
| Pilley Green | SO41 5QQ |
| Pilley Hill | SO41 5QF |
| Pilley Street | SO41 5QG SO41 5QP |
| Pitmore Lane | SO41 6BW SO41 6BX SO41 8LL |
| Private Road | SO41 5SN |
| Pylewell | SO41 5SJ |
| Rhiners Close | SO41 6BZ |
| Rodlease Lane | SO41 5PB |
| Rope Hill | SO41 8NE SO41 8QW |
| Rowan Close | SO41 6AZ |
| Royden Lane | SO41 8PE SO41 8PF SO41 8PJ |
| Sandy Down | SO41 8PL SO41 8PN |
| School Lane | SO41 5QE |
| Setthorns Road | SO41 6AG |
| Shallows Lane | SO41 8PB |
| Shirley Holms | SO41 8NH |
| Shirley Holms Road | SO41 8NG |
| Snooks Lane | SO41 5SF |
| South Baddesley Road | SO41 5SD SO41 5SG SO41 5ZB |
| South Sway | SO41 6DP |
| South Sway Lane | SO41 6BL SO41 6DL |
| Southampton Road | SO41 8ND SO41 8PT |
| St James Road | SO41 6AN |
| Stanford Rise | SO41 6DW |
| Station Road | SO41 6AA SO41 6AB SO41 6BA SO41 6BE SO41 6BF |
| Sway Road | SO41 6FR |
| Tanners Lane | SO41 5SP |
| Tebourba Cottages | SO41 6BG |
| Thatchers Lane | SO41 5RT |
| The Close | SO41 6ED |
| The Paddock | SO41 6AF |
| Tweed Lane | SO41 8NF |
| Undershore Road | SO41 5QA SO41 5SA SO41 5SB |
| Valeview Park | SO41 6JA |
| Vicars Hill | SO41 5QB |
| Walhampton Cottages | SO41 5RE |
| Walhampton Hill | SO41 5RB |
| Warborne Lane | SO41 5QD SO41 5RJ SO41 5RH |
| Westbeams Road | SO41 6AE |
| Widden Close | SO41 6AX |
| Wooden House Lane | SO41 5QU |
| SO41 5RP SO41 5RR SO41 5RS SO41 5RU SO41 5RX SO41 8NL SO41 5AB SO41 5RN SO41 5ZG |
Transport near Boldre And Sway
- FAQ
- Price Paid By Year
- Property Type Price
Frequently asked questions about Boldre And Sway
What is the average price for a property for sale in Boldre And Sway?
The average price for a property for sale in Boldre And Sway is £845,200. This amount is 42% higher than the average price in Lymington. There are 6,393 property listings for sale in Boldre And Sway.
What streets have the most expensive properties for sale in Boldre And Sway?
The streets with the most expensive properties for sale in Boldre And Sway are Birchy Hill at an average of £3,200,000, Sandy Down at an average of £1,945,000 and Coombe Lane at an average of £1,925,000.
What streets have the most affordable properties for sale in Boldre And Sway?
The streets with the most affordable properties for sale in Boldre And Sway are Rowan Close at an average of £370,000, Centenary Close at an average of £374,000 and Crittall Close at an average of £443,000.
Which train stations are available in or near Boldre And Sway?
Some of the train stations available in or near Boldre And Sway are Sway, Lymington Town and Lymington Pier.
Property Price Paid in Boldre And Sway by Year
The average sold property price by year was:
| Year | Average Sold Price | Price Change |
Sold Properties
|
|---|---|---|---|
| 2025 | £728,513 | -29% |
38 Properties |
| 2024 | £937,989 | 13% |
65 Properties |
| 2023 | £816,160 | -7% |
55 Properties |
| 2022 | £872,835 | 20% |
74 Properties |
| 2021 | £695,575 | -26% |
98 Properties |
| 2020 | £877,806 | 29% |
85 Properties |
| 2019 | £620,449 | -17% |
66 Properties |
| 2018 | £728,581 | 15% |
69 Properties |
| 2017 | £615,756 | 5% |
87 Properties |
| 2016 | £586,753 | 9% |
89 Properties |
| 2015 | £531,118 | -9% |
76 Properties |
| 2014 | £580,846 | 12% |
92 Properties |
| 2013 | £509,667 | 11% |
73 Properties |
| 2012 | £456,145 | -12% |
90 Properties |
| 2011 | £510,818 | 21% |
70 Properties |
| 2010 | £405,500 | -20% |
68 Properties |
| 2009 | £488,539 | 9% |
70 Properties |
| 2008 | £442,407 | -23% |
51 Properties |
| 2007 | £545,772 | 13% |
94 Properties |
| 2006 | £472,215 | 2% |
109 Properties |
| 2005 | £464,291 | 16% |
99 Properties |
| 2004 | £390,991 | -0,2% |
93 Properties |
| 2003 | £391,667 | 15% |
92 Properties |
| 2002 | £334,872 | 15% |
101 Properties |
| 2001 | £282,974 | 13% |
138 Properties |
| 2000 | £246,838 | 22% |
105 Properties |
| 1999 | £192,958 | 9% |
97 Properties |
| 1998 | £176,223 | 1% |
92 Properties |
| 1997 | £173,991 | 12% |
102 Properties |
| 1996 | £153,093 | -8% |
113 Properties |
| 1995 | £165,545 | - |
77 Properties |
Property Price per Property Type in Boldre And Sway
Here you can find historic sold price data in order to help with your property search.
The average Property Paid Price for specific property types in the last three years are:
| Property Type | Average Sold Price | Sold Properties |
|---|---|---|
| Flat | £420,321.00 | 7 Flats |
| Semi Detached House | £593,845.00 | 31 Semi Detached Houses |
| Detached House | £994,463.00 | 102 Detached Houses |
| Terraced House | £597,497.00 | 18 Terraced Houses |

