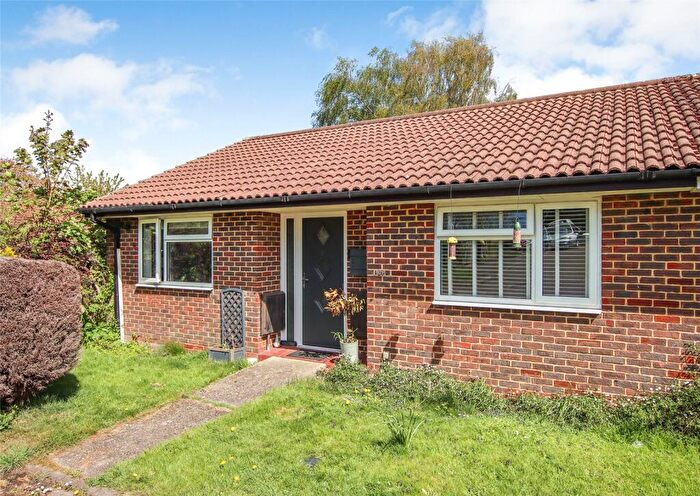
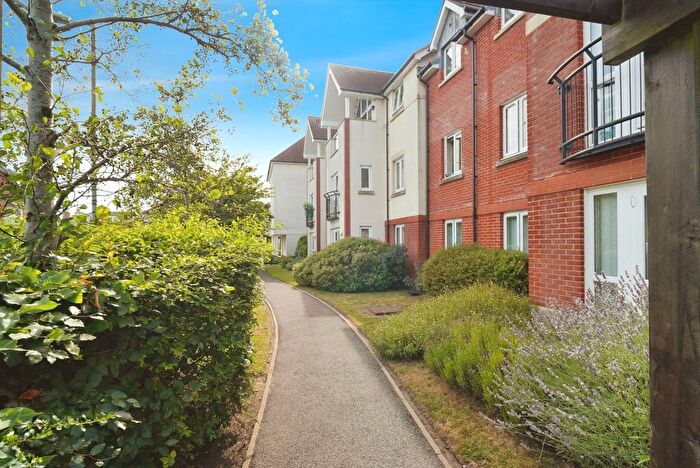
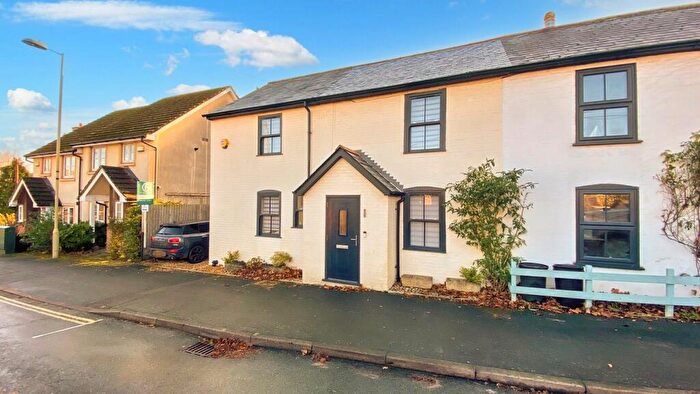
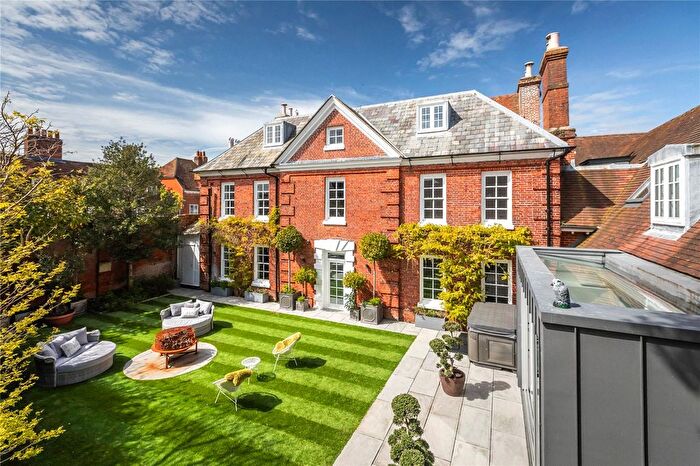
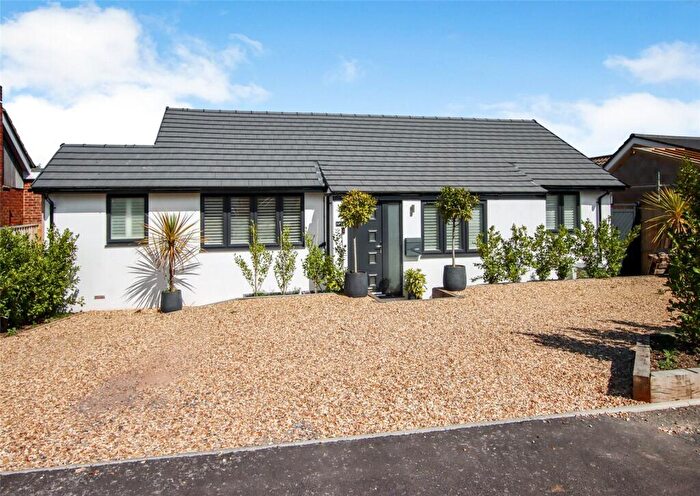
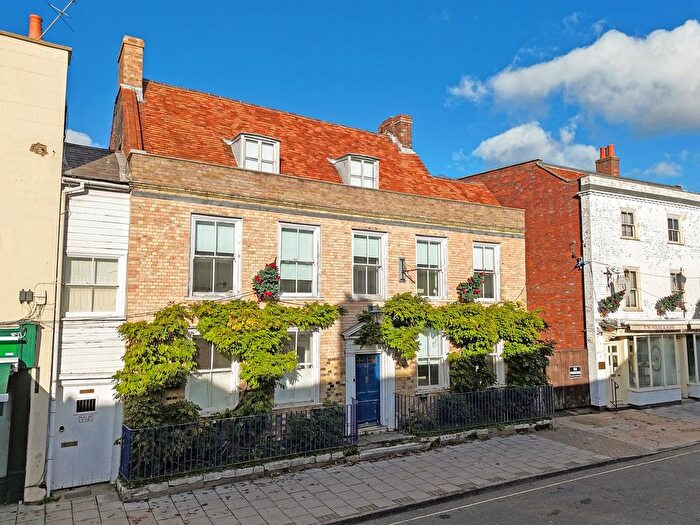
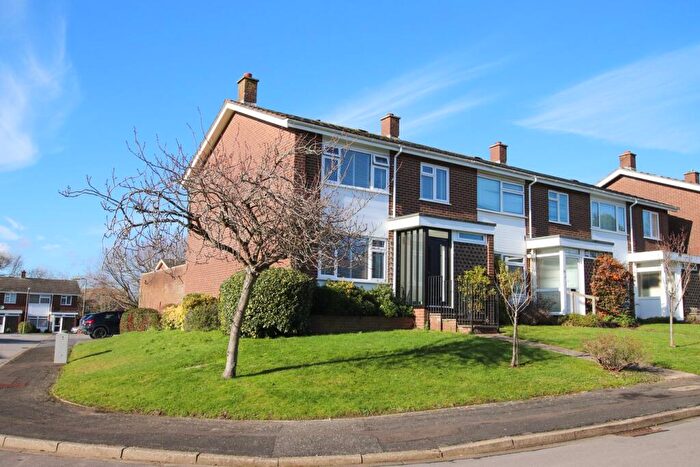
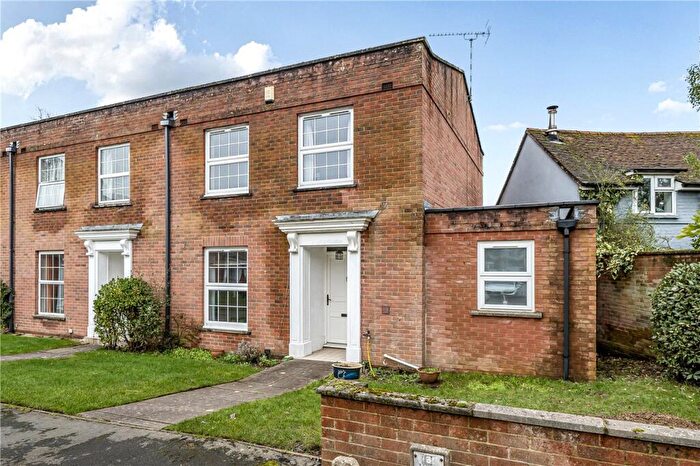
Houses for sale & to rent in Buckland, Lymington
House Prices in Buckland
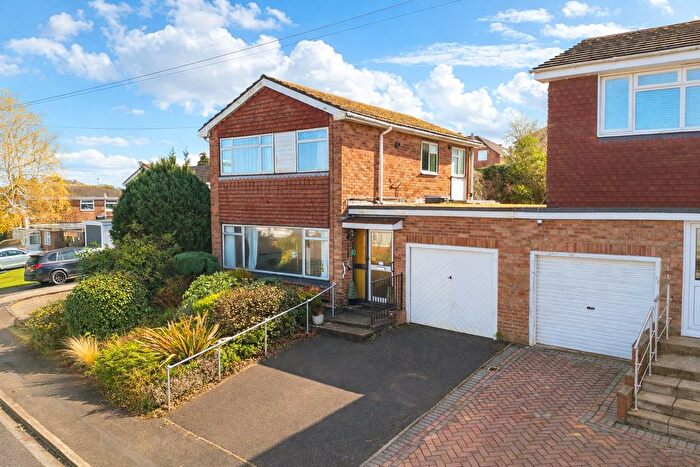
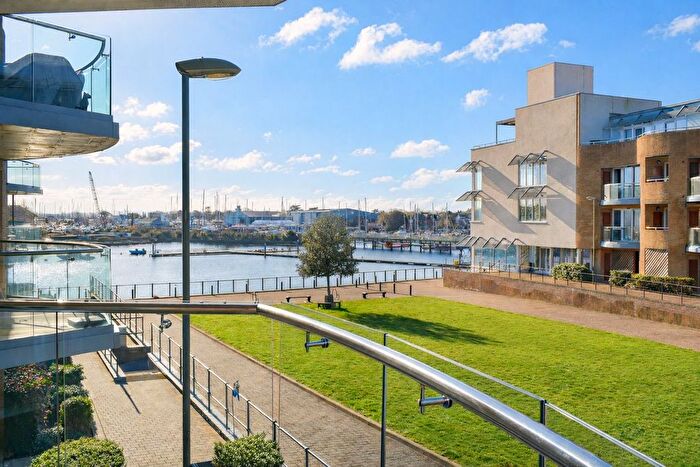
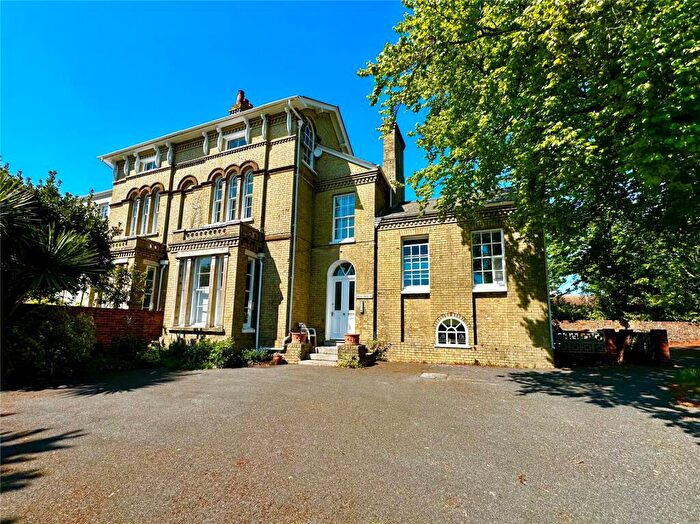
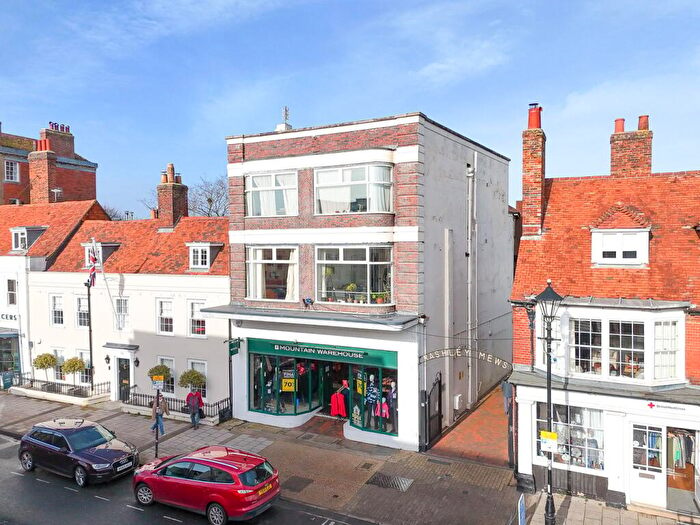
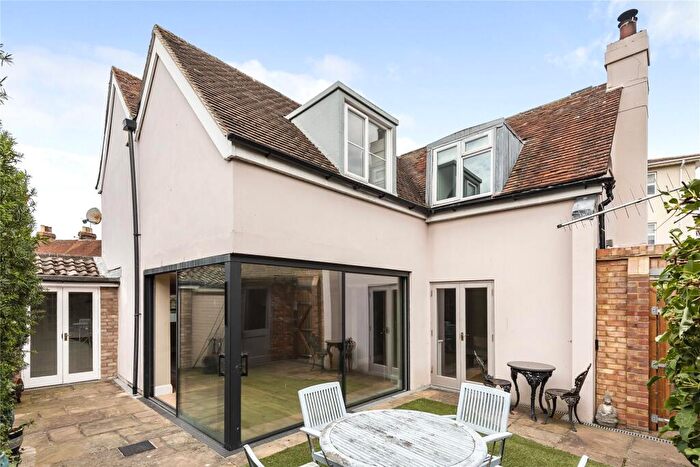
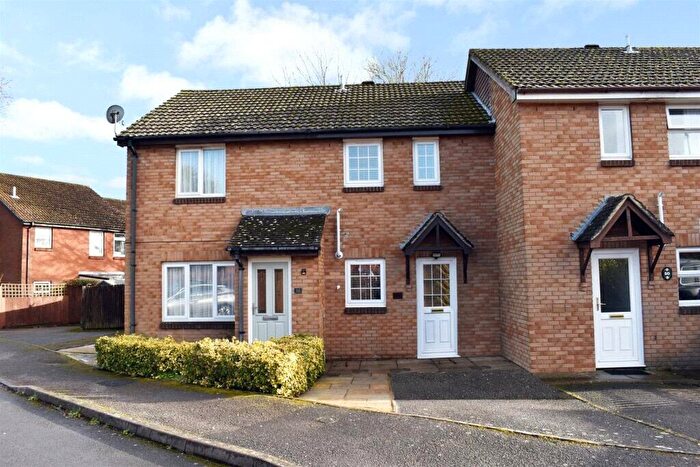
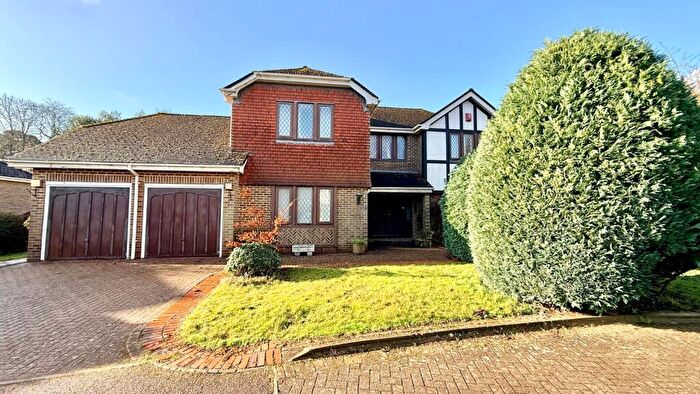
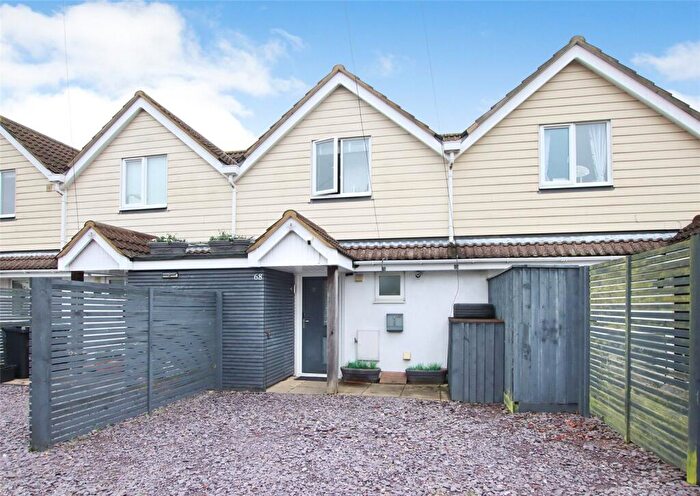
Properties in Buckland have an average house price of £382,128.00 and had 178 Property Transactions within the last 3 years¹.
Buckland is an area in Lymington, Hampshire with 1,641 households², where the most expensive property was sold for £1,065,000.00.
Properties for sale in Buckland
Roads and Postcodes in Buckland
Navigate through our locations to find the location of your next house in Buckland, Lymington for sale or to rent.
| Streets | Postcodes |
|---|---|
| Alexandra Mews | SO41 9NR |
| Ambrose Corner | SO41 8QJ |
| Ampress Lane | SO41 8LZ SO41 8FA SO41 8JX SO41 8LW SO41 8QE SO41 8QF |
| Ampress Works | SO41 8XN |
| Avenue Road | SO41 9FY SO41 9GP SO41 9PA |
| Bankhill Drive | SO41 9FF |
| Bankside | SO41 8YF |
| Bankview | SO41 8YG SO41 8YH |
| Bentley Way | SO41 8JW |
| Bramble Walk | SO41 9LW |
| Broomfield Lane | SO41 9DG |
| Buckland Dene | SO41 9DT |
| Buckland Gardens | SO41 8QL |
| Campion Way | SO41 9LS SO41 9LJ |
| Carpenter Close | SO41 9EU |
| Cavendish Place | SO41 9ET |
| Clinton Road | SO41 9EA |
| Colborne Close | SO41 9LN |
| Ditchbury | SO41 9FJ |
| East Hill | SO41 9DF |
| Ellery Grove | SO41 9DX |
| Fairlea Road | SO41 9EF |
| Fennel Gardens | SO41 9FS |
| Field Walk | SO41 9LG |
| Fieldhouse Way | SO41 9DP |
| Fromond Close | SO41 9LQ |
| Garrow Drive | SO41 9LP |
| Grosvenor Mews | SO41 9JY |
| Harvester Way | SO41 8YB SO41 8YD |
| Hillditch | SO41 9FG |
| Hives Way | SO41 8YE |
| Hollywood Lane | SO41 9HD |
| Howlett Close | SO41 9LA |
| Jonathan Close | SO41 9DY |
| Knight Gardens | SO41 9NZ |
| Lower Buckland Road | SO41 9DH SO41 9DL SO41 9DN SO41 9DR SO41 9DS SO41 9DU SO41 9DW SO41 9ER SO41 9EX SO41 9NP SO41 9AT |
| Lyric Place | SO41 9NX |
| Marlborough Place | SO41 9LX |
| Marram Close | SO41 9FN |
| Marsh Lane | SO41 9BX SO41 9EE |
| May Avenue | SO41 9DQ |
| Old Farmhouse Mews | SO41 9SX |
| Paddock Gardens | SO41 9ES |
| Pamplyn Close | SO41 9LD |
| Private Road | SO41 9EW |
| Redwood Close | SO41 9LT |
| Ricardo Way | SO41 8JU |
| Ringbury | SO41 9FH |
| Samber Close | SO41 9LE SO41 9LF |
| Samphire Close | SO41 9LR |
| Sarum Walk | SO41 8YA |
| Saxon Place | SO41 9EZ |
| Seaton Close | SO41 9LL |
| Shrubbs Avenue | SO41 9DJ SO41 9FL |
| Southampton Road | SO41 8NA SO41 8NP SO41 9GQ SO41 9GZ SO41 9HA SO41 8NT SO41 8NU |
| Spartina Drive | SO41 9FE |
| Stratford Place | SO41 9TL |
| Sway Road | SO41 8LR SO41 8NN SO41 8QU |
| The Rampart | SO41 9FR |
| The Rings | SO41 8QP |
| Tithe Barn | SO41 9EB SO41 9ED |
| Tylers Close | SO41 9AX SO41 9GY |
| Union Place | SO41 9NU SO41 9NT |
| Wellworthy Road | SO41 8JY SO41 8QD |
| William Road | SO41 9DZ |
| Woodley Gardens | SO41 9LH |
| SO41 9ZS |
Transport near Buckland
- FAQ
- Price Paid By Year
- Property Type Price
Frequently asked questions about Buckland
What is the average price for a property for sale in Buckland?
The average price for a property for sale in Buckland is £382,128. This amount is 36% lower than the average price in Lymington. There are 1,539 property listings for sale in Buckland.
What streets have the most expensive properties for sale in Buckland?
The streets with the most expensive properties for sale in Buckland are Southampton Road at an average of £960,000, Sway Road at an average of £786,500 and The Rings at an average of £660,000.
What streets have the most affordable properties for sale in Buckland?
The streets with the most affordable properties for sale in Buckland are Tylers Close at an average of £154,450, Bankhill Drive at an average of £202,142 and Hillditch at an average of £215,000.
Which train stations are available in or near Buckland?
Some of the train stations available in or near Buckland are Lymington Town, Lymington Pier and Sway.
Property Price Paid in Buckland by Year
The average sold property price by year was:
| Year | Average Sold Price | Price Change |
Sold Properties
|
|---|---|---|---|
| 2025 | £352,901 | -16% |
63 Properties |
| 2024 | £408,883 | 7% |
72 Properties |
| 2023 | £380,148 | -3% |
43 Properties |
| 2022 | £390,160 | 0,4% |
63 Properties |
| 2021 | £388,504 | -12% |
83 Properties |
| 2020 | £434,512 | 20% |
92 Properties |
| 2019 | £347,015 | 1% |
93 Properties |
| 2018 | £344,336 | 8% |
83 Properties |
| 2017 | £317,301 | 5% |
77 Properties |
| 2016 | £302,510 | -0,4% |
73 Properties |
| 2015 | £303,706 | 5% |
83 Properties |
| 2014 | £288,788 | 7% |
88 Properties |
| 2013 | £269,316 | 6% |
88 Properties |
| 2012 | £253,943 | -5% |
73 Properties |
| 2011 | £267,463 | 9% |
71 Properties |
| 2010 | £243,556 | 2% |
67 Properties |
| 2009 | £239,609 | -21% |
69 Properties |
| 2008 | £289,829 | 6% |
70 Properties |
| 2007 | £272,249 | 12% |
105 Properties |
| 2006 | £240,757 | 5% |
110 Properties |
| 2005 | £229,199 | 8% |
103 Properties |
| 2004 | £209,925 | 4% |
105 Properties |
| 2003 | £202,351 | 18% |
122 Properties |
| 2002 | £165,816 | 6% |
125 Properties |
| 2001 | £155,182 | 2% |
132 Properties |
| 2000 | £151,844 | 39% |
118 Properties |
| 1999 | £93,312 | 2% |
129 Properties |
| 1998 | £91,333 | 9% |
129 Properties |
| 1997 | £82,747 | 17% |
125 Properties |
| 1996 | £68,523 | 8% |
123 Properties |
| 1995 | £63,337 | - |
97 Properties |
Property Price per Property Type in Buckland
Here you can find historic sold price data in order to help with your property search.
The average Property Paid Price for specific property types in the last three years are:
| Property Type | Average Sold Price | Sold Properties |
|---|---|---|
| Semi Detached House | £385,257.00 | 56 Semi Detached Houses |
| Detached House | £612,268.00 | 40 Detached Houses |
| Terraced House | £323,811.00 | 51 Terraced Houses |
| Flat | £175,459.00 | 31 Flats |

