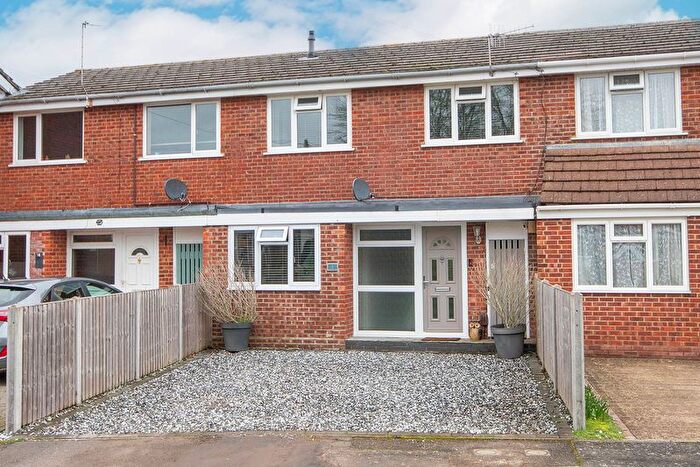
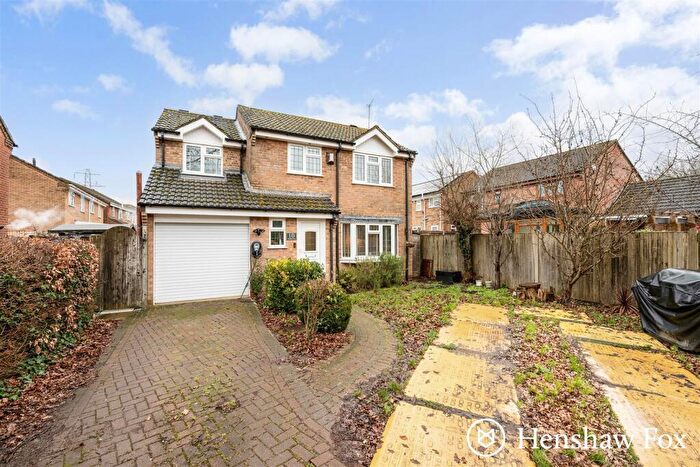
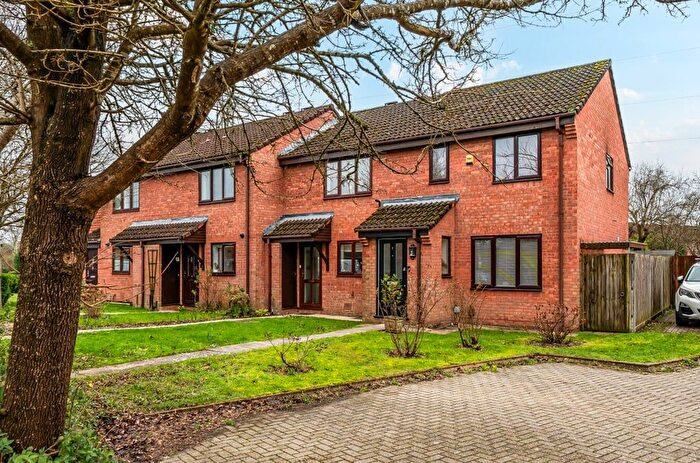
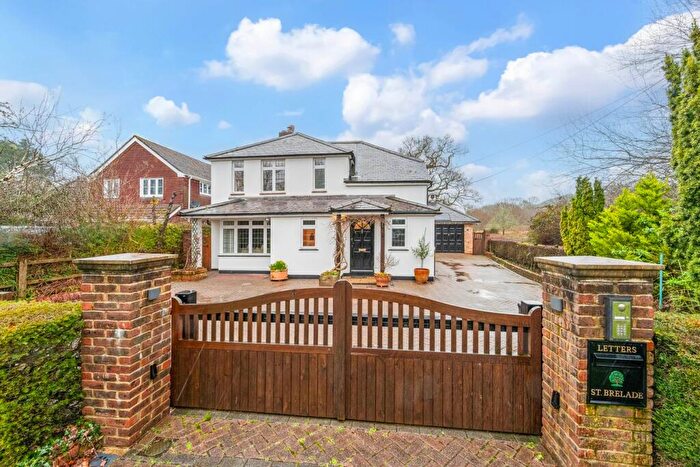
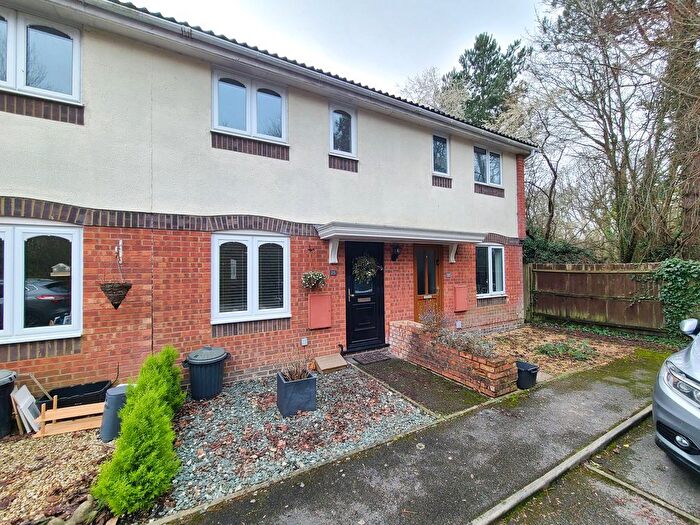
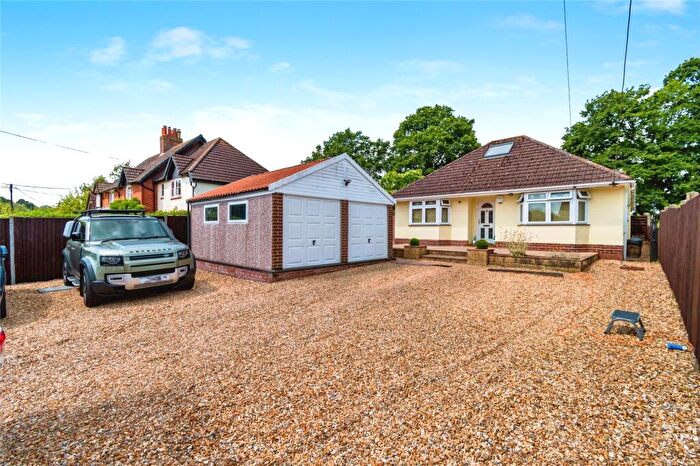
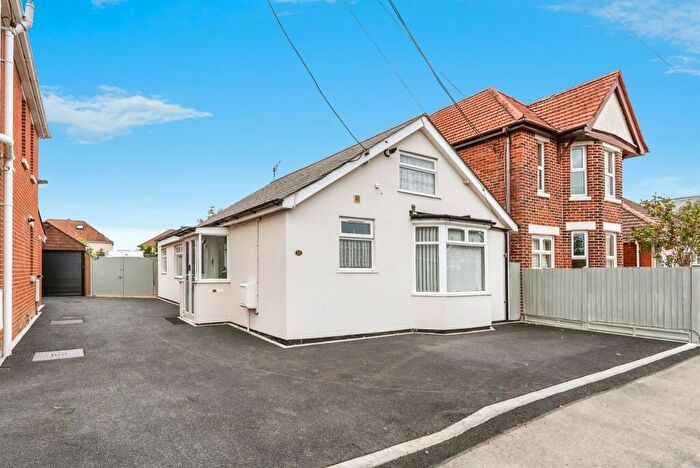
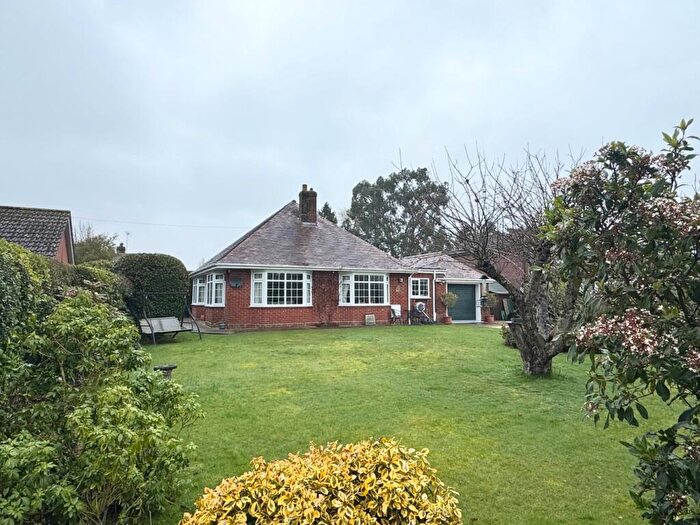
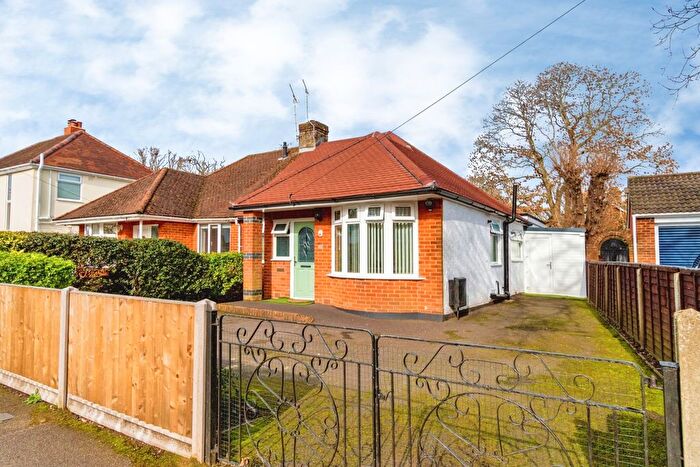
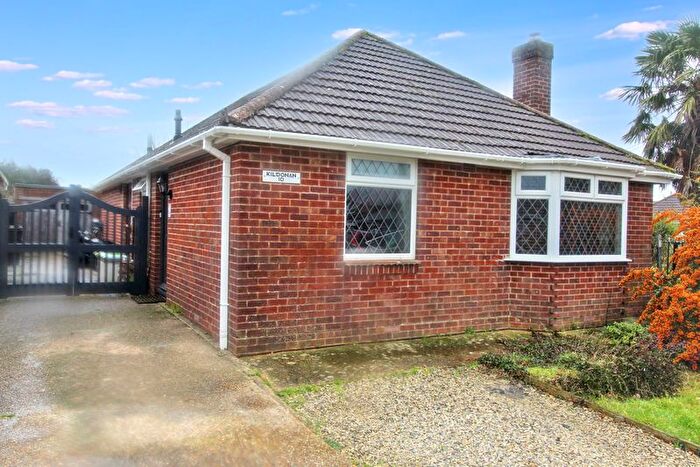
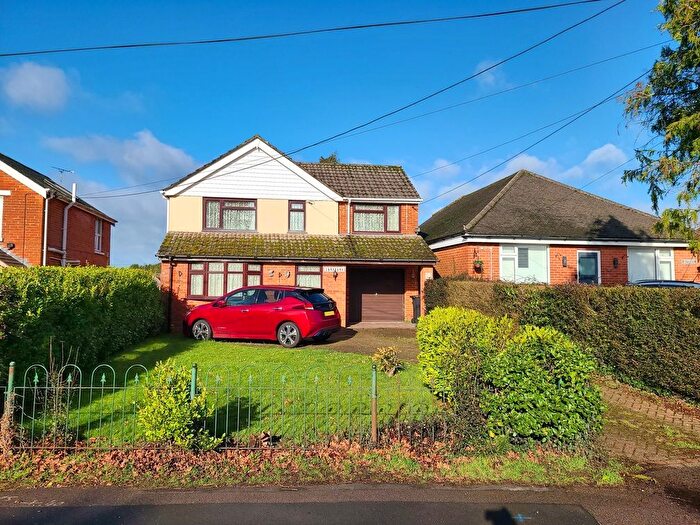
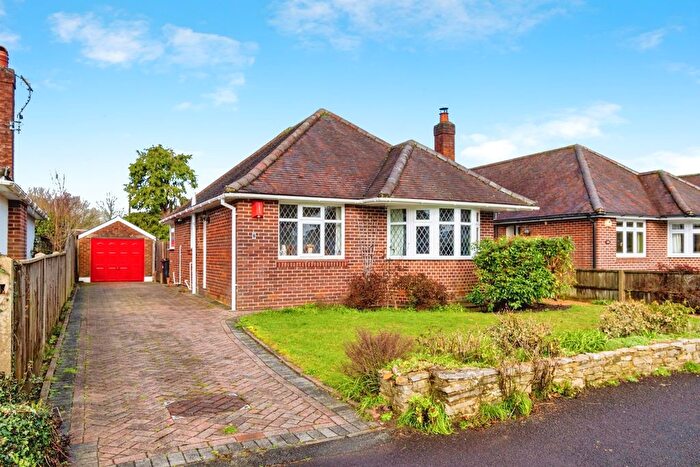
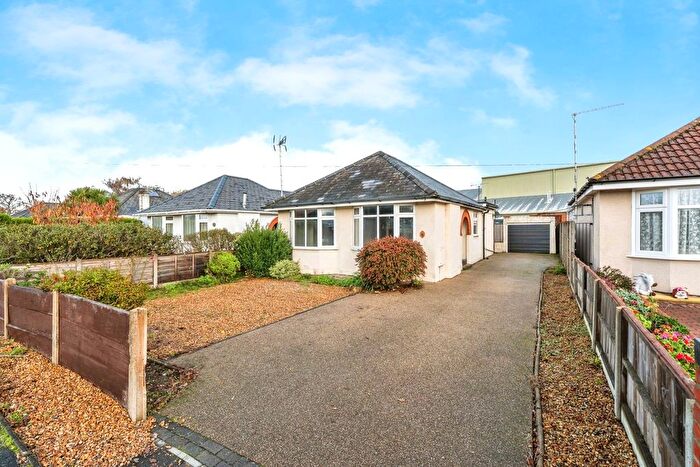
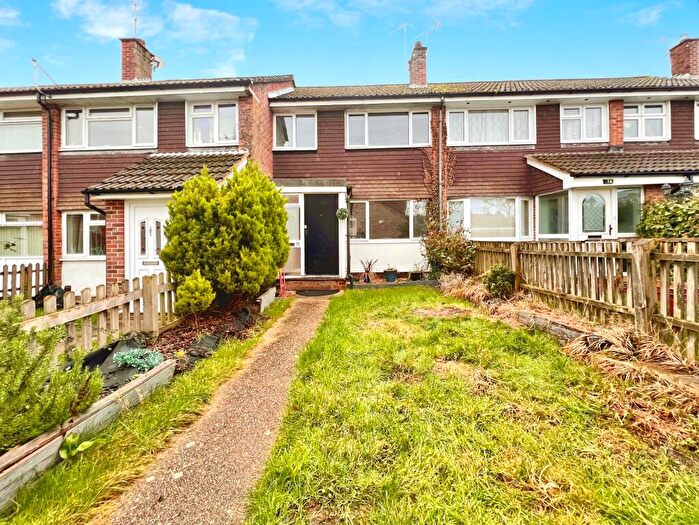
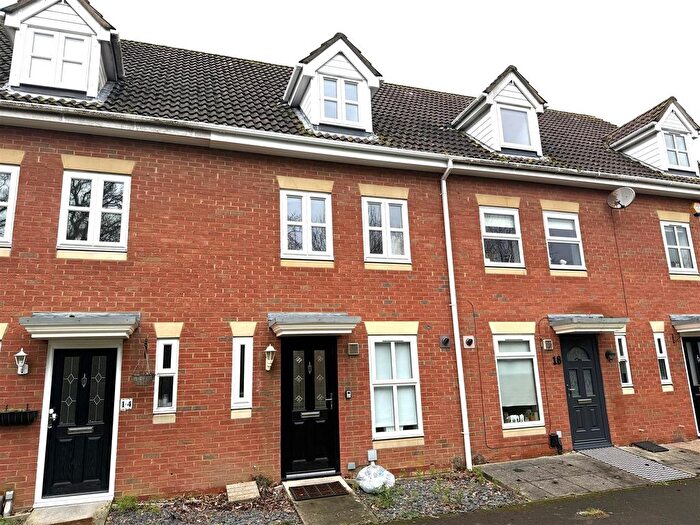
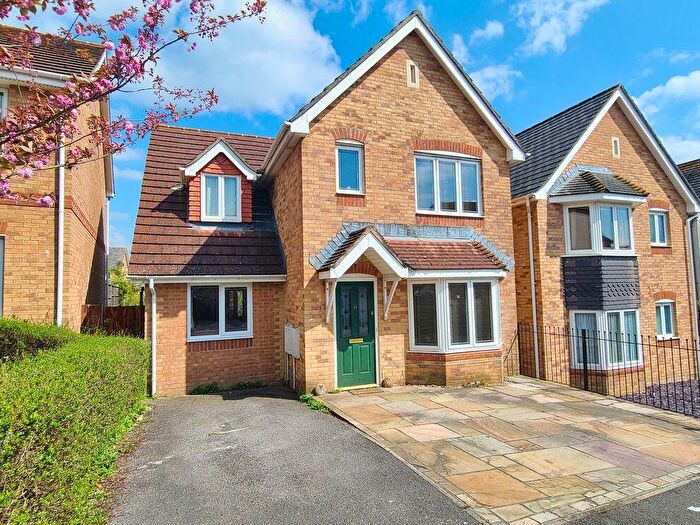
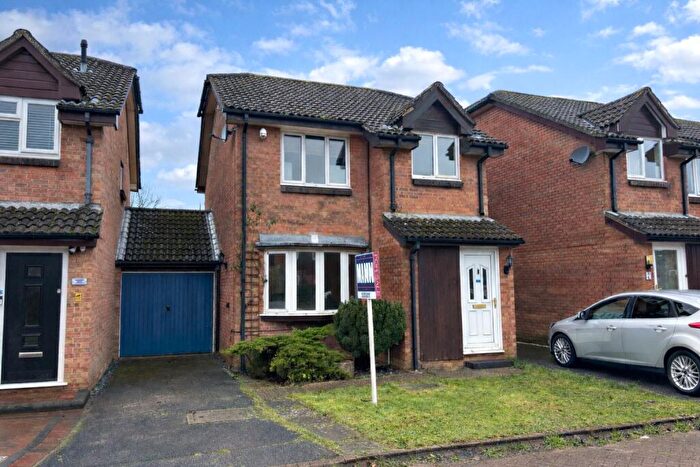
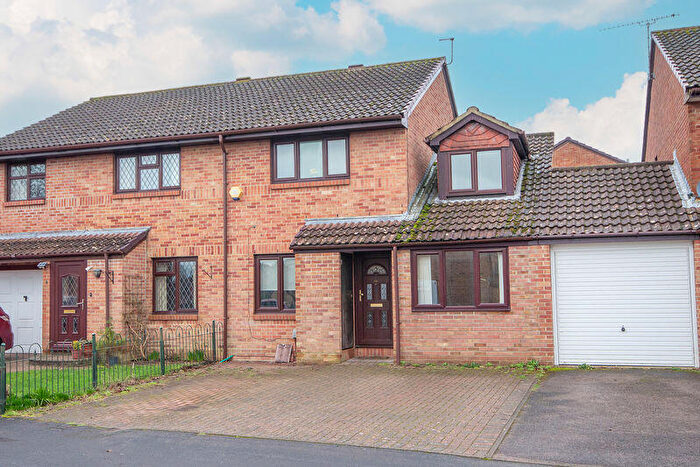
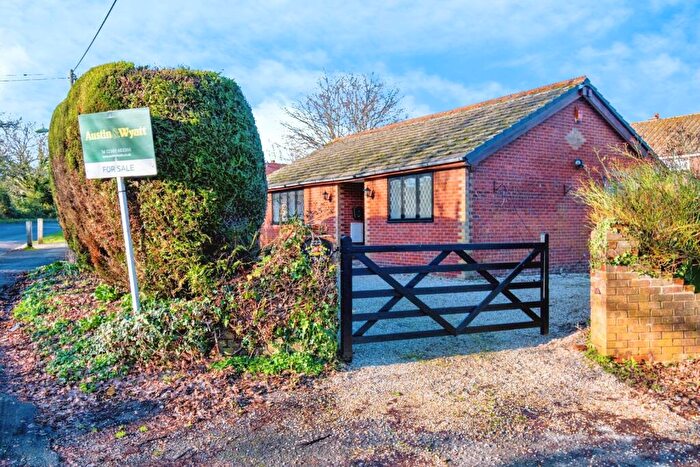
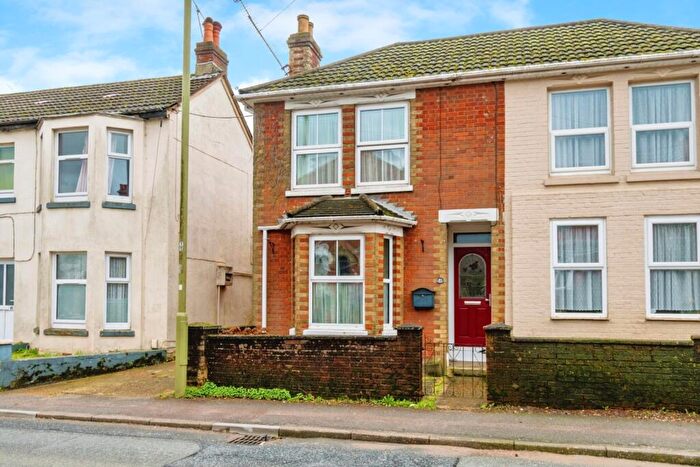
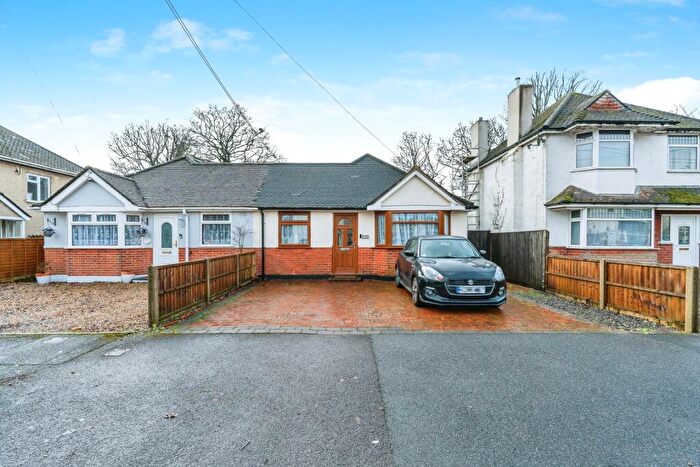
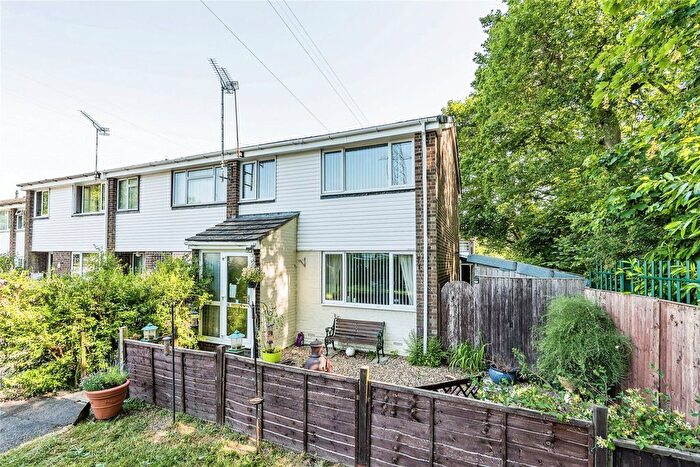
Houses for sale & to rent in Ashurst, Copythorne South And Netley Marsh, Southampton
House Prices in Ashurst, Copythorne South And Netley Marsh
Properties in Ashurst, Copythorne South And Netley Marsh have an average house price of £592,676.00 and had 188 Property Transactions within the last 3 years¹.
Ashurst, Copythorne South And Netley Marsh is an area in Southampton, Hampshire with 2,221 households², where the most expensive property was sold for £1,800,000.00.
Properties for sale in Ashurst, Copythorne South And Netley Marsh
Roads and Postcodes in Ashurst, Copythorne South And Netley Marsh
Navigate through our locations to find the location of your next house in Ashurst, Copythorne South And Netley Marsh, Southampton for sale or to rent.
| Streets | Postcodes |
|---|---|
| Abbotsford | SO40 2LU SO40 2PN |
| Alpine Road | SO40 7AN |
| Ash Grove | SO40 7BN |
| Ash Road | SO40 7AT |
| Ashdene Road | SO40 7BT SO40 7BW SO40 7DN SO40 7DP SO40 7DR SO40 7DS SO40 7DT |
| Ashurst Bridge Road | SO40 7EA |
| Ashurst Close | SO40 7BP SO40 7BQ |
| Barleycorn Walk | SO40 2LY |
| Barney Hayes Lane | SO40 2ND |
| Bartley Road | SO40 7GN SO40 7GP SO40 7GQ |
| Beech Road | SO40 7AY |
| Beechwood Road | SO40 2LP |
| Boakes Place | SO40 7FF |
| Bourne Lane | SO40 7GT SO40 7GW |
| Bourne Road | SO40 7GR SO40 2AU |
| Brookes Hill Industrial Estate | SO40 2QT |
| Busketts Way | SO40 7AE |
| Cecil Avenue | SO40 7BG |
| Chestnut Drive | SO40 7DW |
| Chinham Road | SO40 2LF SO40 2LL |
| Cooper Road | SO40 7DB SO40 7DE |
| Copsewood Road | SO40 7DL |
| Dene Road | SO40 7BJ SO40 7BL |
| Dene Way | SO40 7BX SO40 7BZ SO40 7DA |
| Eadens Lane | SO40 2LB |
| Elmtree Close | SO40 7FD |
| Farm Lane | SO40 7AX |
| Fir Road | SO40 7AZ |
| Fir Tree Road | SO40 2LX |
| Fletchwood Lane | SO40 7AG SO40 7DZ |
| Fletchwood Road | SO40 7DX |
| Forest Way | SO40 2PZ |
| Foxhills | SO40 7ED |
| Foxhills Close | SO40 7ER |
| Green Close | SO40 7HU |
| Hazel Grove | SO40 7AJ |
| Hill Street | SO40 2RX |
| Holly Road | SO40 7BA |
| Hunters Hill | SO40 7EG |
| Kennington Lane | SO40 2NE |
| Knellers Lane | SO40 7EB |
| Knightwood Close | SO40 7FE |
| Lakewood Road | SO40 7DF SO40 7DG SO40 7DH SO40 7DJ |
| Lanesbridge Close | SO40 7GG |
| Loperwood | SO40 2RT SO40 2TA |
| Loperwood Lane | SO40 2RR |
| Lyndhurst Road | SO40 7AR SO40 7AS SO40 7AU SO40 7AW SO40 7BE SO40 7DU |
| Martins Lane | SO40 7GZ |
| Millvina Close | SO40 7LE |
| New Inn Lane | SO40 2LS |
| New Inn Road | SO40 2LR |
| New Road | SO40 7BR SO40 7BS |
| Nichols Corner | SO40 2LN |
| Oakfield Road | SO40 2LQ |
| Old Cross Road | SO40 2PP |
| Old Lyndhurst Road | SO40 2NL |
| Old Romsey Road | SO40 2NP |
| Paradise Lane | SO40 7GS |
| Peterscroft Avenue | SO40 7AB |
| Pine Close | SO40 7BU |
| Priestlands Close | SO40 7GD |
| Princess Road | SO40 7BB |
| Pundle Green | SO40 2LG |
| Purkiss Close | SO40 7HS |
| Ringwood Road | SO40 7GX SO40 7GY SO40 7LA SO40 7LD SO40 7HT SO40 7LT |
| Riverside Close | SO40 2LW |
| Rockram Close | SO40 2SA |
| Romsey Road | SO40 2LZ SO40 2NN |
| Rossiters Lane | SO40 7HX |
| Rye Dale | SO40 7DQ |
| Salisbury Road | SO40 2RQ SO40 2RW |
| Shepherds Close | SO40 2LJ |
| Shepherds Road | SO40 2LH |
| Southampton Road | SO40 2NA SO40 2NB SO40 2NF SO40 2NG SO40 2NH SO40 2NQ |
| Tatchbury Lane | SO40 2GZ SO40 2HA |
| Tatchbury Mount | SO40 2RN SO40 2RP |
| The Copse | SO40 7GU |
| The Crescent | SO40 7AQ |
| The Lane | SO40 2PQ |
| Vixen Close | SO40 7ET |
| Western Totton By Pass | SO40 8AF |
| Whartons Close | SO40 7EE |
| Whartons Lane | SO40 7EF |
| White Hart Lane | SO40 2NJ |
| Whitemoor | SO40 2HB |
| Wingrove Road | SO40 7DD |
| Winsor Lane | SO40 2HH |
| Wood Road | SO40 7BD |
| Woodlands Drive | SO40 7HW |
| Woodlands Drove | SO40 7FB |
| Woodlands Road | SO40 7AD SO40 7AF SO40 7AH SO40 7AL SO40 7AP SO40 7BH SO40 7GA SO40 7GB SO40 7GE SO40 7GF SO40 7GH SO40 7GJ SO40 7GL |
| Woodside Gardens | SO40 7BY |
| SO40 2NR SO40 2RZ |
Transport near Ashurst, Copythorne South And Netley Marsh
-
Ashurst New Forest Station
-
Totton Station
-
Redbridge Station
-
Beaulieu Road Station
-
Millbrook (Hampshire) Station
- FAQ
- Price Paid By Year
- Property Type Price
Frequently asked questions about Ashurst, Copythorne South And Netley Marsh
What is the average price for a property for sale in Ashurst, Copythorne South And Netley Marsh?
The average price for a property for sale in Ashurst, Copythorne South And Netley Marsh is £592,676. This amount is 53% higher than the average price in Southampton. There are 2,734 property listings for sale in Ashurst, Copythorne South And Netley Marsh.
What streets have the most expensive properties for sale in Ashurst, Copythorne South And Netley Marsh?
The streets with the most expensive properties for sale in Ashurst, Copythorne South And Netley Marsh are The Crescent at an average of £1,350,000, Tatchbury Lane at an average of £1,175,000 and Salisbury Road at an average of £1,150,000.
What streets have the most affordable properties for sale in Ashurst, Copythorne South And Netley Marsh?
The streets with the most affordable properties for sale in Ashurst, Copythorne South And Netley Marsh are Boakes Place at an average of £329,600, Beechwood Road at an average of £347,500 and Woodside Gardens at an average of £355,000.
Which train stations are available in or near Ashurst, Copythorne South And Netley Marsh?
Some of the train stations available in or near Ashurst, Copythorne South And Netley Marsh are Ashurst New Forest, Totton and Redbridge.
Property Price Paid in Ashurst, Copythorne South And Netley Marsh by Year
The average sold property price by year was:
| Year | Average Sold Price | Price Change |
Sold Properties
|
|---|---|---|---|
| 2025 | £593,995 | 3% |
58 Properties |
| 2024 | £573,993 | -8% |
79 Properties |
| 2023 | £620,117 | -5% |
51 Properties |
| 2022 | £653,241 | 13% |
73 Properties |
| 2021 | £566,720 | 2% |
86 Properties |
| 2020 | £554,743 | 12% |
69 Properties |
| 2019 | £487,549 | -1% |
59 Properties |
| 2018 | £491,201 | -5% |
67 Properties |
| 2017 | £514,900 | 13% |
61 Properties |
| 2016 | £449,149 | 9% |
67 Properties |
| 2015 | £409,868 | -2% |
66 Properties |
| 2014 | £419,879 | 10% |
71 Properties |
| 2013 | £379,555 | 0,3% |
78 Properties |
| 2012 | £378,234 | -5% |
54 Properties |
| 2011 | £396,145 | 4% |
48 Properties |
| 2010 | £381,806 | 19% |
67 Properties |
| 2009 | £310,733 | -16% |
53 Properties |
| 2008 | £360,450 | -26% |
50 Properties |
| 2007 | £454,214 | 23% |
87 Properties |
| 2006 | £351,945 | 4% |
103 Properties |
| 2005 | £338,131 | 10% |
91 Properties |
| 2004 | £305,844 | 3% |
79 Properties |
| 2003 | £296,358 | 10% |
81 Properties |
| 2002 | £266,249 | 22% |
78 Properties |
| 2001 | £207,874 | 1% |
95 Properties |
| 2000 | £205,701 | 25% |
74 Properties |
| 1999 | £154,253 | 7% |
104 Properties |
| 1998 | £142,920 | 9% |
91 Properties |
| 1997 | £129,884 | 13% |
92 Properties |
| 1996 | £113,637 | 8% |
91 Properties |
| 1995 | £104,280 | - |
82 Properties |
Property Price per Property Type in Ashurst, Copythorne South And Netley Marsh
Here you can find historic sold price data in order to help with your property search.
The average Property Paid Price for specific property types in the last three years are:
| Property Type | Average Sold Price | Sold Properties |
|---|---|---|
| Semi Detached House | £457,526.00 | 38 Semi Detached Houses |
| Detached House | £647,976.00 | 140 Detached Houses |
| Flat | £272,666.00 | 3 Flats |
| Terraced House | £357,500.00 | 7 Terraced Houses |

