
Houses for sale & to rent in SO16 7QH, Chilworth Grange, Chilworth, Nursling And Rownhams, Southampton
House Prices in SO16 7QH, Chilworth Grange, Chilworth, Nursling And Rownhams
Properties in SO16 7QH have no sales history available within the last 3 years. SO16 7QH is a postcode in Chilworth Grange located in Chilworth, Nursling And Rownhams, an area in Southampton, Hampshire, with 6 households².
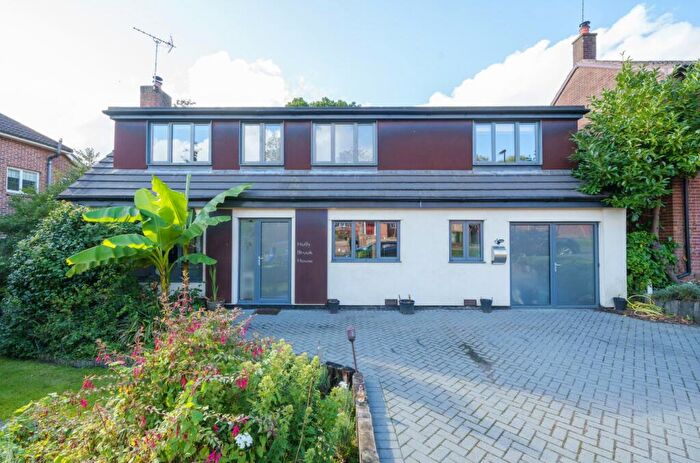
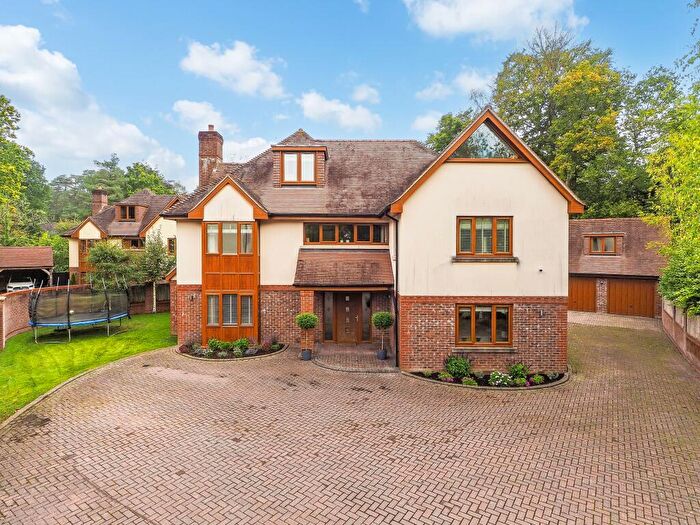
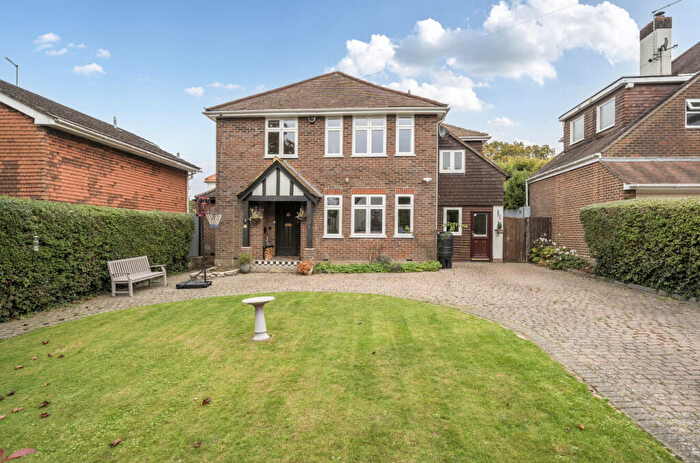
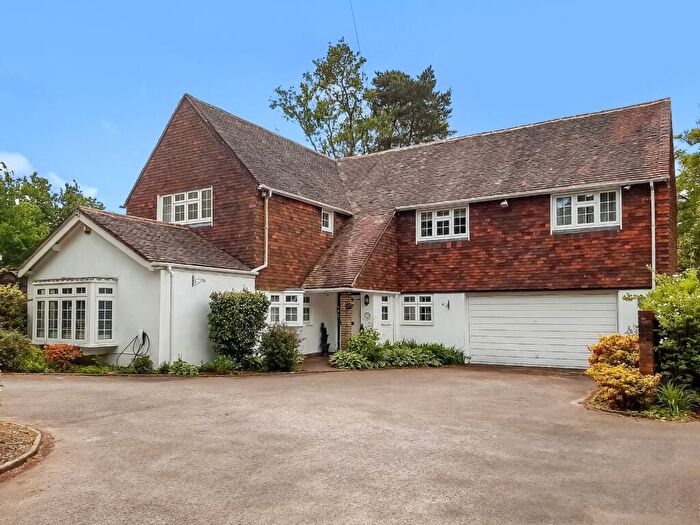
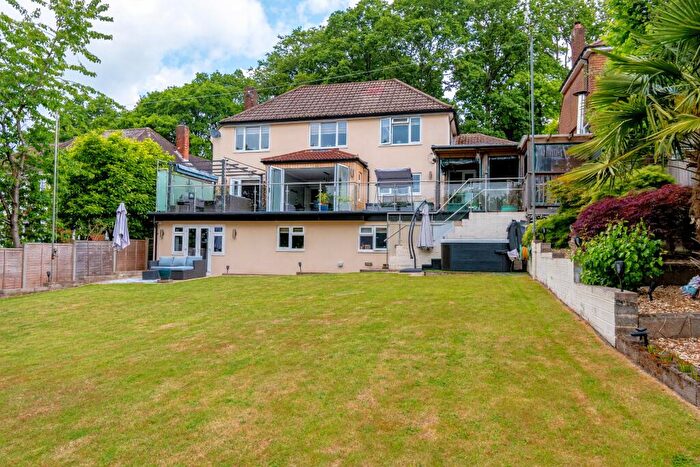
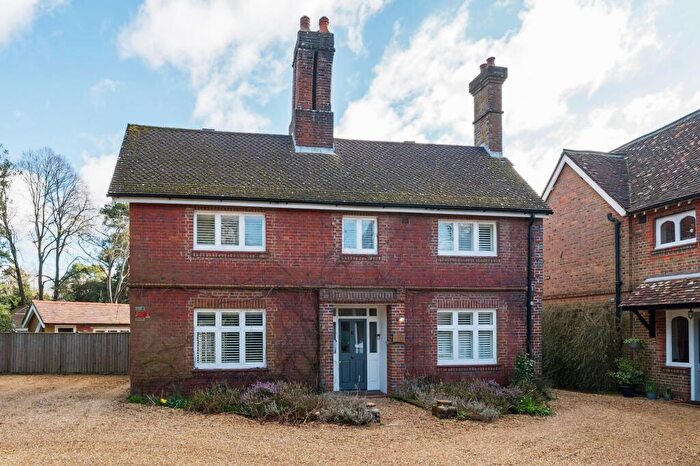
Properties for sale near SO16 7QH, Chilworth Grange


![]()
If you are looking to sell your house, let it out, or receive a property valuation, an expert can help you.
Click the button below to get started.

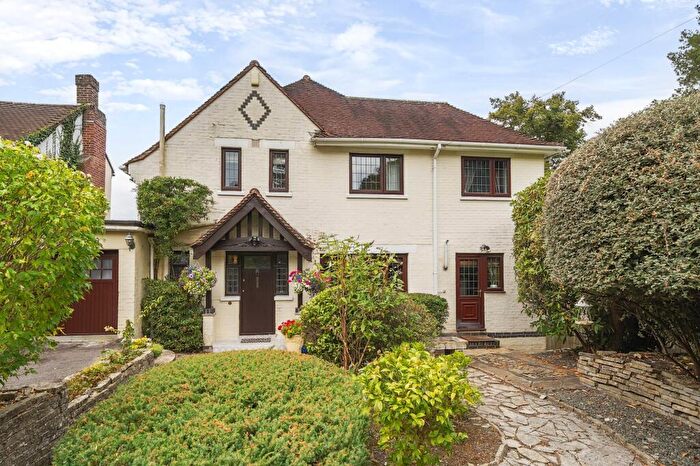

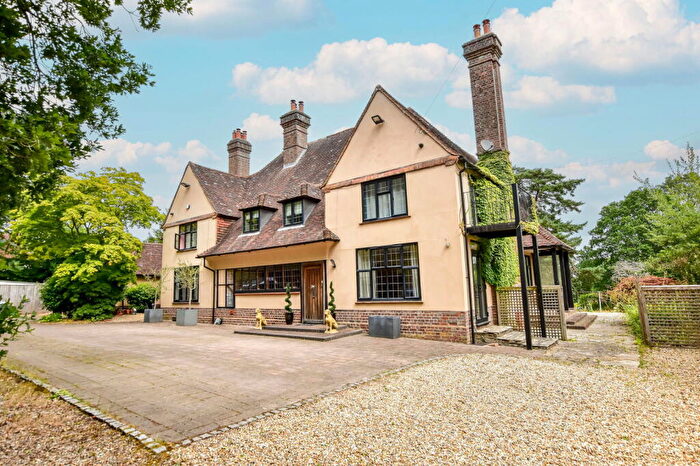
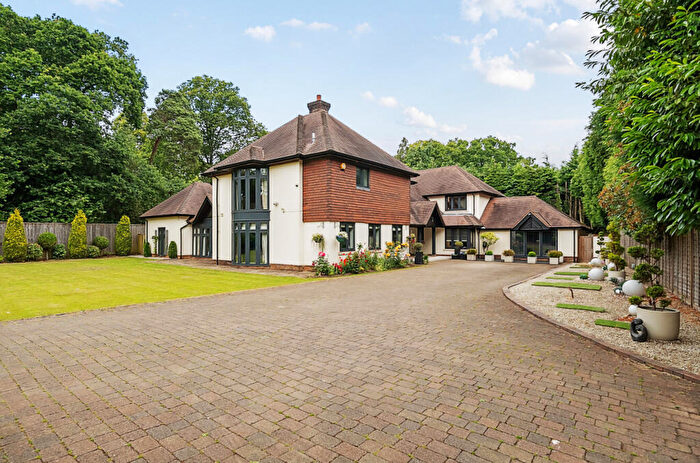

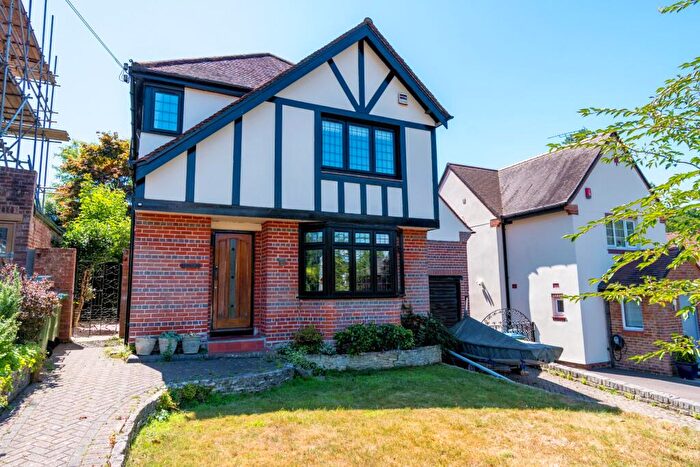
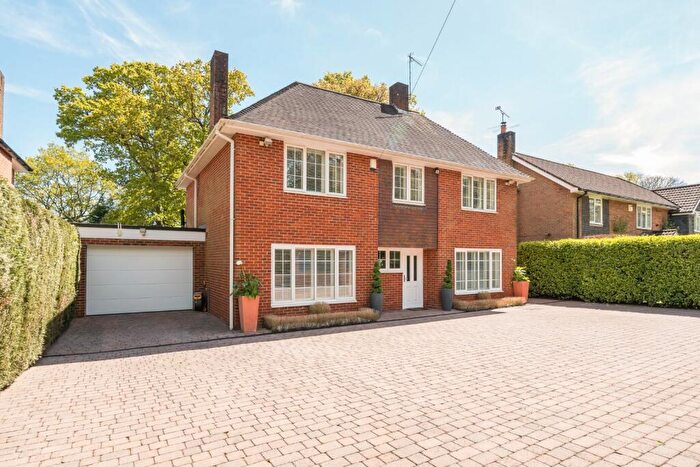
Previously listed properties near SO16 7QH, Chilworth Grange
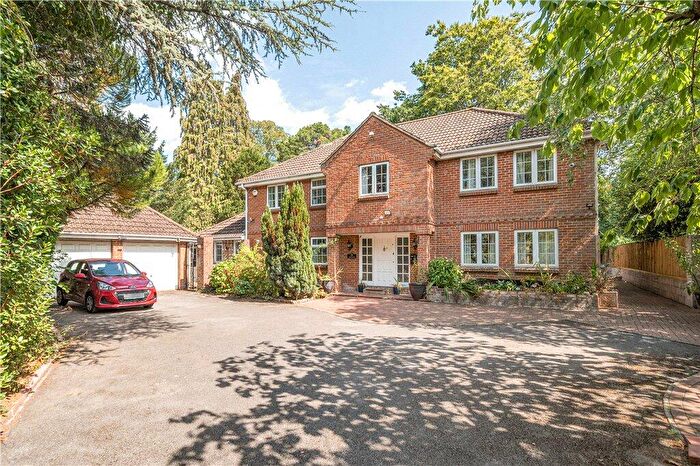

![]()
If you are looking to sell your house, let it out, or receive a property valuation, an expert can help you.
Click the button below to get started.
Price Paid in Chilworth Grange, SO16 7QH, Chilworth, Nursling And Rownhams
4 Chilworth Grange, SO16 7QH, Chilworth, Nursling And Rownhams Southampton
Property 4 has been sold 2 times. The last time it was sold was in 08/01/2016 and the sold price was £1,200,000.00.
This detached house, sold as a freehold on 08/01/2016, is a 384 sqm detached house with an EPC rating of D.
| Date | Price | Property Type | Tenure | Classification |
|---|---|---|---|---|
| 08/01/2016 | £1,200,000.00 | Detached House | freehold | Established Building |
| 29/06/2001 | £625,000.00 | Detached House | freehold | New Build |
2 Chilworth Grange, SO16 7QH, Chilworth, Nursling And Rownhams Southampton
Property 2 has been sold 3 times. The last time it was sold was in 12/12/2012 and the sold price was £1,450,000.00.
This detached house, sold as a freehold on 12/12/2012, is a 462 sqm detached house with an EPC rating of C.
| Date | Price | Property Type | Tenure | Classification |
|---|---|---|---|---|
| 12/12/2012 | £1,450,000.00 | Detached House | freehold | Established Building |
| 25/08/2004 | £1,090,000.00 | Detached House | freehold | Established Building |
| 29/03/2001 | £715,000.00 | Detached House | freehold | New Build |
6 Chilworth Grange, SO16 7QH, Chilworth, Nursling And Rownhams Southampton
Property 6 has been sold 3 times. The last time it was sold was in 01/10/2010 and the sold price was £897,500.00.
This detached house, sold as a freehold on 01/10/2010, is a 252 sqm detached house with an EPC rating of D.
| Date | Price | Property Type | Tenure | Classification |
|---|---|---|---|---|
| 01/10/2010 | £897,500.00 | Detached House | freehold | Established Building |
| 12/03/2003 | £975,000.00 | Detached House | freehold | Established Building |
| 29/06/2001 | £182,500.00 | Detached House | freehold | New Build |
5 Chilworth Grange, SO16 7QH, Chilworth, Nursling And Rownhams Southampton
Property 5 has been sold 3 times. The last time it was sold was in 18/12/2009 and the sold price was £1,300,000.00.
This detached house, sold as a freehold on 18/12/2009, is a 349 sqm detached house with an EPC rating of D.
| Date | Price | Property Type | Tenure | Classification |
|---|---|---|---|---|
| 18/12/2009 | £1,300,000.00 | Detached House | freehold | Established Building |
| 05/08/2005 | £980,000.00 | Detached House | freehold | Established Building |
| 29/06/2001 | £182,500.00 | Detached House | freehold | New Build |
1 Chilworth Grange, SO16 7QH, Chilworth, Nursling And Rownhams Southampton
Property 1 has been sold 3 times. The last time it was sold was in 14/02/2008 and the sold price was £1,462,500.00.
This is a Detached House which was sold as a freehold in 14/02/2008
| Date | Price | Property Type | Tenure | Classification |
|---|---|---|---|---|
| 14/02/2008 | £1,462,500.00 | Detached House | freehold | Established Building |
| 14/02/2003 | £1,000,000.00 | Detached House | freehold | Established Building |
| 31/01/2001 | £750,000.00 | Detached House | freehold | New Build |
3 Chilworth Grange, SO16 7QH, Chilworth, Nursling And Rownhams Southampton
Property 3 has been sold 3 times. The last time it was sold was in 20/06/2006 and the sold price was £860,000.00.
This detached house, sold as a freehold on 20/06/2006, is a 516 sqm detached house with an EPC rating of C.
| Date | Price | Property Type | Tenure | Classification |
|---|---|---|---|---|
| 20/06/2006 | £860,000.00 | Detached House | freehold | Established Building |
| 22/11/2004 | £700,000.00 | Detached House | freehold | Established Building |
| 31/05/2001 | £655,000.00 | Detached House | freehold | New Build |
Transport near SO16 7QH, Chilworth Grange
-
 Swaythling Station
 -
Chandlers Ford Station
-
Southampton Airport (Parkway) Station
-
Eastleigh Station
-
St.Denys Station
House price paid reports for SO16 7QH, Chilworth Grange
Click on the buttons below to see price paid reports by year or property price:
- Price Paid By Year
Property Price Paid in SO16 7QH, Chilworth Grange by Year
The average sold property price by year was:
| Year | Average Sold Price | Price Change |
Sold Properties
|
|---|---|---|---|
| 2016 | £1,200,000 | -21% |
1 Property |
| 2012 | £1,450,000 | 38% |
1 Property |
| 2010 | £897,500 | -45% |
1 Property |
| 2009 | £1,300,000 | -13% |
1 Property |
| 2008 | £1,462,500 | 41% |
1 Property |
| 2006 | £860,000 | -14% |
1 Property |
| 2005 | £980,000 | 9% |
1 Property |
| 2004 | £895,000 | -10% |
2 Properties |
| 2003 | £987,500 | 48% |
2 Properties |
| 2001 | £518,333 | - |
6 Properties |