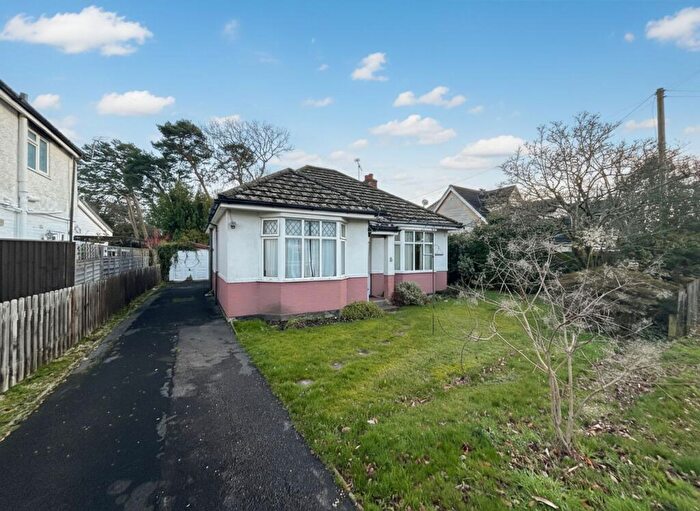
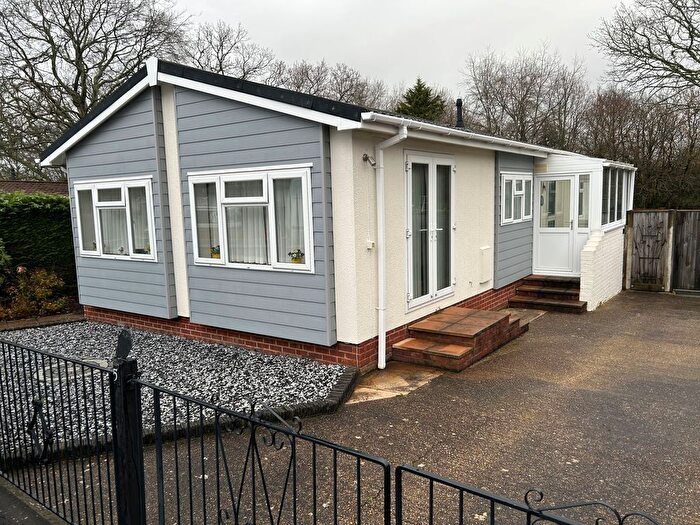
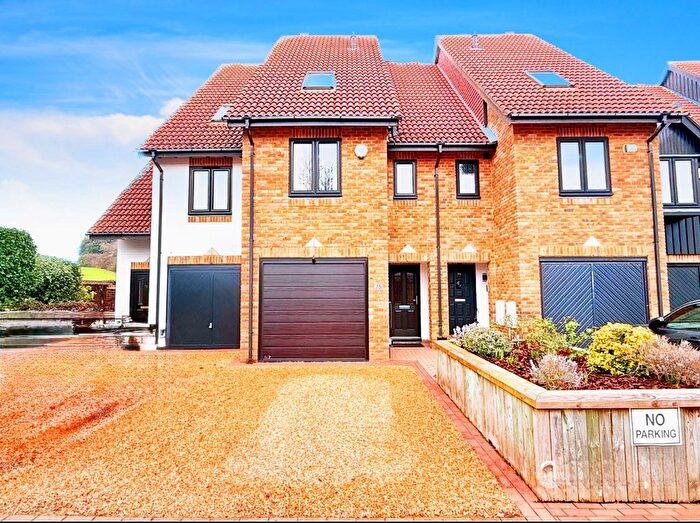
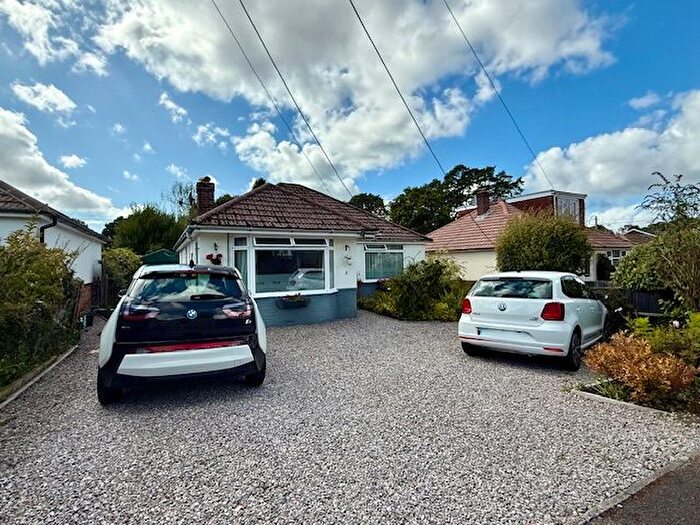
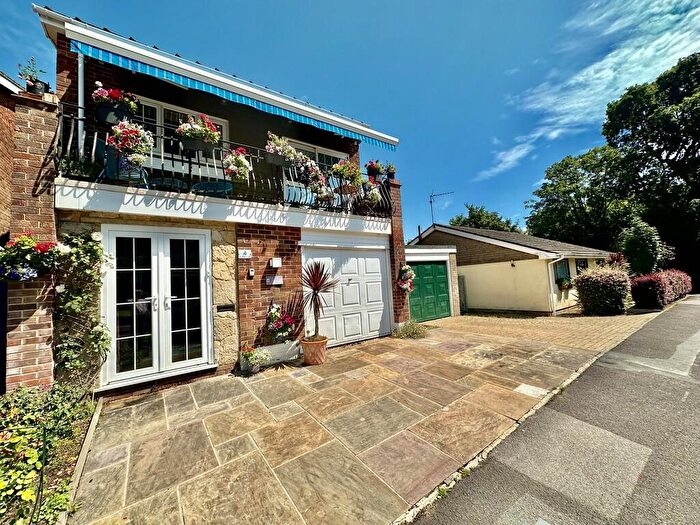
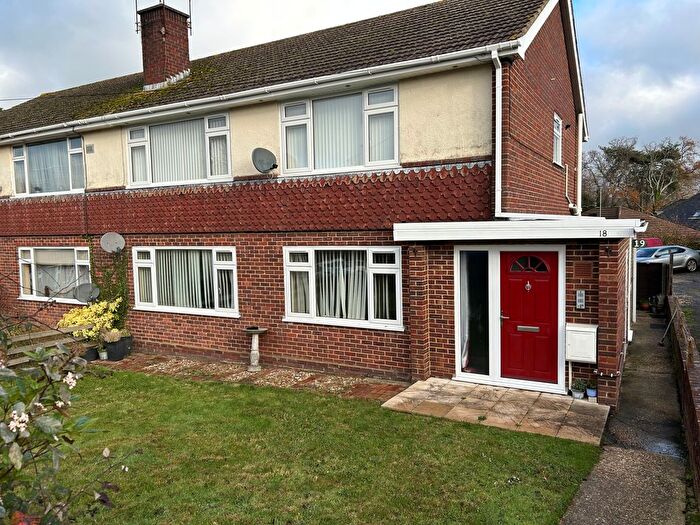
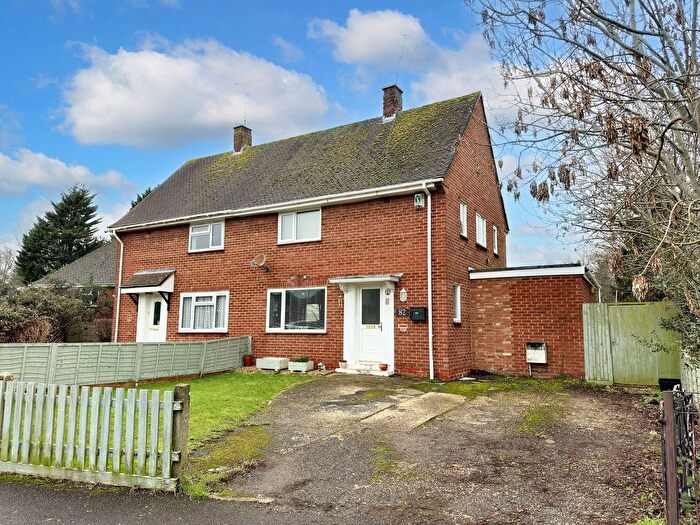
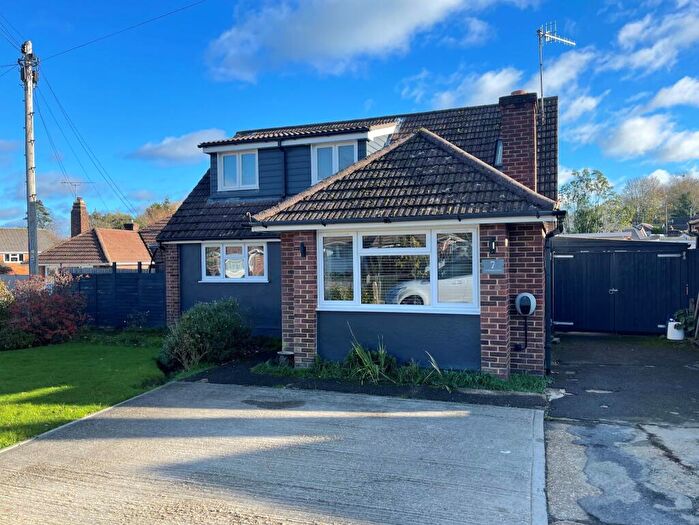
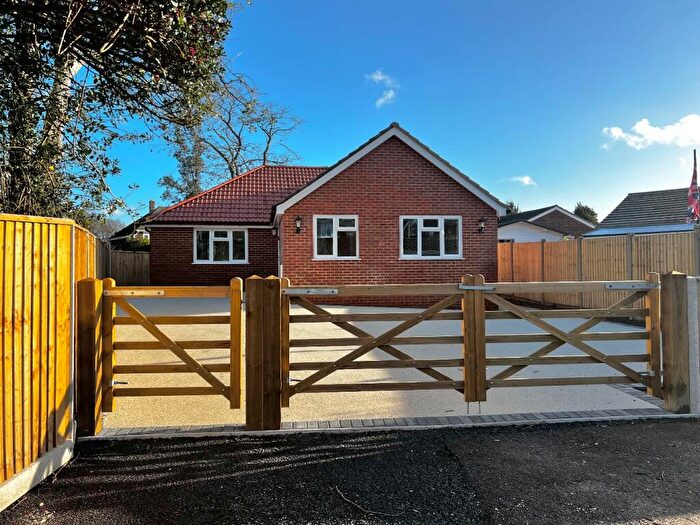
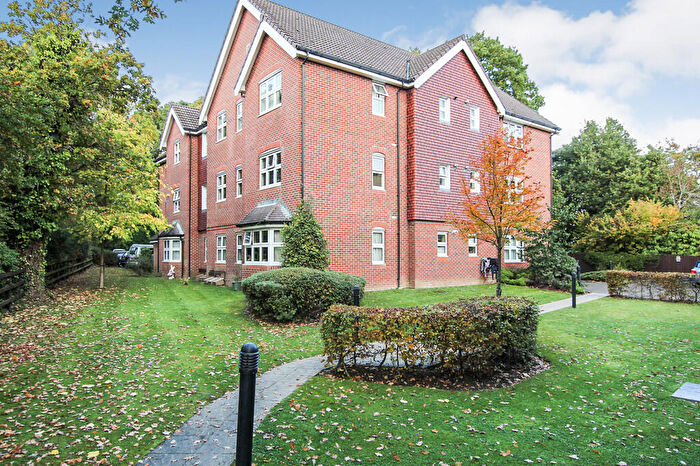
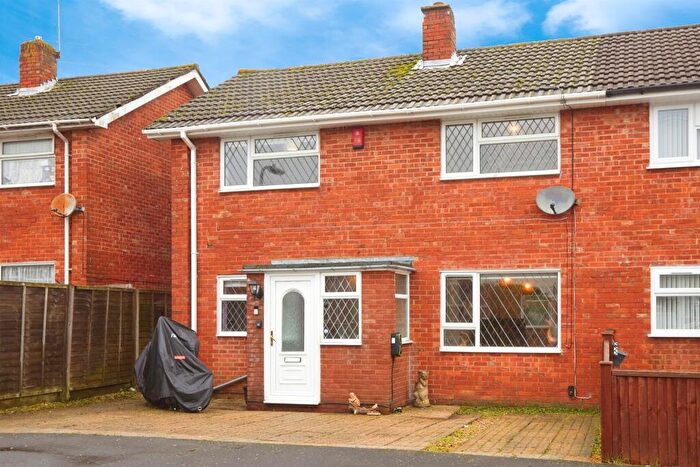
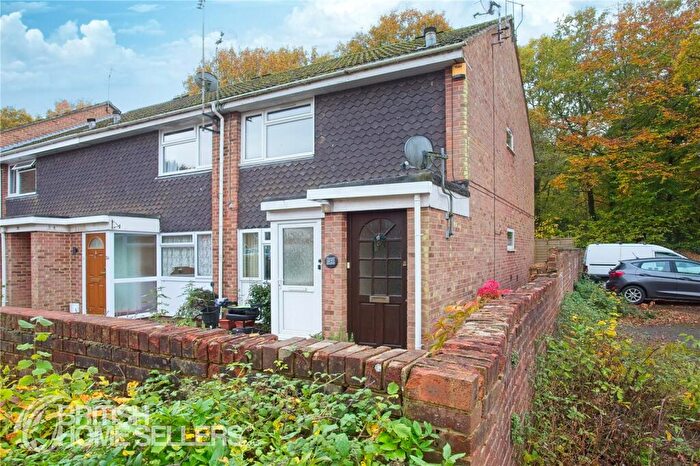
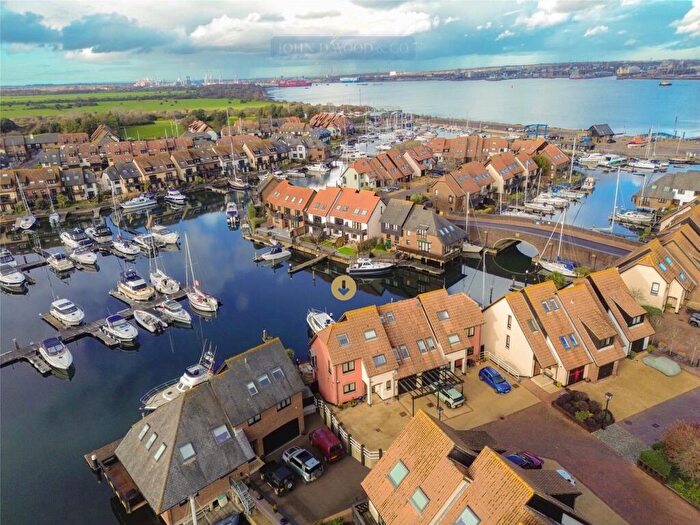
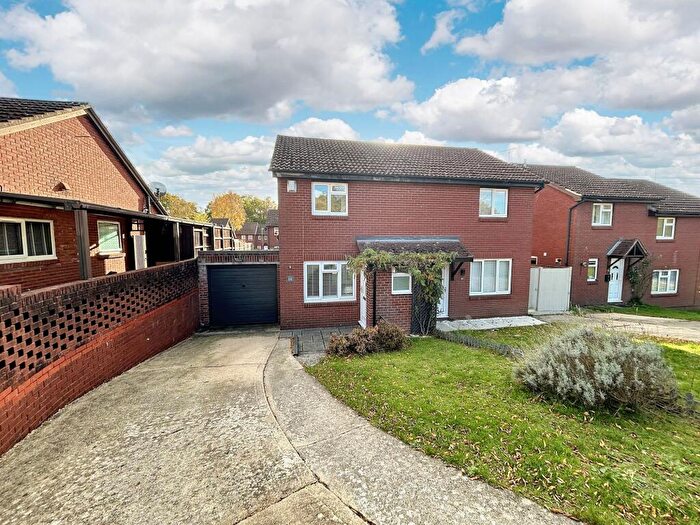
Houses for sale & to rent in Dibden And Hythe East, Southampton
House Prices in Dibden And Hythe East
Properties in Dibden And Hythe East have an average house price of £348,762.00 and had 341 Property Transactions within the last 3 years¹.
Dibden And Hythe East is an area in Southampton, Hampshire with 2,653 households², where the most expensive property was sold for £1,850,000.00.
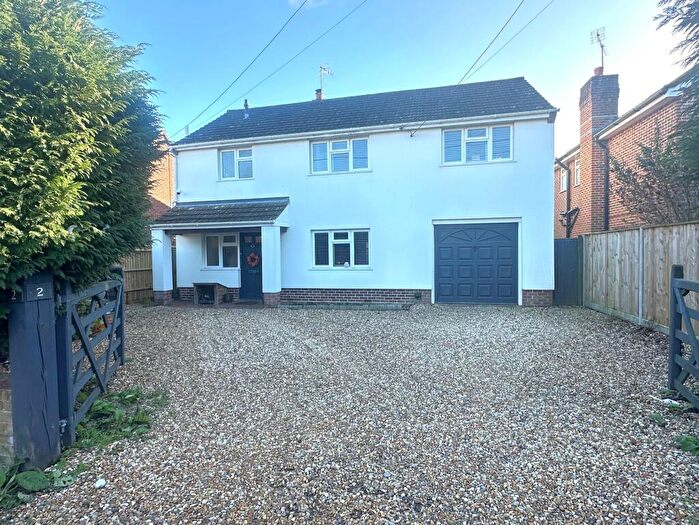
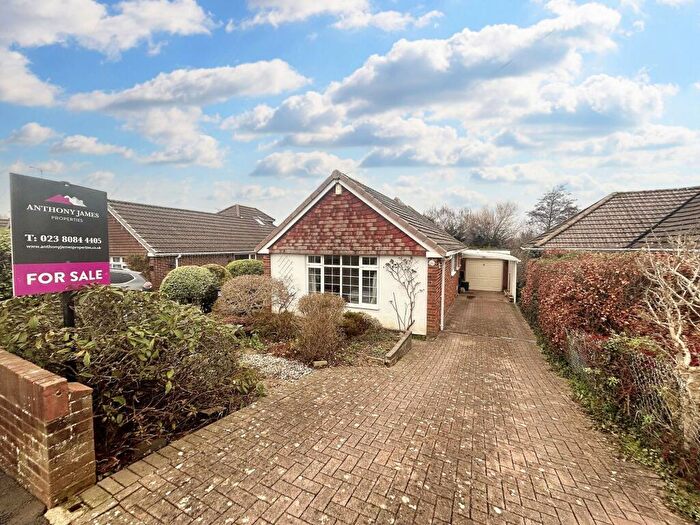
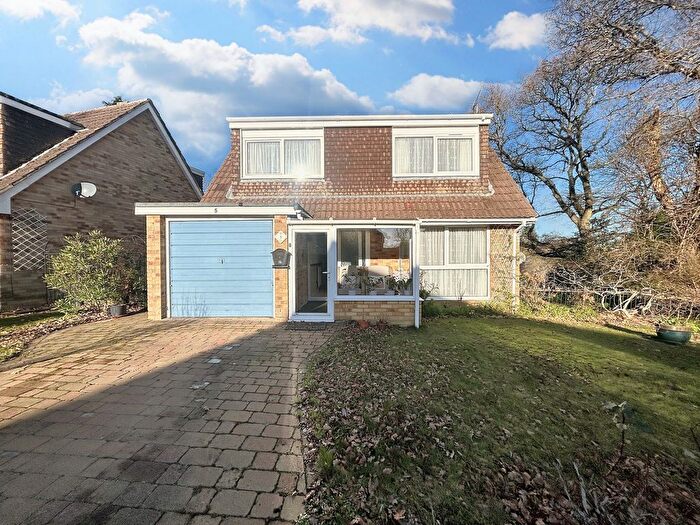
Properties for sale in Dibden And Hythe East
Roads and Postcodes in Dibden And Hythe East
Navigate through our locations to find the location of your next house in Dibden And Hythe East, Southampton for sale or to rent.
| Streets | Postcodes |
|---|---|
| Admirals Way | SO45 6RU |
| Alder Close | SO45 5SJ |
| Alexandra Close | SO45 6BB |
| Alexandra Road | SO45 6BA |
| Ashburton Close | SO45 5UZ |
| Astra Court | SO45 6DZ |
| Atheling Road | SO45 6BR SO45 6BS |
| Beaumaris Gardens | SO45 6QA |
| Beechwood Way | SO45 5WQ SO45 5WR |
| Blackdown Close | SO45 5QS |
| Blenheim Gardens | SO45 4RW |
| Brecon Close | SO45 5QX |
| Brendon Close | SO45 5SQ |
| Briarswood Rise | SO45 5SW |
| Brinton Lane | SO45 6EE SO45 6DU |
| Brocks Close | SO45 5ST |
| Broomy Close | SO45 5WB |
| Buchan Court | SO45 5WU |
| Cabot Drive | SO45 5UG SO45 5UQ |
| Caledonia Drive | SO45 5UA |
| Cambria Drive | SO45 5UW |
| Canterbury Drive | SO45 5UU |
| Capella Gardens | SO45 5UE |
| Carpenter Close | SO45 6DR SO45 6GR |
| Cathay Gardens | SO45 5TY |
| Cavalier Close | SO45 5TU |
| Challenger Place | SO45 5SZ |
| Cheviot Drive | SO45 5TZ |
| Church Farm Close | SO45 5TF SO45 5TG |
| Claypits Lane | SO45 5TN |
| Cleveland Drive | SO45 5QR |
| Cordelia Close | SO45 5UD |
| Corinna Gardens | SO45 5UB |
| Corsair Drive | SO45 5UF |
| Cosworth Drive | SO45 5UN SO45 5UP |
| Cotswold Close | SO45 5QW |
| Court House Close | SO45 6PA |
| Courtier Close | SO45 5UJ |
| Cromalt Close | SO45 5SR |
| Cumberland Way | SO45 5TW SO45 5TX |
| Cygnus Gardens | SO45 5UH |
| Dibden Lodge Close | SO45 6AY |
| Downwood Close | SO45 5SU |
| Drapers Copse | SO45 5TQ SO45 5TR |
| Drummond Road | SO45 6BE |
| Edward Road | SO45 6BD |
| Endeavour Way | SO45 6DX SO45 6LA |
| Eyeworth Walk | SO45 5WF |
| Fernlea Way | SO45 5SG |
| Fletcher Close | SO45 5UY |
| Hawkhill | SO45 5WE |
| High Street | SO45 6AG SO45 6AH SO45 6YW |
| Hollydene Villas | SO45 4HU |
| Hotspur Close | SO45 6DP |
| Huxley Court | SO45 5WW |
| Jessop Close | SO45 6AF |
| Jessop Walk | SO45 6DH |
| Jones Lane | SO45 6AW SO45 6AX SO45 6DG SO45 6GH SO45 6GL |
| Kensington Fields | SO45 5RX |
| Kiln Close | SO45 5EU |
| Latchmore Drive | SO45 5WA |
| Lewis Close | SO45 5WT |
| Locks Cottages | SO45 5TS |
| Longmeadow Gardens | SO45 6BQ |
| Magnolia Close | SO45 5HF |
| Main Road | SO45 5TB SO45 5TD SO45 5TE |
| Malvern Drive | SO45 5QY |
| Manor Road | SO45 5TJ |
| Mariners Mews | SO45 6FW |
| Marsh Parade | SO45 6AN |
| Mendip Gardens | SO45 5QT |
| Milne Close | SO45 5WS |
| Moorland Close | SO45 5SH |
| Morris Close | SO45 5UX |
| Mount House Close | SO45 6AE |
| Mousehole Lane | SO45 6BT |
| Nash Road | SO45 4RR |
| New Road | SO45 6BN SO45 6BP |
| North Road | SO45 4ZF |
| Oakenbrow | SO45 5SL |
| Oaklands Way | SO45 5SS |
| Ocknell Grove | SO45 5WD |
| Pennine Gardens | SO45 5RZ |
| Pentland Close | SO45 5SP |
| Percy Close | SO45 6AS |
| Prospect Place | SO45 6AT SO45 6HD SO45 6AU |
| Pylewell Road | SO45 6AQ SO45 6AR SO45 6AP SO45 6ZL |
| Ranmore Court | SO45 5WJ |
| Redwood Close | SO45 5SN |
| Ridgewood Close | SO45 5WH |
| Rockery Close | SO45 5HE |
| Rockram Gardens | SO45 5WL |
| Roman Road | SO45 4RQ |
| Rooksbridge | SO45 5WG |
| Round Copse | SO45 5WN |
| Roys Copse | SO45 5TH |
| Rushpole Court | SO45 5WP |
| School Road | SO45 6BG SO45 6BH SO45 6BJ SO45 6BL |
| Shamrock Way | SO45 6DY |
| Sizer Way | SO45 5JA |
| South Street | SO45 6EB |
| Southampton Road | SO45 5AA SO45 5DA SO45 5GP SO45 5HT |
| St Johns Street | SO45 6BZ SO45 6DA |
| The Brackens | SO45 5RY |
| The Marsh | SO45 6AJ SO45 6AL SO45 6YU SO45 6ZB |
| The Orchard | SO45 5UR |
| The Promenade | SO45 6DS |
| The Quantocks | SO45 5QU |
| The Sylvans | SO45 5SF |
| Upper Mullins Lane | SO45 5AG |
| Vaughan Road | SO45 5UL |
| Veals Lane | SO40 4WW |
| Velsheda Court | SO45 6DW |
| Water Lane | SO45 4SB |
| Waterside | SO45 6AB SO45 6AD |
| Waterside Square | SO45 6AZ |
| West Hill Drive | SO45 6DL SO45 6DN |
| West Street | SO45 6AA |
| Westcliff Walk | SO45 6BY |
| White Heather Court | SO45 6DT |
| SO45 1RW SO45 5SY SO45 5TP SO45 5UT SO45 5XP SO45 5ZP SO45 6GS SO45 6WG SO45 9AS SO45 9AW SO45 9AY SO45 9AZ SO45 9BA SO45 9BB |
Transport near Dibden And Hythe East
- FAQ
- Price Paid By Year
- Property Type Price
Frequently asked questions about Dibden And Hythe East
What is the average price for a property for sale in Dibden And Hythe East?
The average price for a property for sale in Dibden And Hythe East is £348,762. This amount is 11% lower than the average price in Southampton. There are 1,467 property listings for sale in Dibden And Hythe East.
What streets have the most expensive properties for sale in Dibden And Hythe East?
The streets with the most expensive properties for sale in Dibden And Hythe East are White Heather Court at an average of £1,110,833, Astra Court at an average of £800,000 and Atheling Road at an average of £712,000.
What streets have the most affordable properties for sale in Dibden And Hythe East?
The streets with the most affordable properties for sale in Dibden And Hythe East are The Quantocks at an average of £119,500, Brinton Lane at an average of £144,268 and The Brackens at an average of £169,285.
Which train stations are available in or near Dibden And Hythe East?
Some of the train stations available in or near Dibden And Hythe East are Woolston, Southampton Central and Sholing.
Property Price Paid in Dibden And Hythe East by Year
The average sold property price by year was:
| Year | Average Sold Price | Price Change |
Sold Properties
|
|---|---|---|---|
| 2025 | £344,152 | 1% |
66 Properties |
| 2024 | £339,810 | -3% |
88 Properties |
| 2023 | £349,151 | -3% |
77 Properties |
| 2022 | £358,417 | -0,1% |
110 Properties |
| 2021 | £358,699 | 7% |
198 Properties |
| 2020 | £332,754 | 16% |
90 Properties |
| 2019 | £278,266 | -12% |
105 Properties |
| 2018 | £311,421 | 11% |
100 Properties |
| 2017 | £275,613 | -1% |
120 Properties |
| 2016 | £278,935 | -3% |
124 Properties |
| 2015 | £285,996 | 15% |
122 Properties |
| 2014 | £244,348 | -1% |
143 Properties |
| 2013 | £246,109 | 8% |
104 Properties |
| 2012 | £226,989 | -3% |
80 Properties |
| 2011 | £233,120 | -2% |
109 Properties |
| 2010 | £238,214 | 5% |
82 Properties |
| 2009 | £226,611 | -3% |
97 Properties |
| 2008 | £234,165 | 6% |
74 Properties |
| 2007 | £220,721 | -2% |
177 Properties |
| 2006 | £224,223 | 14% |
164 Properties |
| 2005 | £193,572 | 3% |
109 Properties |
| 2004 | £187,270 | 4% |
146 Properties |
| 2003 | £179,644 | 13% |
168 Properties |
| 2002 | £156,269 | 8% |
182 Properties |
| 2001 | £143,852 | 14% |
193 Properties |
| 2000 | £123,709 | 16% |
158 Properties |
| 1999 | £104,485 | -5% |
233 Properties |
| 1998 | £109,924 | 23% |
278 Properties |
| 1997 | £84,237 | 3% |
219 Properties |
| 1996 | £81,456 | 4% |
182 Properties |
| 1995 | £78,328 | - |
118 Properties |
Property Price per Property Type in Dibden And Hythe East
Here you can find historic sold price data in order to help with your property search.
The average Property Paid Price for specific property types in the last three years are:
| Property Type | Average Sold Price | Sold Properties |
|---|---|---|
| Flat | £223,942.00 | 98 Flats |
| Semi Detached House | £348,958.00 | 66 Semi Detached Houses |
| Detached House | £528,143.00 | 86 Detached Houses |
| Terraced House | £313,515.00 | 91 Terraced Houses |

