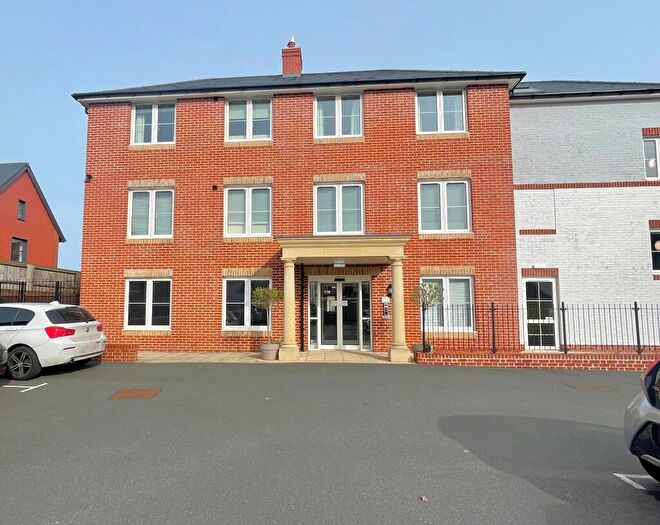
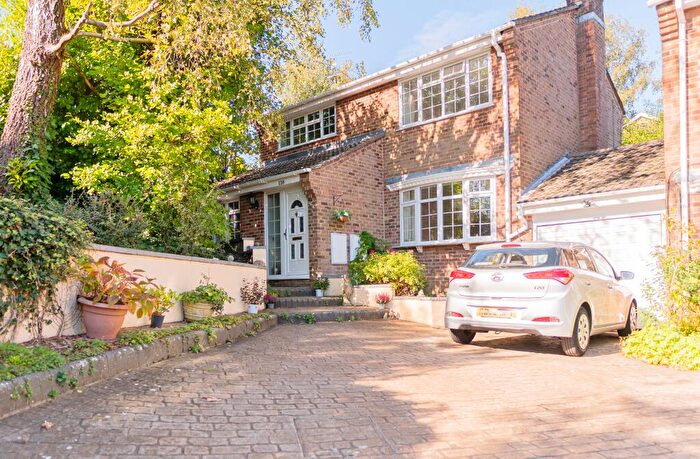
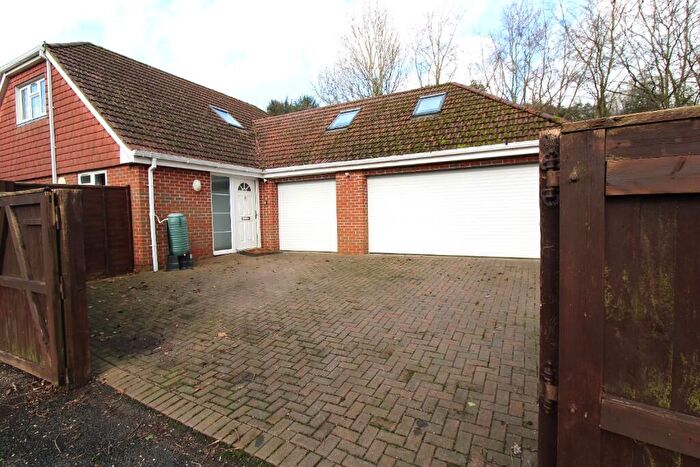
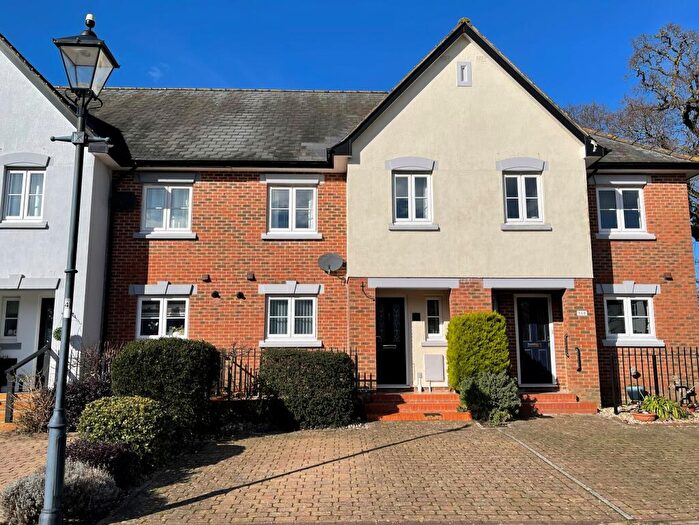
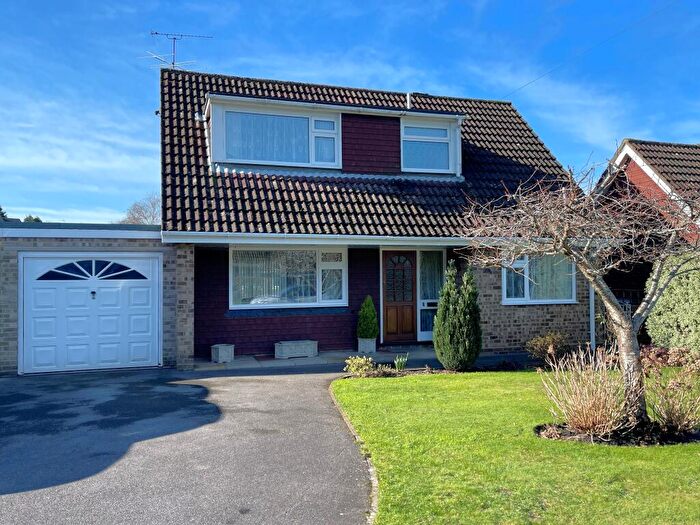
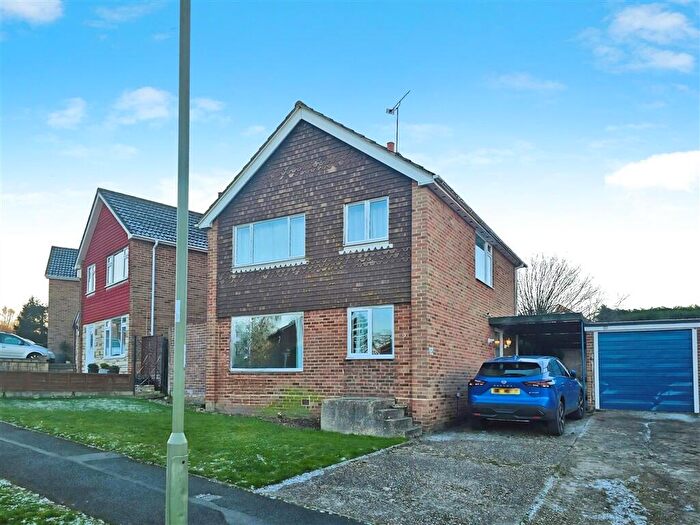
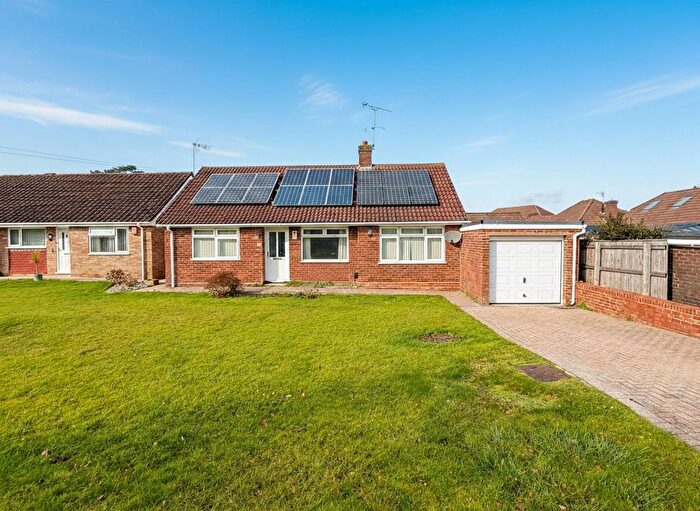
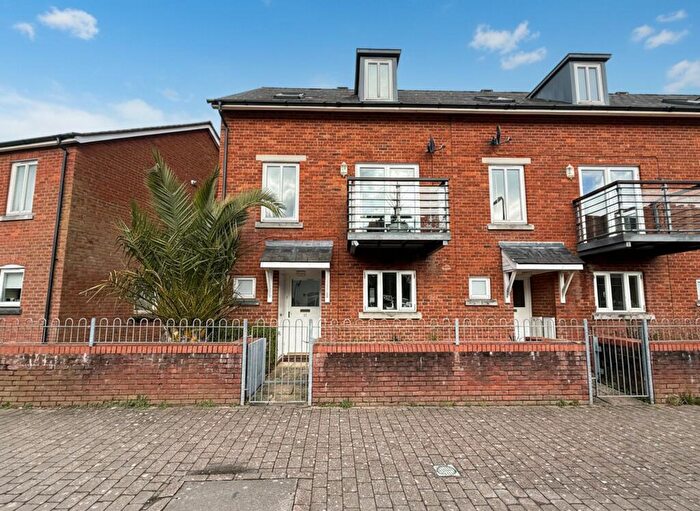
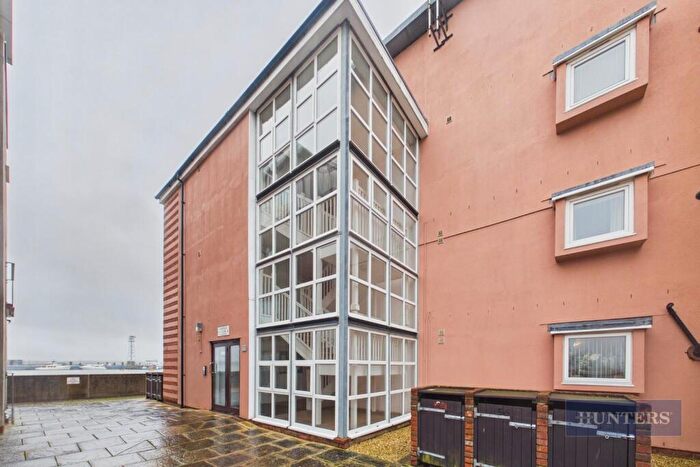
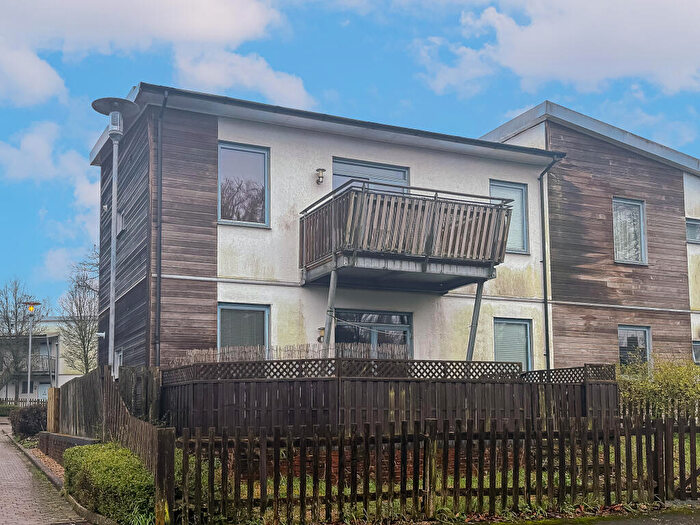
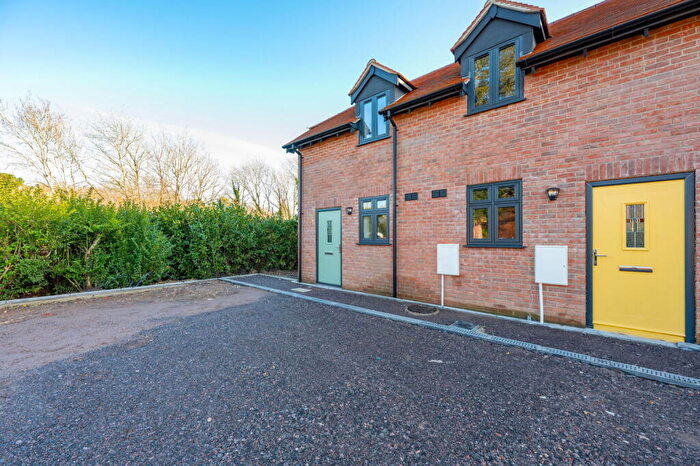
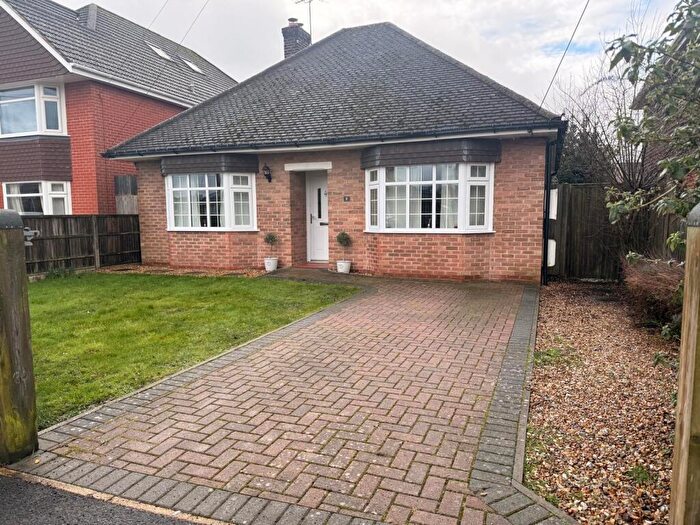
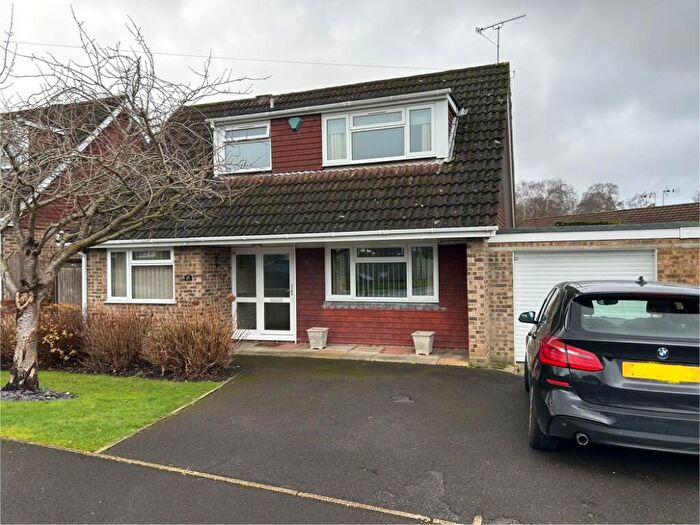
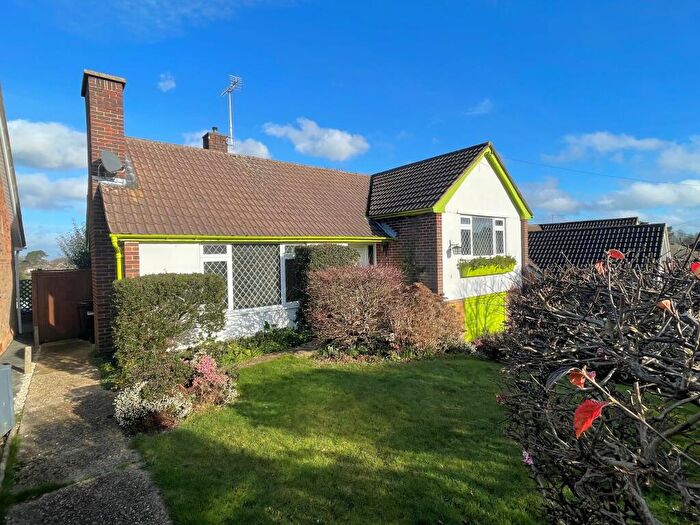
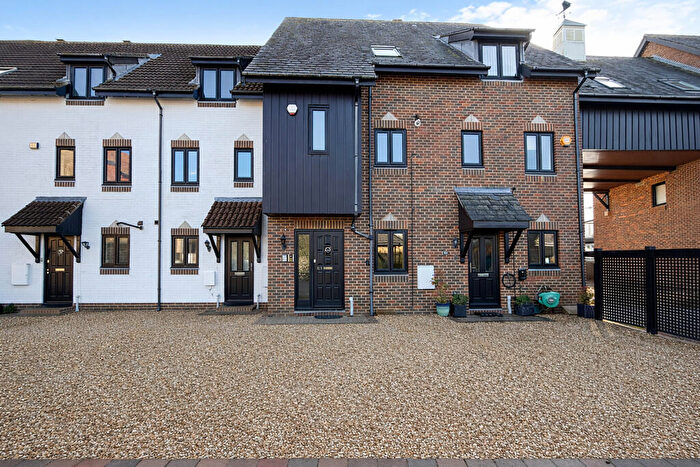
Houses for sale & to rent in Hythe West And Langdown, Southampton
House Prices in Hythe West And Langdown
Properties in Hythe West And Langdown have an average house price of £342,800.00 and had 244 Property Transactions within the last 3 years¹.
Hythe West And Langdown is an area in Southampton, Hampshire with 2,919 households², where the most expensive property was sold for £765,000.00.
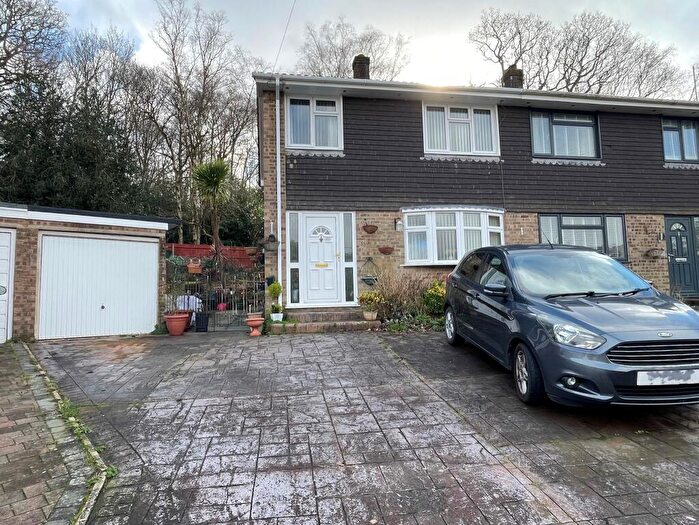
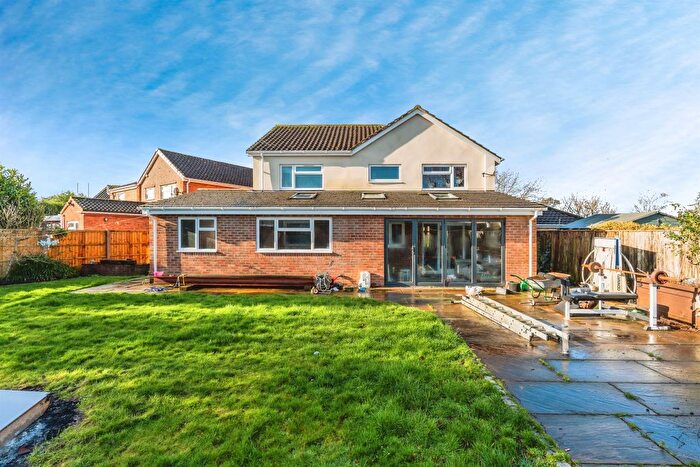
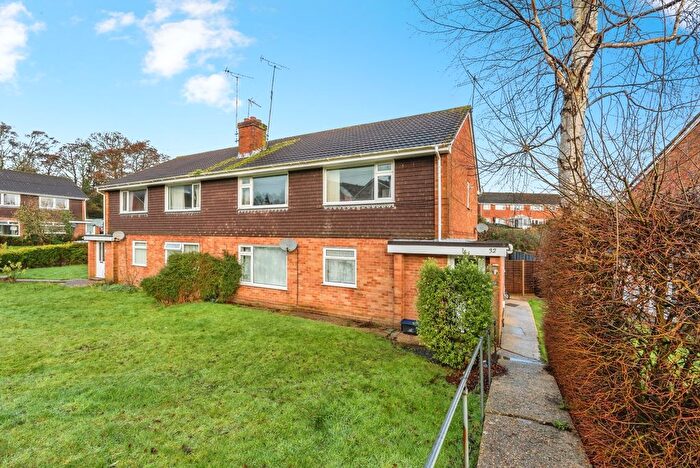
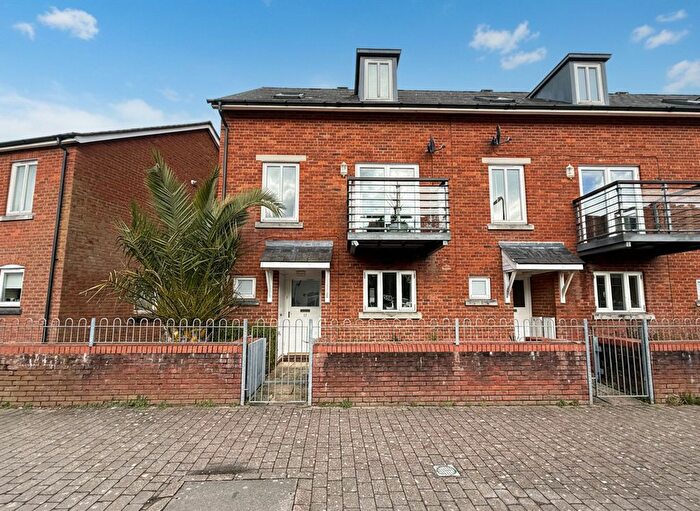
Properties for sale in Hythe West And Langdown
Roads and Postcodes in Hythe West And Langdown
Navigate through our locations to find the location of your next house in Hythe West And Langdown, Southampton for sale or to rent.
| Streets | Postcodes |
|---|---|
| Abbey Close | SO45 6EL |
| Armada Drive | SO45 5BS |
| Ashford Crescent | SO45 6ET SO45 6EU |
| Badgers Walk | SO45 4BU |
| Beaulieu Road | SO45 4NS SO45 5GU SO45 4ZB SO45 4ZD SO45 5WX |
| Belmont Close | SO45 4NL |
| Belvedere Road | SO45 4NP |
| Boundstone | SO45 5AZ |
| Braehead | SO45 4NT |
| Burnett Close | SO45 3DA |
| Byeways | SO45 5BL |
| Coat Gardens | SO45 6JA |
| Conifer Close | SO45 5EL |
| Copsewood Road | SO45 5DX SO45 5DY |
| Croft Close | SO45 5AH |
| Dale Road | SO45 5DP SO45 5DQ SO45 5DR SO45 5DS SO45 5DT SO45 5DU SO45 5DW |
| Davidson Close | SO45 6JD SO45 6JT |
| Deer Leap Way | SO45 3LL SO45 3LN SO45 3LP |
| Deerleap Close | SO45 3LA |
| Deerleap Way | SO45 3LQ |
| Dominy Close | SO45 6HA |
| Douglas Way | SO45 5DG |
| Drakes Close | SO45 5BP |
| Elgin Close | SO45 6JG |
| Emerald Crescent | SO45 6JX SO45 6WF |
| Fairfield Close | SO45 5FF |
| Fairview Close | SO45 5EX |
| Fairview Drive | SO45 5GX SO45 5GY |
| Fairview Parade | SO45 5GT |
| Fairway Road | SO45 5FT SO45 5FU |
| Fern Road | SO45 5EE SO45 5EF SO45 5EG |
| Ferry Road | SO45 5GB SO45 5GD |
| Forest Hill Way | SO45 4AS |
| Glenside | SO45 5BA |
| Golden Hind Park | SO45 5BN SO45 5BQ SO45 5BR |
| Grays Avenue | SO45 6FF |
| Greatwood Close | SO45 3BU |
| Green Close | SO45 5FD |
| Harvey Gardens | SO45 3LS |
| Hawthorn Road | SO45 5EP |
| Heathfield | SO45 5BJ |
| Highlands Close | SO45 4HZ |
| Highlands Way | SO45 4HX SO45 4HY |
| Hillview Road | SO45 5GJ SO45 5GL SO45 5GN |
| Hirst Road | SO45 6EP |
| Hobart Drive | SO45 6FB SO45 6FD SO45 6FH SO45 6FJ SO45 6FN SO45 6EZ |
| Hollybank Close | SO45 5GE |
| Hollybank Crescent | SO45 5FW SO45 5FX SO45 5FY SO45 5FZ SO45 5GA SO45 5GF SO45 5GG SO45 5GH |
| Hollybank Road | SO45 5FH SO45 5FJ SO45 5FL SO45 5FQ SO45 5FR SO45 5FS |
| Home Farm Close | SO45 6JN |
| Kelvin Close | SO45 5LW |
| Knightstone Grange | SO45 5LR |
| Knightwood Road | SO45 6JJ SO45 6JL SO45 6JP |
| Lanehays Road | SO45 5DZ SO45 5EA SO45 5ED SO45 5EQ SO45 5ER SO45 5EB |
| Langdown Firs | SO45 5BT |
| Langdown Lawn | SO45 5GR SO45 5GS |
| Langdown Lawn Close | SO45 5GW |
| Langdown Road | SO45 6EG SO45 6EH SO45 6EJ SO45 6EN SO45 6EQ SO45 6ER SO45 6EW SO45 6EX SO45 6EY |
| Laurel Close | SO45 5EN |
| Lower Mullins Lane | SO45 5AE SO45 5AF |
| Malwood Road | SO45 5FB SO45 5FE SO45 5FG |
| Malwood Road West | SO45 5DB SO45 5DD SO45 5DE SO45 5DF SO45 5DL SO45 5DN |
| Marlborough Court | SO45 4EY |
| Merrivale Close | SO45 5XA |
| Michaels Way | SO45 5ES |
| Midway | SO45 5BG |
| Millers Way | SO45 4NA |
| Mountfield | SO45 5AQ |
| Noads Close | SO45 4NR |
| Noads Way | SO45 4PA |
| Orchard Way | SO45 4AH SO45 4AP |
| Overbrook | SO45 5BB SO45 5BE SO45 5BH |
| Park Close | SO45 6FL |
| Peartree Road | SO45 4AJ SO45 4AL SO45 4AN |
| Pine Close | SO45 4AT |
| Queens Close | SO45 6JQ |
| Roberts Road | SO45 5DH SO45 5DJ |
| Rosebery Avenue | SO45 3GX |
| Scott-paine Drive | SO45 6JZ SO45 6JB SO45 6JY |
| Seaward Road | SO45 6FE |
| Selman Close | SO45 6JS |
| Seward Green | SO45 6GQ |
| Shore Road | SO45 6DB SO45 6DD SO45 6DF SO45 6GJ SO45 6HB SO45 6HE |
| Sir Christopher Court | SO45 6JR |
| Solent Drive | SO45 5FN SO45 5FP |
| South Street | SO45 6EA SO45 6ED |
| Southampton Road | SO45 5AB SO45 5AD SO45 5GQ SO45 5TA |
| Spring Road | SO45 6FP |
| Squirrels Walk | SO45 4BX |
| Sunningdale | SO45 5BD |
| Sycamore Road | SO45 5EH SO45 5EJ |
| Tamar Grove | SO45 5XE |
| Tates Road | SO45 6ES |
| The Mead | SO45 5AX SO45 5AY |
| The Vale | SO45 5ET |
| The Wicket | SO45 5AU |
| Tormead | SO45 5AW |
| Upper Mullins Lane | SO45 5AR |
| Valleydene | SO45 4NG |
| Wadmore Close | SO45 6JW SO45 6JU |
| Whitewater Rise | SO45 4BY |
| Whittington Close | SO45 5EZ SO45 5NQ |
| Windrush Close | SO45 6GP |
| Windrush Way | SO45 6JE SO45 6JF SO45 6JH |
Transport near Hythe West And Langdown
- FAQ
- Price Paid By Year
- Property Type Price
Frequently asked questions about Hythe West And Langdown
What is the average price for a property for sale in Hythe West And Langdown?
The average price for a property for sale in Hythe West And Langdown is £342,800. This amount is 11% lower than the average price in Southampton. There are 911 property listings for sale in Hythe West And Langdown.
What streets have the most expensive properties for sale in Hythe West And Langdown?
The streets with the most expensive properties for sale in Hythe West And Langdown are Langdown Lawn at an average of £680,000, Lower Mullins Lane at an average of £579,083 and Mountfield at an average of £501,166.
What streets have the most affordable properties for sale in Hythe West And Langdown?
The streets with the most affordable properties for sale in Hythe West And Langdown are Langdown Firs at an average of £79,833, Beaulieu Road at an average of £150,250 and Emerald Crescent at an average of £151,083.
Which train stations are available in or near Hythe West And Langdown?
Some of the train stations available in or near Hythe West And Langdown are Woolston, Netley and Sholing.
Property Price Paid in Hythe West And Langdown by Year
The average sold property price by year was:
| Year | Average Sold Price | Price Change |
Sold Properties
|
|---|---|---|---|
| 2025 | £340,001 | 3% |
74 Properties |
| 2024 | £329,737 | -8% |
77 Properties |
| 2023 | £355,842 | -1% |
93 Properties |
| 2022 | £358,532 | 12% |
100 Properties |
| 2021 | £316,481 | 2% |
157 Properties |
| 2020 | £310,319 | 3% |
92 Properties |
| 2019 | £300,473 | 10% |
118 Properties |
| 2018 | £269,150 | -8% |
99 Properties |
| 2017 | £289,991 | 8% |
115 Properties |
| 2016 | £266,346 | 6% |
113 Properties |
| 2015 | £250,143 | 6% |
108 Properties |
| 2014 | £236,281 | 9% |
137 Properties |
| 2013 | £213,943 | -4% |
94 Properties |
| 2012 | £222,125 | - |
101 Properties |
| 2011 | £222,115 | 1% |
89 Properties |
| 2010 | £220,808 | 13% |
90 Properties |
| 2009 | £192,969 | 2% |
80 Properties |
| 2008 | £188,710 | -15% |
77 Properties |
| 2007 | £216,845 | -1% |
160 Properties |
| 2006 | £219,948 | 14% |
178 Properties |
| 2005 | £190,216 | -1% |
109 Properties |
| 2004 | £192,517 | 6% |
140 Properties |
| 2003 | £180,101 | 8% |
159 Properties |
| 2002 | £166,248 | 22% |
233 Properties |
| 2001 | £129,883 | 16% |
181 Properties |
| 2000 | £108,541 | 7% |
120 Properties |
| 1999 | £101,370 | 17% |
162 Properties |
| 1998 | £83,648 | 13% |
137 Properties |
| 1997 | £72,825 | 10% |
112 Properties |
| 1996 | £65,271 | 3% |
116 Properties |
| 1995 | £63,109 | - |
96 Properties |
Property Price per Property Type in Hythe West And Langdown
Here you can find historic sold price data in order to help with your property search.
The average Property Paid Price for specific property types in the last three years are:
| Property Type | Average Sold Price | Sold Properties |
|---|---|---|
| Flat | £216,489.00 | 52 Flats |
| Semi Detached House | £321,992.00 | 63 Semi Detached Houses |
| Detached House | £419,615.00 | 102 Detached Houses |
| Terraced House | £344,425.00 | 27 Terraced Houses |

