Houses for sale & to rent in Swanmore And Newtown, Southampton
House Prices in Swanmore And Newtown
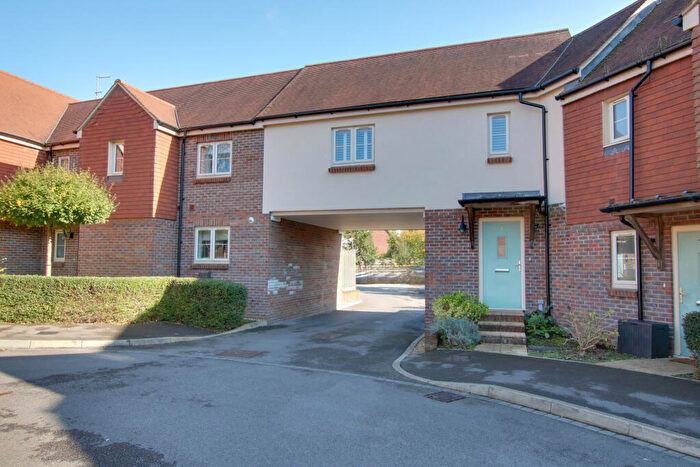
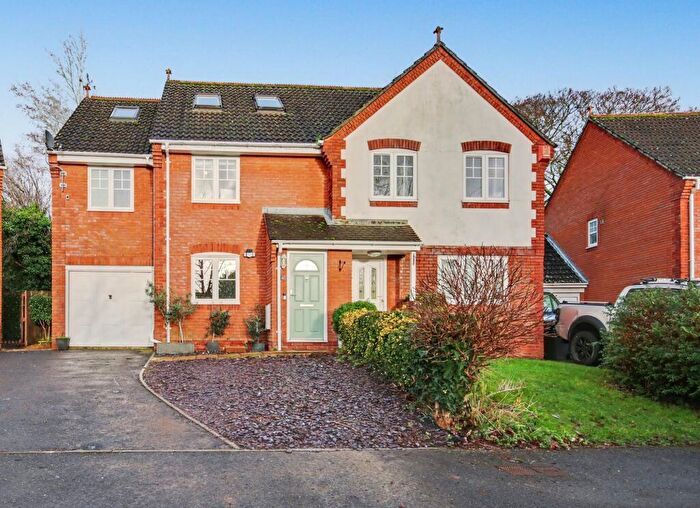
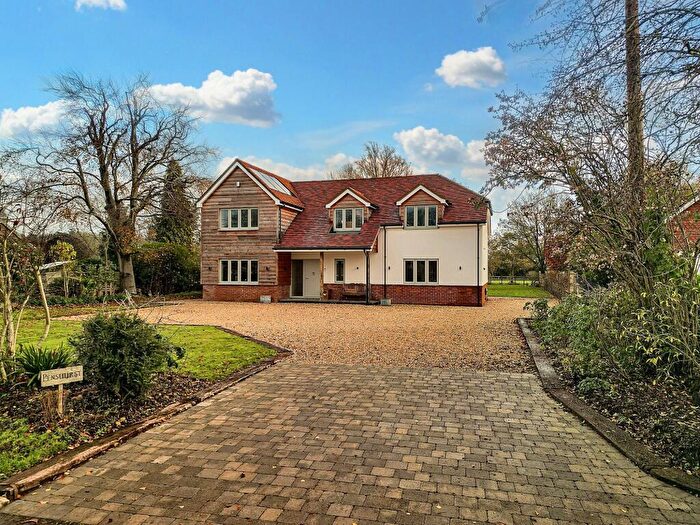
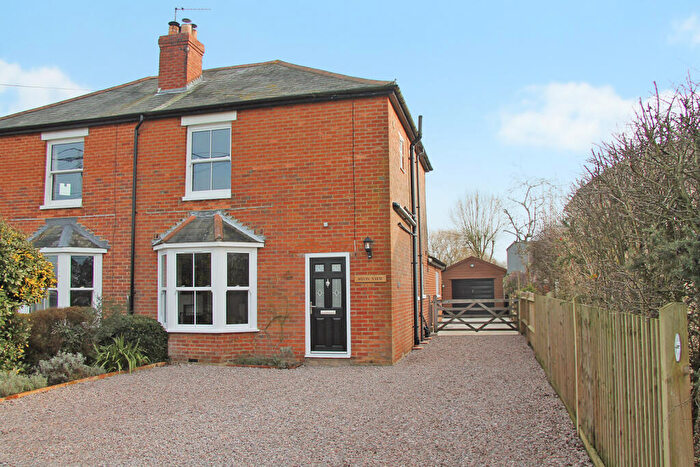
Properties in Swanmore And Newtown have an average house price of £567,320.00 and had 93 Property Transactions within the last 3 years¹.
Swanmore And Newtown is an area in Southampton, Hampshire with 1,338 households², where the most expensive property was sold for £1,270,000.00.
Properties for sale in Swanmore And Newtown
Roads and Postcodes in Swanmore And Newtown
Navigate through our locations to find the location of your next house in Swanmore And Newtown, Southampton for sale or to rent.
| Streets | Postcodes |
|---|---|
| Armsworth Lane | SO32 3RE |
| Beverley Gardens | SO32 2RT |
| Brickyard Road | SO32 2PJ |
| Broad Lane | SO32 2PD |
| Bucketts Farm Close | SO32 2NT |
| Chapel Road | SO32 2QA SO32 2QB SO32 3PP |
| Church Lane | SO32 2QX |
| Church Mews | SO32 2RG |
| Church Road | SO32 2PA SO32 2PU |
| Coronation Road | SO32 2PG |
| Cott Street | SO32 2QG |
| Crofton Way | SO32 2RF |
| Damson Hill | SO32 2QR |
| Dodds Lane | SO32 2PX |
| Donigers Close | SO32 2QJ |
| Donigers Dell | SO32 2TL |
| Dradfield Lane | SO32 3QD |
| Droxford Road | SO32 2PY |
| Forest Road | SO32 2PL |
| Forester Road | SO32 3QG |
| Foxcombe Close | SO32 2UJ |
| Glendale | SO32 2QY |
| Gravel Hill | SO32 2PN SO32 2PQ |
| Greenways | SO32 2RL |
| Hampton Farm Lane | SO32 2GH |
| Hampton Hill | SO32 2QN |
| Heath Road | SO32 3PQ SO32 3QH |
| High Street | SO32 3PN |
| Hill Grove Lane | SO32 2NZ |
| Hill Pound | SO32 2PS SO32 2UN |
| Holywell | SO32 2QE |
| Horns Hill | SO32 3PR |
| Hunters Chase | SO32 2QD |
| Ingoldfield Lane | SO32 3QA |
| Ivy Close | SO32 2FJ |
| Kiln Hill | SO32 3QE |
| Larkspur Close | SO32 2RE |
| Leacock Close | SO32 2RP |
| Lower Chase Road | SO32 2LH SO32 2PB |
| Ludwells Lane | SO32 2NP |
| Martin Close | SO32 2NS |
| Mayhill Lane | SO32 2QW |
| Medlicott Way | SO32 2NE |
| Meon Gardens | SO32 2TN |
| Michaelmas Place | SO32 2EU |
| Moorlands Road | SO32 2QL |
| Myers Close | SO32 2RN |
| New Inn Close | SO32 2RJ |
| New Road | SO32 2PE SO32 2PF |
| Old Spring Lane | SO32 2RD |
| Orchardlea | SO32 2QZ |
| Park Lane | SO32 2QQ |
| Rowan Close | SO32 2RS |
| Russet Close | SO32 2RU |
| Selworth Lane | SO32 3PX SO32 3SN |
| Southend Lane | SO32 3QB |
| Spring Lane | SO32 2PT |
| Springvale | SO32 2AU SO32 2PH |
| Stokes Court | SO32 2ET |
| Swanmore Park | SO32 2QS |
| Swanmore Road | SO32 2QH |
| The Hollythorns | SO32 2NW |
| The Lakes | SO32 2PR |
| Vicarage Lane | SO32 2PW SO32 2QT |
| Webbs Green | SO32 3PY |
| Well Lane | SO32 2QU |
| Westfield Drive | SO32 2WA |
| Wickham Road | SO32 2QF |
| Willows Close | SO32 2EL |
Transport near Swanmore And Newtown
-
Botley Station
-
Hedge End Station
-
Swanwick Station
-
Fareham Station
-
Portchester Station
-
Bursledon Station
-
Eastleigh Station
-
Cosham Station
-
Hamble Station
-
Southampton Airport (Parkway) Station
- FAQ
- Price Paid By Year
- Property Type Price
Frequently asked questions about Swanmore And Newtown
What is the average price for a property for sale in Swanmore And Newtown?
The average price for a property for sale in Swanmore And Newtown is £567,320. This amount is 47% higher than the average price in Southampton. There are 890 property listings for sale in Swanmore And Newtown.
What streets have the most expensive properties for sale in Swanmore And Newtown?
The streets with the most expensive properties for sale in Swanmore And Newtown are Droxford Road at an average of £1,200,500, Ludwells Lane at an average of £1,024,285 and Forest Road at an average of £950,000.
What streets have the most affordable properties for sale in Swanmore And Newtown?
The streets with the most affordable properties for sale in Swanmore And Newtown are Meon Gardens at an average of £104,750, Church Mews at an average of £175,000 and Springvale at an average of £293,145.
Which train stations are available in or near Swanmore And Newtown?
Some of the train stations available in or near Swanmore And Newtown are Botley, Hedge End and Swanwick.
Property Price Paid in Swanmore And Newtown by Year
The average sold property price by year was:
| Year | Average Sold Price | Price Change |
Sold Properties
|
|---|---|---|---|
| 2025 | £588,162 | 6% |
34 Properties |
| 2024 | £553,814 | -1% |
31 Properties |
| 2023 | £556,964 | -33% |
28 Properties |
| 2022 | £740,909 | 19% |
44 Properties |
| 2021 | £596,829 | 13% |
64 Properties |
| 2020 | £519,962 | -7% |
32 Properties |
| 2019 | £558,220 | -1% |
43 Properties |
| 2018 | £562,020 | -0,2% |
43 Properties |
| 2017 | £563,073 | 14% |
45 Properties |
| 2016 | £486,811 | -2% |
46 Properties |
| 2015 | £495,754 | 4% |
55 Properties |
| 2014 | £478,090 | 15% |
54 Properties |
| 2013 | £405,046 | 9% |
33 Properties |
| 2012 | £370,079 | -16% |
47 Properties |
| 2011 | £431,104 | 2% |
48 Properties |
| 2010 | £421,158 | 27% |
34 Properties |
| 2009 | £306,213 | -34% |
43 Properties |
| 2008 | £410,502 | -3% |
42 Properties |
| 2007 | £421,525 | 2% |
58 Properties |
| 2006 | £411,951 | 7% |
69 Properties |
| 2005 | £383,846 | 18% |
43 Properties |
| 2004 | £312,948 | 1% |
75 Properties |
| 2003 | £310,507 | 8% |
62 Properties |
| 2002 | £284,901 | 21% |
74 Properties |
| 2001 | £224,860 | -0,1% |
44 Properties |
| 2000 | £225,170 | 19% |
59 Properties |
| 1999 | £181,630 | 13% |
65 Properties |
| 1998 | £157,278 | 13% |
77 Properties |
| 1997 | £137,143 | -2% |
47 Properties |
| 1996 | £140,004 | 10% |
71 Properties |
| 1995 | £126,088 | - |
63 Properties |
Property Price per Property Type in Swanmore And Newtown
Here you can find historic sold price data in order to help with your property search.
The average Property Paid Price for specific property types in the last three years are:
| Property Type | Average Sold Price | Sold Properties |
|---|---|---|
| Semi Detached House | £395,133.00 | 15 Semi Detached Houses |
| Detached House | £704,042.00 | 59 Detached Houses |
| Terraced House | £335,803.00 | 14 Terraced Houses |
| Flat | £118,800.00 | 5 Flats |

