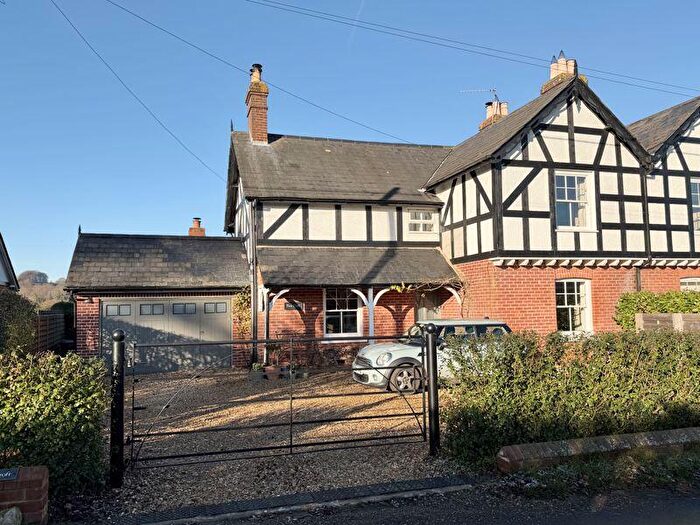
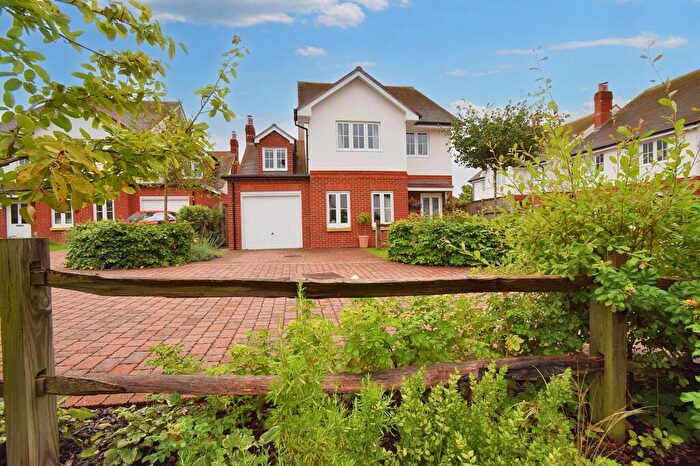
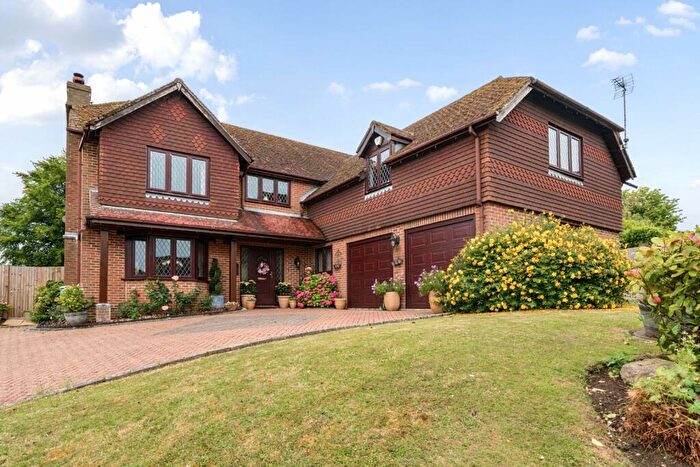
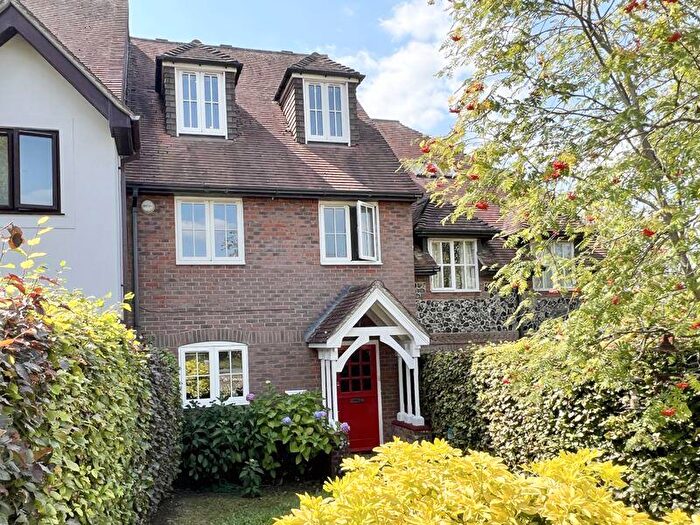
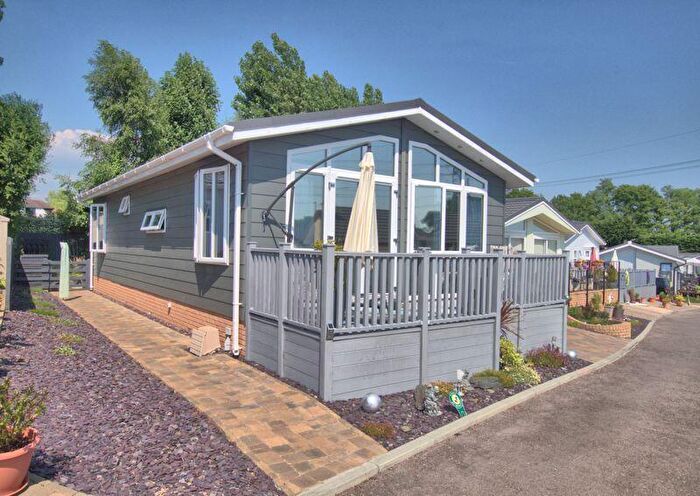
Houses for sale & to rent in Droxford, Soberton And Hambledon, Southampton
House Prices in Droxford, Soberton And Hambledon
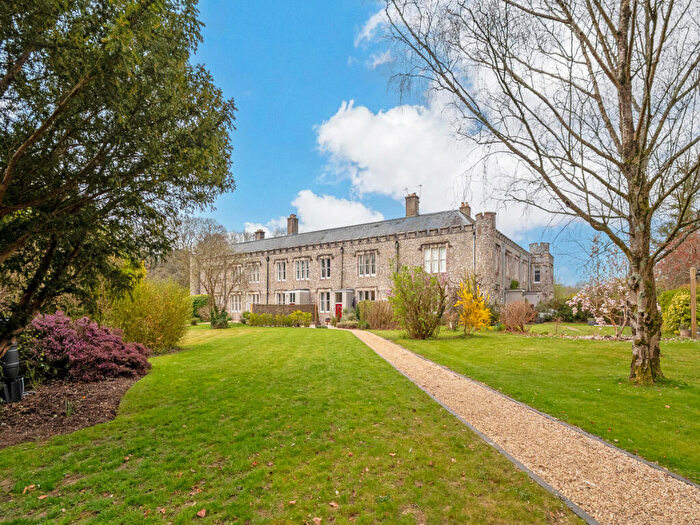
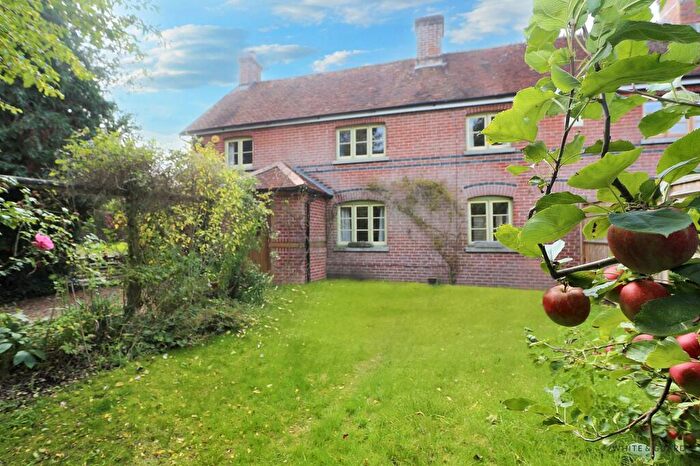
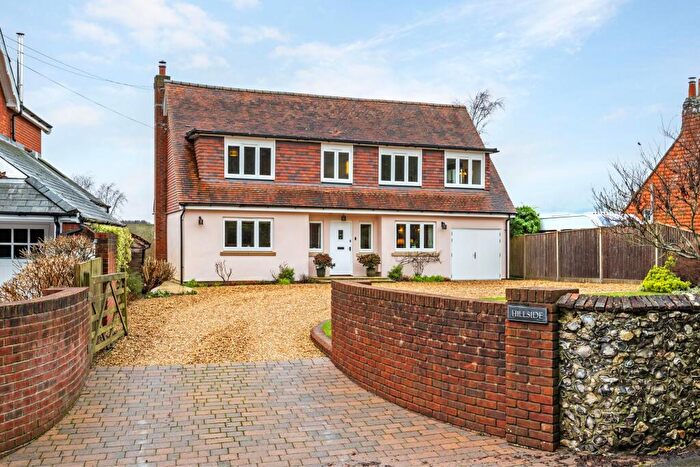
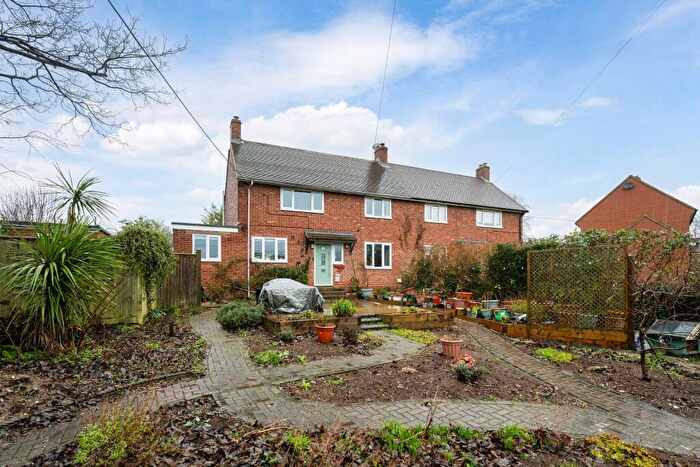
Properties in Droxford, Soberton And Hambledon have an average house price of £769,083.00 and had 30 Property Transactions within the last 3 years¹.
Droxford, Soberton And Hambledon is an area in Southampton, Hampshire with 414 households², where the most expensive property was sold for £1,503,000.00.
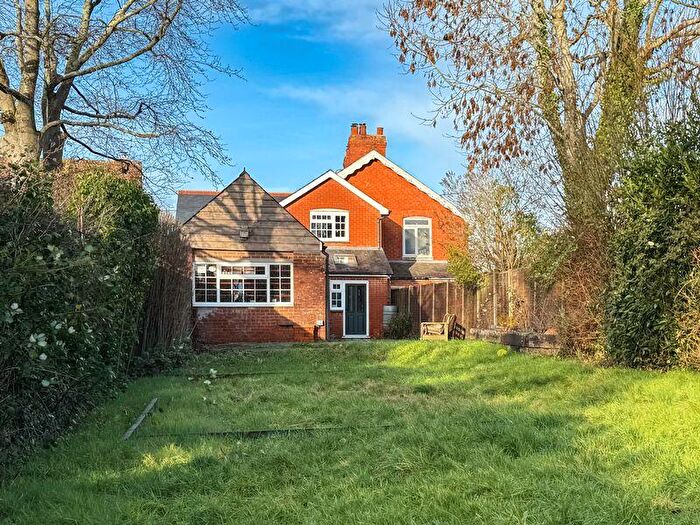
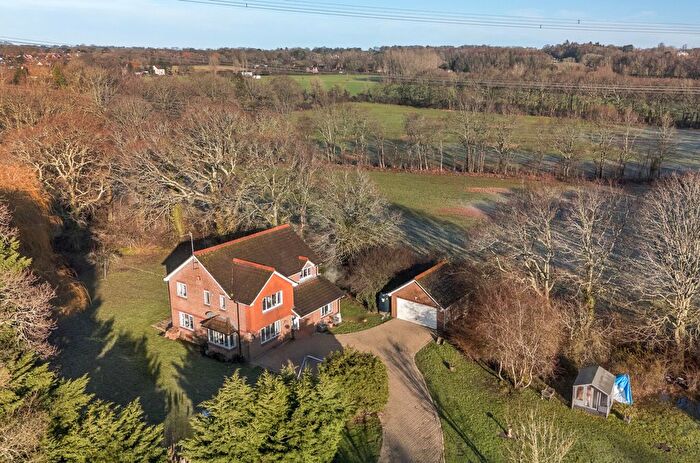
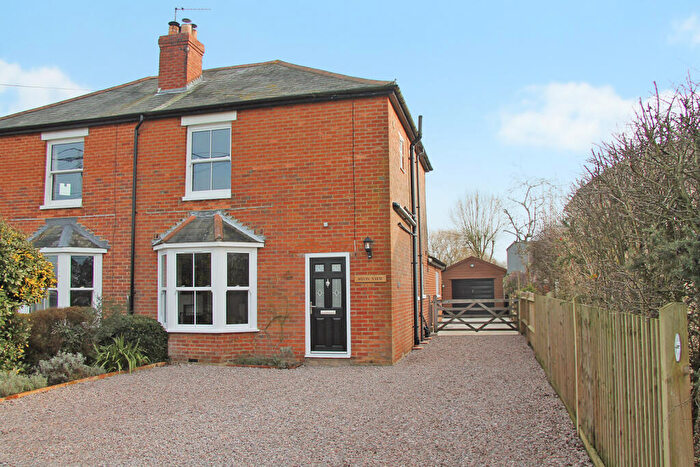
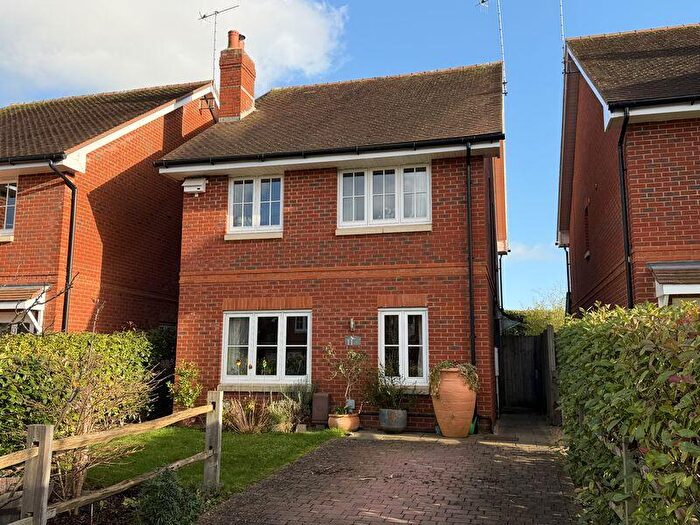
Properties for sale in Droxford, Soberton And Hambledon
Roads and Postcodes in Droxford, Soberton And Hambledon
Navigate through our locations to find the location of your next house in Droxford, Soberton And Hambledon, Southampton for sale or to rent.
| Streets | Postcodes |
|---|---|
| Brockbridge | SO32 3QT |
| Chalk Hill | SO32 3PH |
| Chestnut Rise | SO32 3NY |
| Cole Hill | SO32 3PJ |
| Crookhorn Lane | SO32 3RD |
| Cutts Arch | SO32 3PE |
| Dundridge Lane | SO32 1GB |
| Garrison Hill | SO32 3QL |
| Hambledon Lane | SO32 3PZ |
| Hazelholt | SO32 1GA |
| High Street | SO32 3PA |
| Long Road | SO32 3PG |
| Midlington Hill | SO32 3PU |
| Midlington Road | SO32 3PD |
| Mill Lane | SO32 3QS |
| Northend Lane | SO32 3QN |
| Park Lane | SO32 3QR |
| Park Villas | SO32 3QP |
| Police Station Lane | SO32 3RF |
| School Hill | SO32 3PF |
| Sheeps Pond Lane | SO32 3QZ |
| South Hill | SO32 3PB |
| Southview | SO32 3QJ |
| Station Road | SO32 3QU |
| Swanmore Road | SO32 3PT |
| The Park | SO32 3AN SO32 3QQ |
| The Square | SO32 3RB |
| The Towers | SO32 3PS |
| Waltham Close | SO32 3NZ |
| West Street | SO32 3PL |
| SO32 3QX SO32 3QY SO32 3RA |
Transport near Droxford, Soberton And Hambledon
-
Botley Station
-
Hedge End Station
-
Portchester Station
-
Fareham Station
-
Swanwick Station
-
Cosham Station
-
Rowland's Castle Station
-
Bursledon Station
-
Petersfield Station
-
Bedhampton Station
- FAQ
- Price Paid By Year
- Property Type Price
Frequently asked questions about Droxford, Soberton And Hambledon
What is the average price for a property for sale in Droxford, Soberton And Hambledon?
The average price for a property for sale in Droxford, Soberton And Hambledon is £769,083. This amount is 99% higher than the average price in Southampton. There are 230 property listings for sale in Droxford, Soberton And Hambledon.
What streets have the most expensive properties for sale in Droxford, Soberton And Hambledon?
The streets with the most expensive properties for sale in Droxford, Soberton And Hambledon are The Towers at an average of £1,080,000, Midlington Hill at an average of £1,024,000 and Station Road at an average of £847,500.
What streets have the most affordable properties for sale in Droxford, Soberton And Hambledon?
The streets with the most affordable properties for sale in Droxford, Soberton And Hambledon are Long Road at an average of £400,000, Southview at an average of £410,000 and Park Villas at an average of £427,500.
Which train stations are available in or near Droxford, Soberton And Hambledon?
Some of the train stations available in or near Droxford, Soberton And Hambledon are Botley, Hedge End and Portchester.
Property Price Paid in Droxford, Soberton And Hambledon by Year
The average sold property price by year was:
| Year | Average Sold Price | Price Change |
Sold Properties
|
|---|---|---|---|
| 2025 | £670,500 | 4% |
10 Properties |
| 2024 | £644,541 | -67% |
12 Properties |
| 2023 | £1,079,125 | 26% |
8 Properties |
| 2022 | £795,198 | -5% |
15 Properties |
| 2021 | £835,440 | -17% |
21 Properties |
| 2020 | £980,309 | 56% |
16 Properties |
| 2019 | £429,857 | -40% |
7 Properties |
| 2018 | £603,437 | 30% |
16 Properties |
| 2017 | £423,845 | -21% |
10 Properties |
| 2016 | £513,710 | -26% |
14 Properties |
| 2015 | £647,173 | 6% |
13 Properties |
| 2014 | £605,333 | 27% |
9 Properties |
| 2013 | £440,705 | -13% |
17 Properties |
| 2012 | £498,461 | -5% |
13 Properties |
| 2011 | £525,111 | -21% |
9 Properties |
| 2010 | £634,000 | 18% |
10 Properties |
| 2009 | £520,875 | -19% |
10 Properties |
| 2008 | £621,281 | 32% |
16 Properties |
| 2007 | £424,090 | -13% |
22 Properties |
| 2006 | £481,078 | 2% |
19 Properties |
| 2005 | £470,872 | 19% |
24 Properties |
| 2004 | £383,686 | -9% |
12 Properties |
| 2003 | £418,450 | 9% |
20 Properties |
| 2002 | £379,661 | 2% |
17 Properties |
| 2001 | £372,666 | 10% |
15 Properties |
| 2000 | £337,233 | 43% |
15 Properties |
| 1999 | £193,710 | 1% |
14 Properties |
| 1998 | £190,925 | 4% |
14 Properties |
| 1997 | £183,952 | 12% |
23 Properties |
| 1996 | £162,021 | -3% |
14 Properties |
| 1995 | £166,812 | - |
12 Properties |
Property Price per Property Type in Droxford, Soberton And Hambledon
Here you can find historic sold price data in order to help with your property search.
The average Property Paid Price for specific property types in the last three years are:
| Property Type | Average Sold Price | Sold Properties |
|---|---|---|
| Semi Detached House | £647,571.00 | 7 Semi Detached Houses |
| Terraced House | £439,000.00 | 5 Terraced Houses |
| Detached House | £924,687.00 | 16 Detached Houses |
| Flat | £774,750.00 | 2 Flats |

