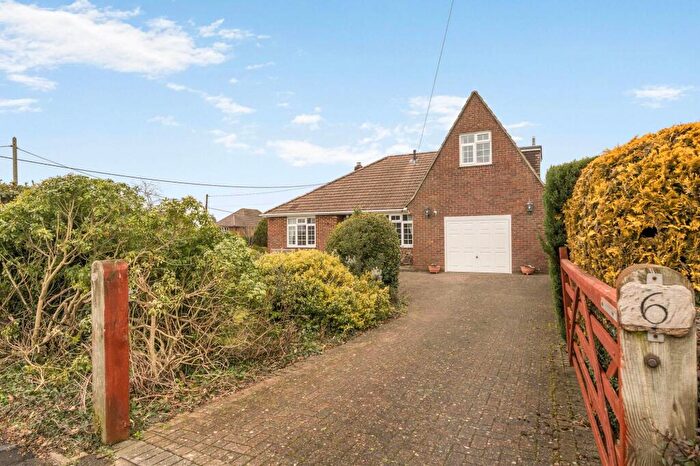
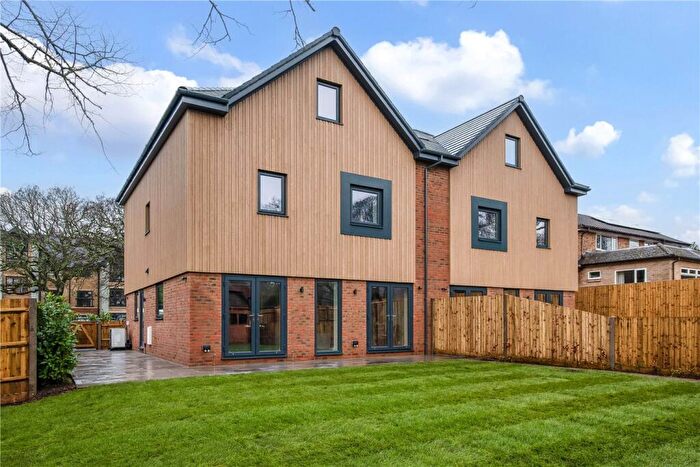
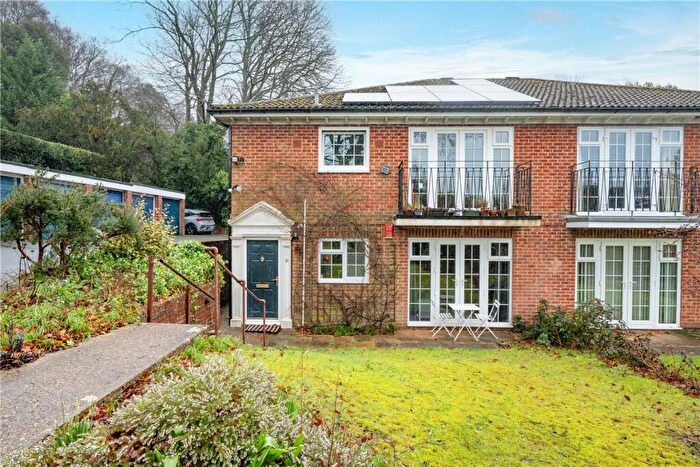
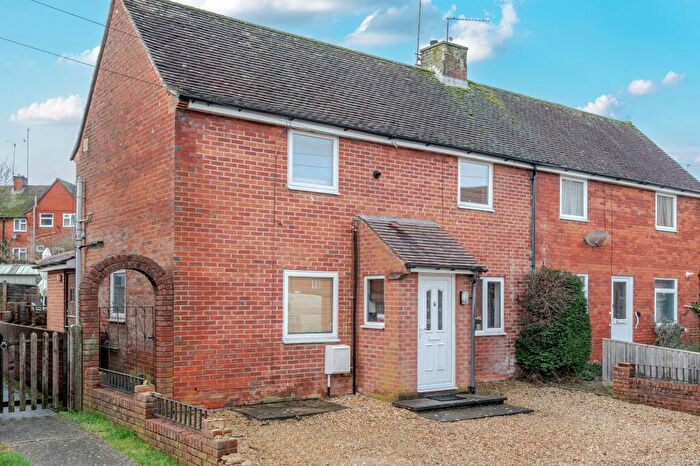
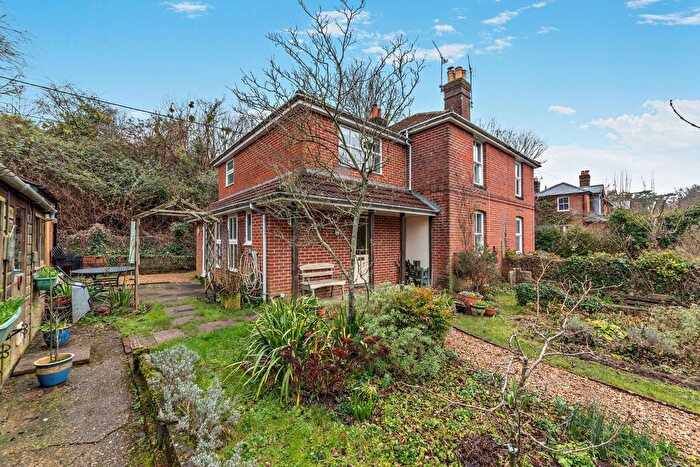
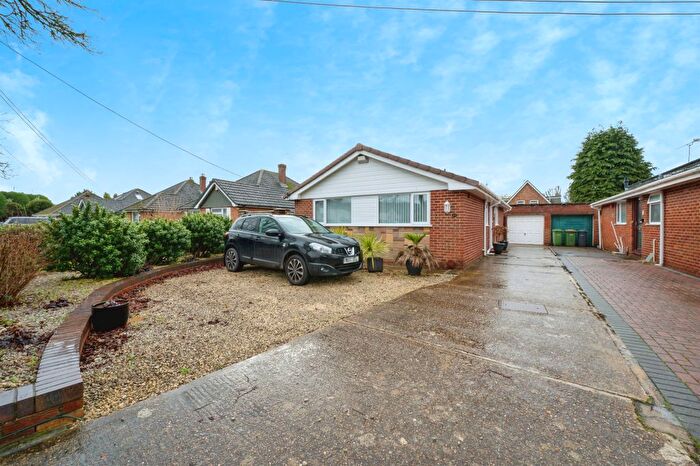
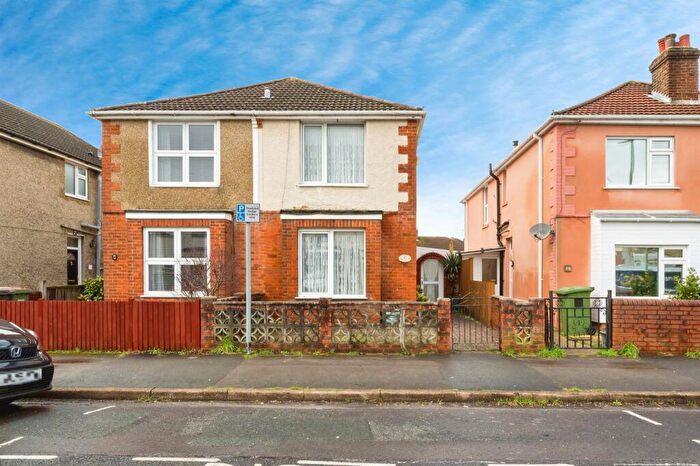
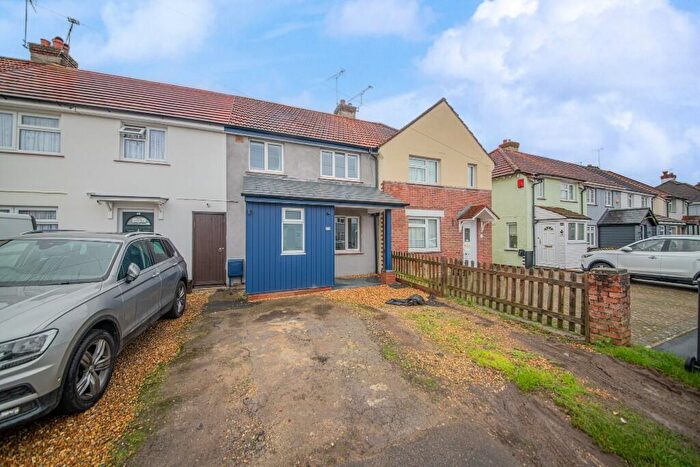
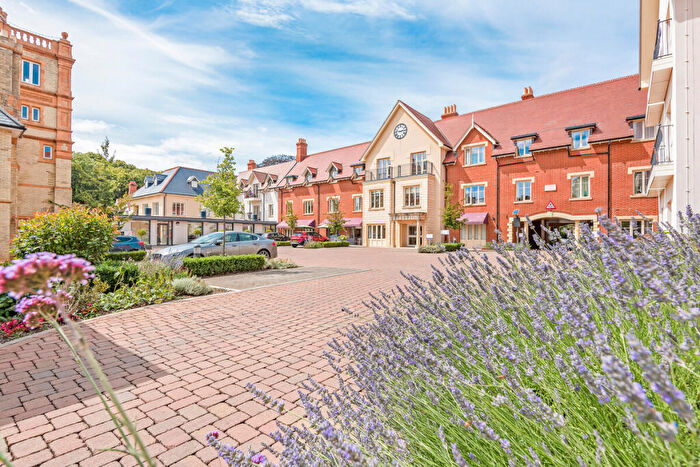
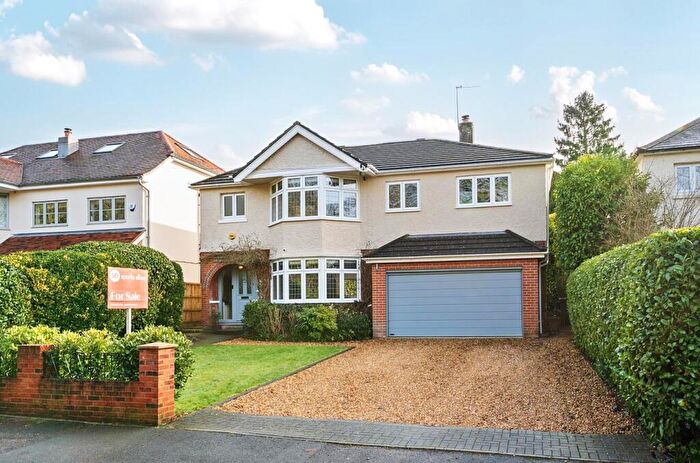
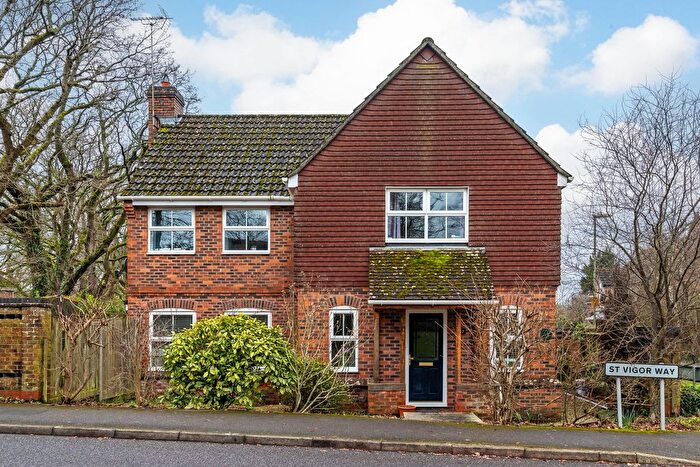
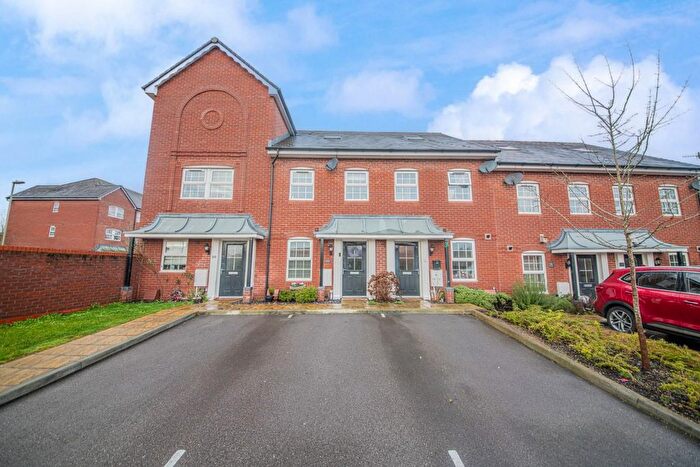
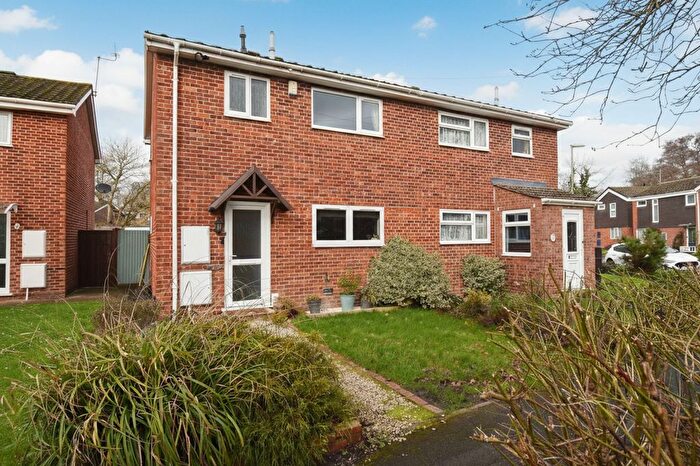
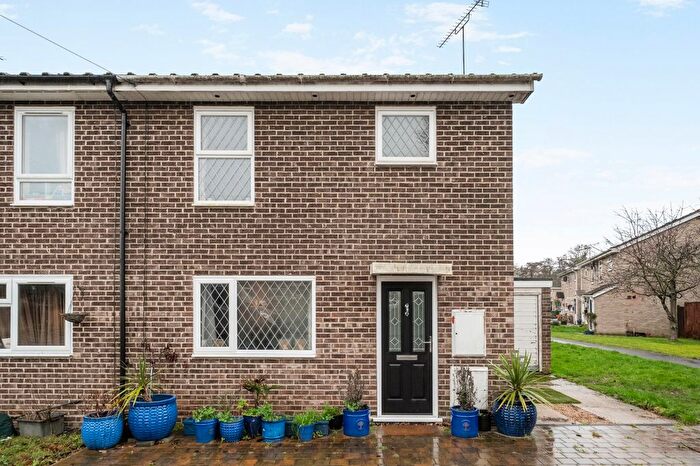
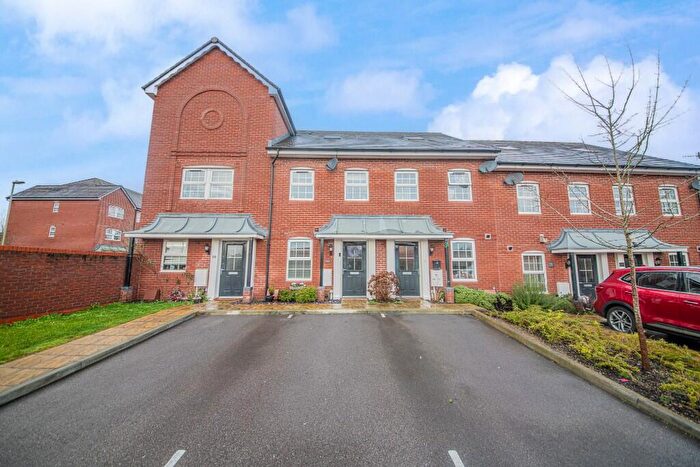
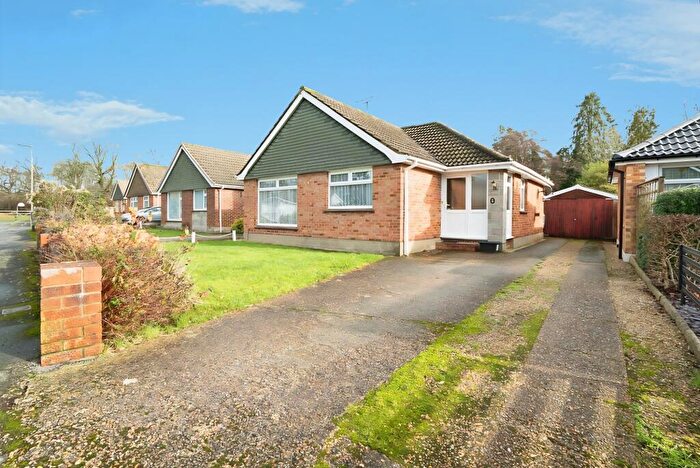
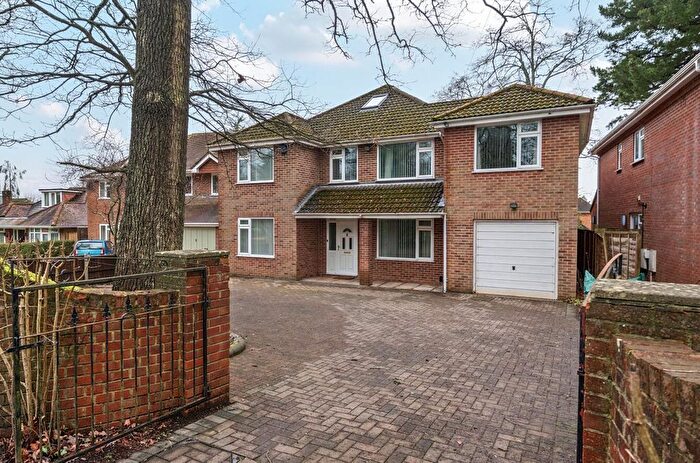
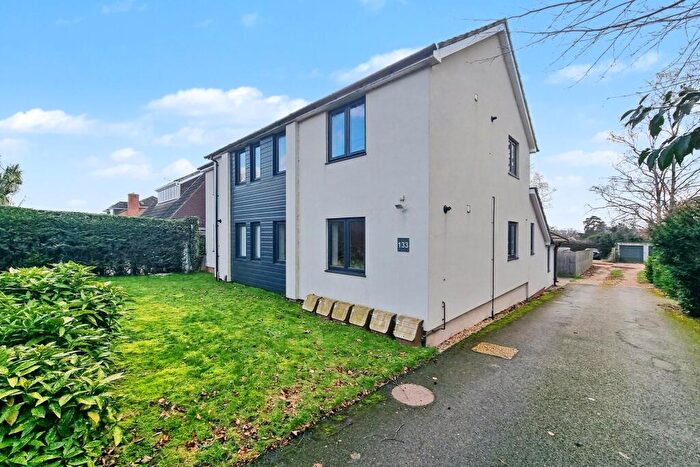
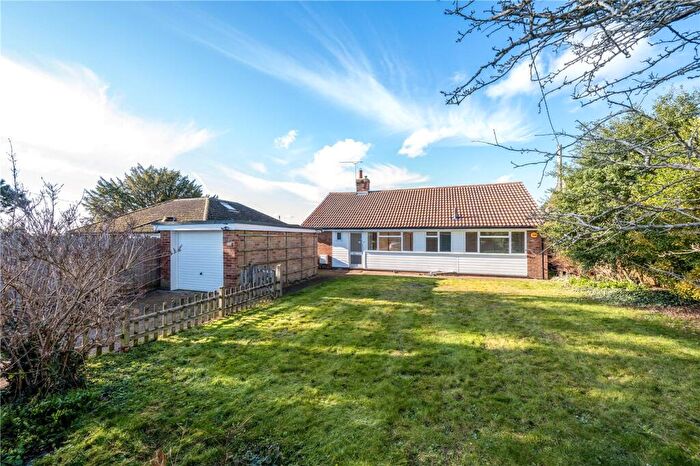
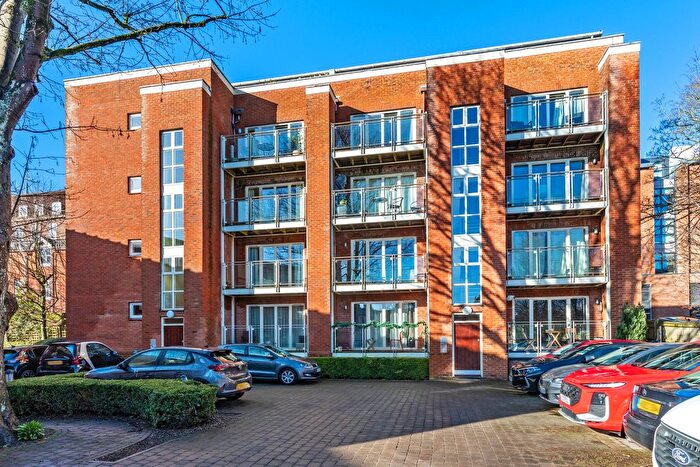
Houses for sale & to rent in Compton And Otterbourne, Winchester
House Prices in Compton And Otterbourne
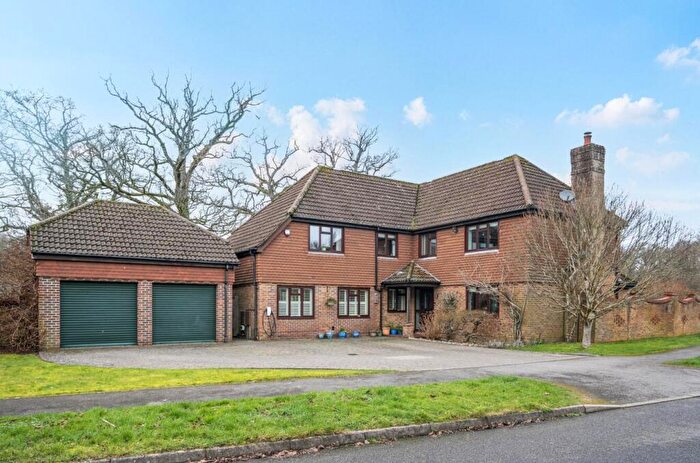
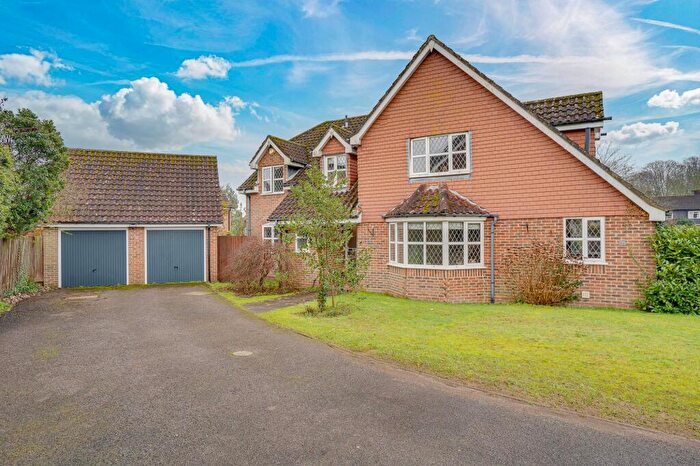
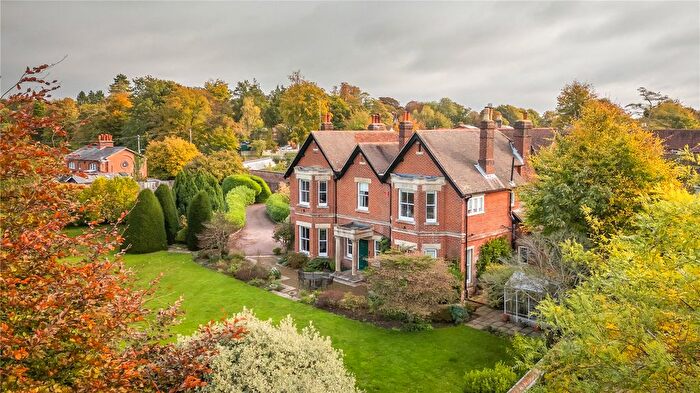
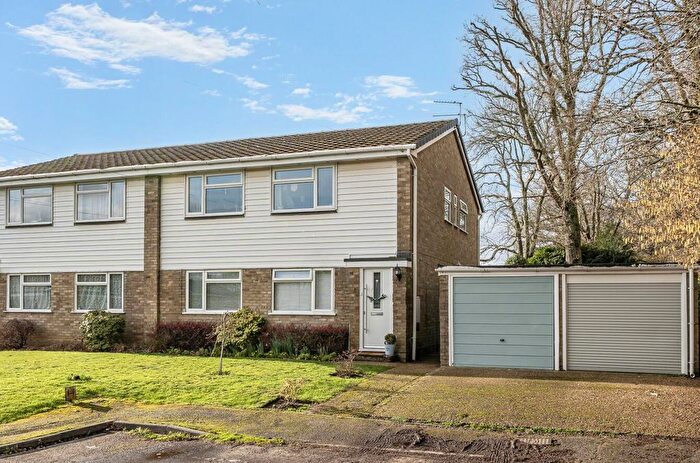
Properties in Compton And Otterbourne have an average house price of £855,308.00 and had 130 Property Transactions within the last 3 years¹.
Compton And Otterbourne is an area in Winchester, Hampshire with 1,482 households², where the most expensive property was sold for £2,826,000.00.
Properties for sale in Compton And Otterbourne
Roads and Postcodes in Compton And Otterbourne
Navigate through our locations to find the location of your next house in Compton And Otterbourne, Winchester for sale or to rent.
| Streets | Postcodes |
|---|---|
| Attwoods Drove | SO21 2AX |
| Bourne Close | SO21 2DU |
| Boyatt Lane | SO21 2HP SO21 2HW |
| Bridge Lane | SO21 2BL |
| Bridge Terrace | SO21 2BT |
| Brooklyn Close | SO21 2EF |
| Bunstead Lane | SO21 2LQ |
| Carmans Lane | SO21 2AR |
| Catways | SO21 2JT |
| Chapel Lane | SO21 2HX |
| Charlotte Mede | SO21 2FA |
| Clarendon Way | SO22 5QL |
| Clease Way | SO21 2AL |
| Cliff Way | SO21 2AP |
| Coles Mede | SO21 2EG |
| Collins Lane | SO21 2JX |
| Compton Street | SO21 2AS SO21 2AT SO21 2FF |
| Copse Close | SO21 2DX |
| Cranbourne Drive | SO21 2ES SO21 2ET SO21 2EU |
| Cranbury Close | SO21 2EH |
| Cranbury Park | SO21 2HN |
| Cross Way | SO21 2BZ |
| Enmill Lane | SO22 5QW |
| Fairfield Road | SO21 2DA SO21 2DB |
| Field Close | SO21 2AE |
| Field Way | SO21 2AF |
| Fleet Terrace | SO21 2HR |
| Grange Drive | SO21 2HZ |
| Greenacres Drive | SO21 2HE |
| Grove Road | SO21 2DD |
| Heathcote Place | SO21 2LH |
| Highways Road | SO21 2DF |
| Hurdle Way | SO21 2AN SO21 2AW |
| Hursley Park Road | SO21 2LA |
| Ivy Cottages | SO21 2HT |
| Keble Close | SO21 2JU |
| Kiln Lane | SO21 2EJ SO21 2EN |
| Ladwell | SO21 2LE |
| Laura Close | SO21 2FD |
| Main Road | SO21 2DR SO21 2EE SO21 2EQ SO21 2FB SO21 2JP SO21 2JW SO21 2JY |
| Martins Fields | SO21 2AZ |
| Meadowcroft Close | SO21 2HD |
| Meredun Close | SO21 2JA SO21 2JB |
| Norlands Drive | SO21 2DT |
| Oakwood Avenue | SO21 2ED |
| Oakwood Close | SO21 2EB SO21 2EX SO21 2EY |
| Old Parsonage Court | SO21 2EP |
| Otterbourne Hill | SO21 2HJ |
| Otterbourne House Gardens | SO21 2ER |
| Otterbourne Road | SO21 2BB SO21 2DE SO21 2DG SO21 2RT |
| Park Lane | SO21 2HY |
| Park View | SO21 2BS SO21 2HU |
| Place Lane | SO21 2BA |
| Poles Lane | SO21 2DS SO21 2DZ SO21 2LL |
| Port Lane | SO21 2JS |
| Regent Close | SO21 2DN |
| Richmond Park | SO21 2DJ |
| Romsey Road | SO22 5QX |
| Sarum Road | SO22 5QT |
| Shawford Road | SO21 2BG SO21 2BU |
| Shepherds Lane | SO21 2AB SO21 2AD |
| Silkstead Lane | SO21 2LG |
| South End Close | SO21 2LJ |
| South Lynch | SO21 2JG |
| Southdown Place | SO21 2FE |
| Southdown Road | SO21 2BX SO21 2BY |
| Sparrowgrove | SO21 2DL |
| Standon Main Road | SO21 2JH |
| Station Terrace | SO21 2BN |
| Stone Terrace | SO21 2HS |
| Sunlight Cottages | SO21 2JL |
| Sussex Close | SO21 2JQ |
| The Spinney | SO21 2BE |
| Tilden Road | SO21 2DQ SO21 2DW |
| Waterworks Road | SO21 2DP |
| SO21 2AA SO22 5QP |
Transport near Compton And Otterbourne
-
Shawford Station
-
Chandlers Ford Station
-
Eastleigh Station
-
Winchester Station
-
Southampton Airport (Parkway) Station
- FAQ
- Price Paid By Year
- Property Type Price
Frequently asked questions about Compton And Otterbourne
What is the average price for a property for sale in Compton And Otterbourne?
The average price for a property for sale in Compton And Otterbourne is £855,308. This amount is 35% higher than the average price in Winchester. There are 7,443 property listings for sale in Compton And Otterbourne.
What streets have the most expensive properties for sale in Compton And Otterbourne?
The streets with the most expensive properties for sale in Compton And Otterbourne are Clease Way at an average of £2,800,000, Shepherds Lane at an average of £2,158,666 and Fairfield Road at an average of £1,863,333.
What streets have the most affordable properties for sale in Compton And Otterbourne?
The streets with the most affordable properties for sale in Compton And Otterbourne are Old Parsonage Court at an average of £177,666, Tilden Road at an average of £187,575 and Martins Fields at an average of £252,962.
Which train stations are available in or near Compton And Otterbourne?
Some of the train stations available in or near Compton And Otterbourne are Shawford, Chandlers Ford and Eastleigh.
Property Price Paid in Compton And Otterbourne by Year
The average sold property price by year was:
| Year | Average Sold Price | Price Change |
Sold Properties
|
|---|---|---|---|
| 2025 | £921,674 | 4% |
37 Properties |
| 2024 | £884,857 | 15% |
53 Properties |
| 2023 | £754,768 | 1% |
40 Properties |
| 2022 | £744,954 | 4% |
61 Properties |
| 2021 | £711,659 | -7% |
92 Properties |
| 2020 | £763,312 | 12% |
60 Properties |
| 2019 | £671,943 | -6% |
54 Properties |
| 2018 | £712,076 | 25% |
38 Properties |
| 2017 | £531,871 | 1% |
57 Properties |
| 2016 | £527,699 | -27% |
60 Properties |
| 2015 | £667,758 | 20% |
56 Properties |
| 2014 | £531,288 | -13% |
69 Properties |
| 2013 | £600,844 | 17% |
48 Properties |
| 2012 | £496,164 | 5% |
74 Properties |
| 2011 | £473,136 | 1% |
66 Properties |
| 2010 | £468,312 | 20% |
62 Properties |
| 2009 | £374,493 | -27% |
57 Properties |
| 2008 | £475,786 | 8% |
38 Properties |
| 2007 | £436,683 | 12% |
121 Properties |
| 2006 | £384,424 | -4% |
100 Properties |
| 2005 | £397,928 | 2% |
66 Properties |
| 2004 | £391,387 | 8% |
80 Properties |
| 2003 | £360,843 | 12% |
80 Properties |
| 2002 | £317,778 | 9% |
80 Properties |
| 2001 | £288,810 | 21% |
86 Properties |
| 2000 | £227,882 | 10% |
75 Properties |
| 1999 | £204,517 | 14% |
91 Properties |
| 1998 | £175,684 | 18% |
85 Properties |
| 1997 | £144,437 | 1% |
62 Properties |
| 1996 | £143,353 | 20% |
75 Properties |
| 1995 | £114,180 | - |
94 Properties |
Property Price per Property Type in Compton And Otterbourne
Here you can find historic sold price data in order to help with your property search.
The average Property Paid Price for specific property types in the last three years are:
| Property Type | Average Sold Price | Sold Properties |
|---|---|---|
| Semi Detached House | £623,493.00 | 22 Semi Detached Houses |
| Detached House | £1,208,770.00 | 67 Detached Houses |
| Terraced House | £545,719.00 | 19 Terraced Houses |
| Flat | £278,047.00 | 22 Flats |

