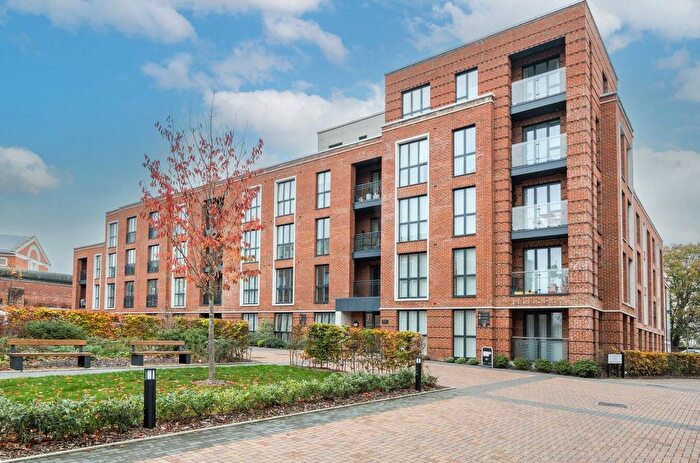
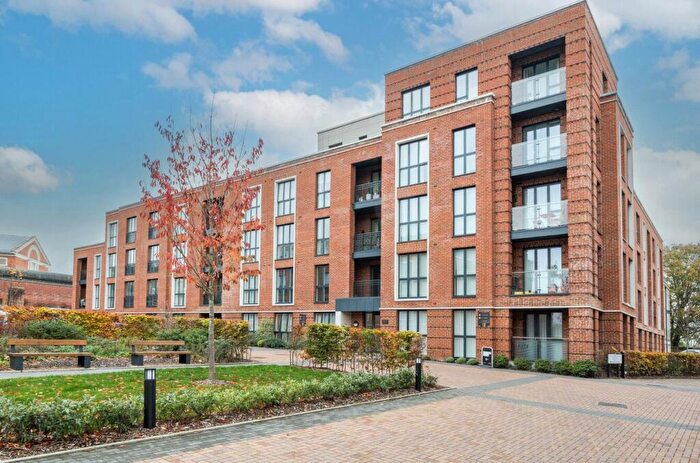
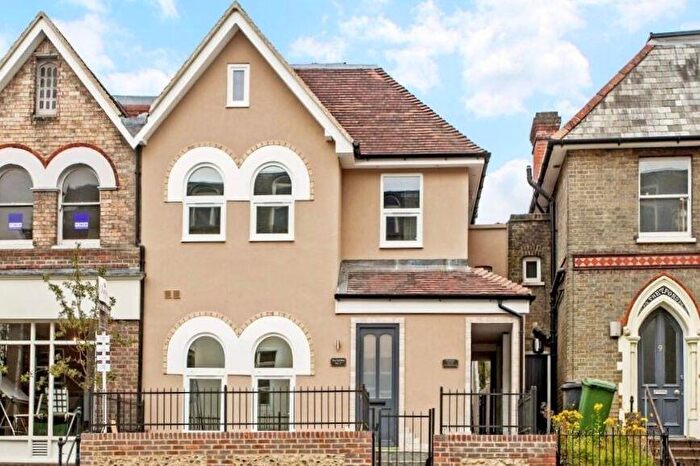
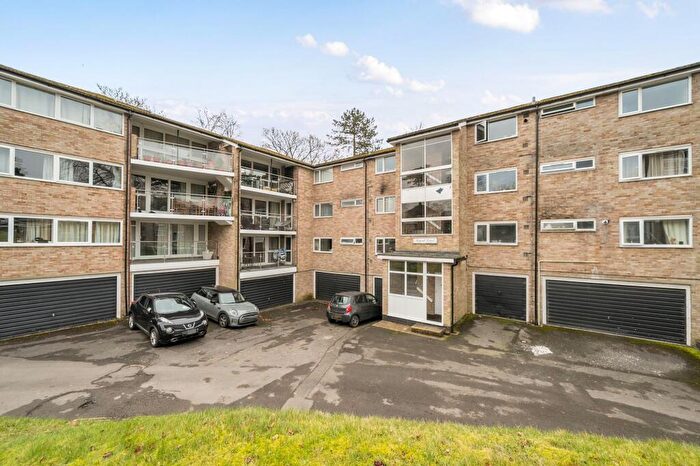
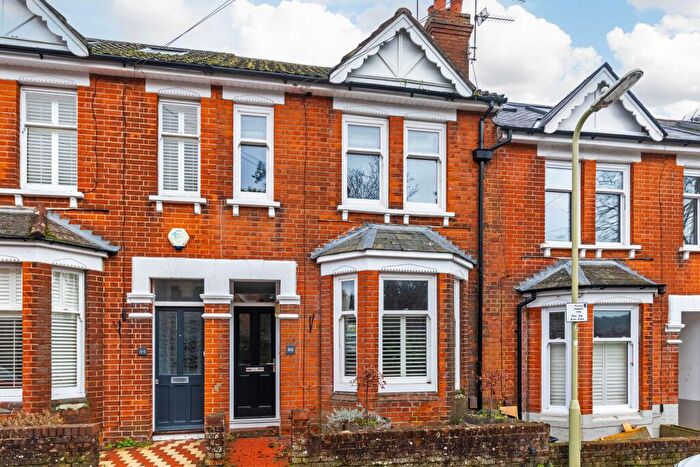
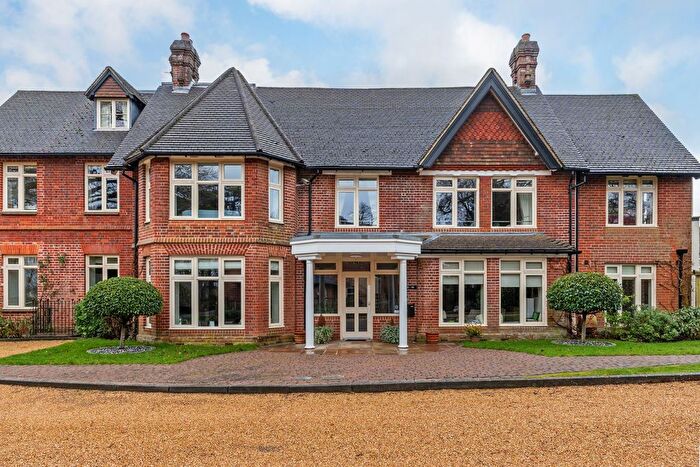
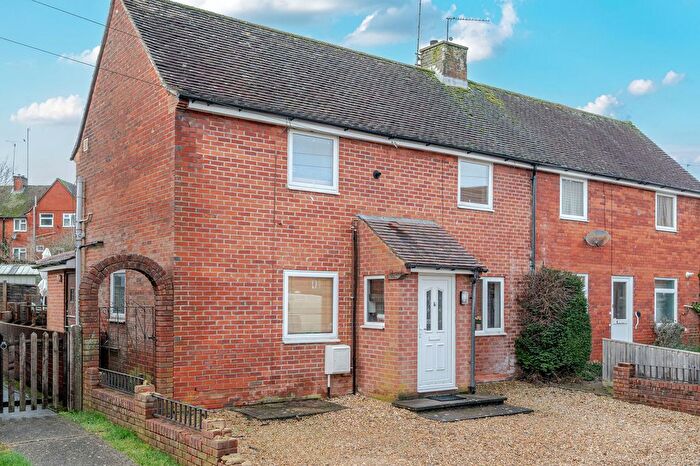
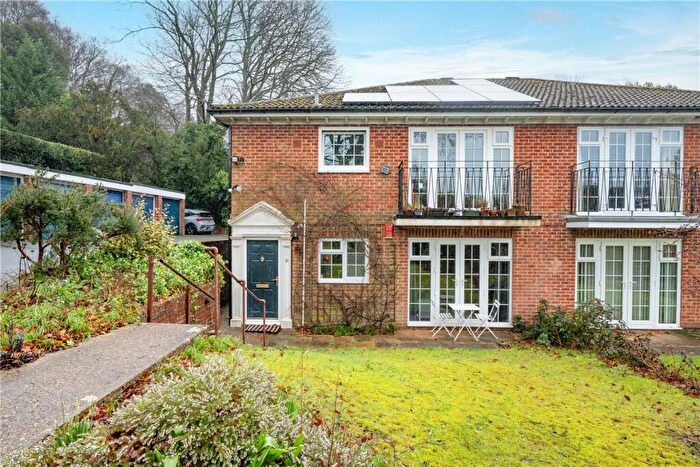
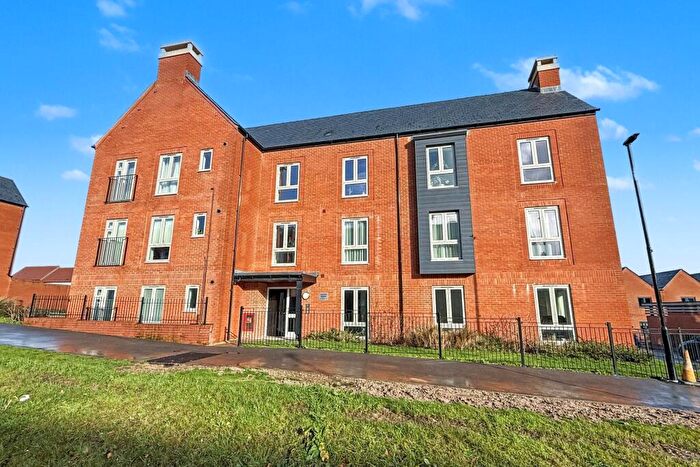
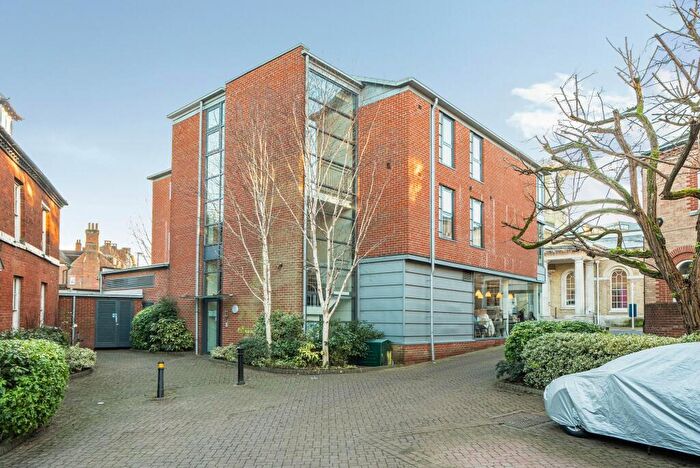
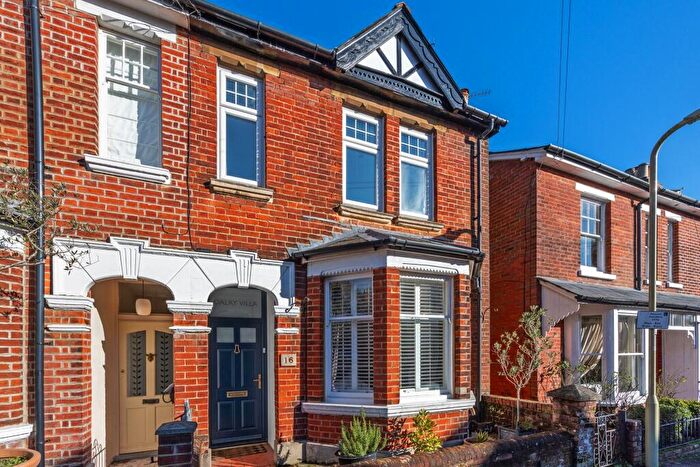
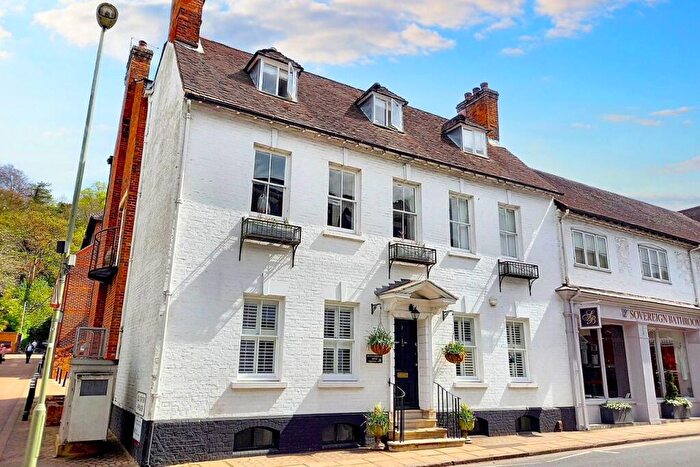
Houses for sale & to rent in Winchester, Hampshire
House Prices in Winchester
Properties in Winchester have an average house price of £633,899.00 and had 2,526 Property Transactions within the last 3 years.¹
Winchester is an area in Hampshire with 27,884 households², where the most expensive property was sold for £8,750,000.00.
Properties for sale in Winchester
Neighbourhoods in Winchester
Navigate through our locations to find the location of your next house in Winchester, Hampshire for sale or to rent.
- Ampfield And Braishfield
- Cheriton And Bishops Sutton
- Colden Common And Twyford
- Compton And Otterbourne
- Harewood
- Itchen Valley
- Kings Worthy
- Littleton And Harestock
- Oakley And North Waltham
- Olivers Battery And Badger Farm
- Overton, Laverstoke And Steventon
- Owslebury And Curdridge
- Sparsholt
- St Barnabas
- St Bartholomew
- St John And All Saints
- St Luke
- St Michael
- St Paul
- Wonston And Micheldever
- Alresford and Itchen Valley
- The Worthys
- Badger Farm and Oliver's Battery
- Oakley & The Candovers
- Upper Meon Valley
Transport in Winchester
Please see below transportation links in this area:
-
Winchester Station
-
Shawford Station
-
Chandlers Ford Station
-
Eastleigh Station
-
Micheldever Station
-
Southampton Airport (Parkway) Station
-
Swaythling Station
-
Romsey Station
-
Hedge End Station
- FAQ
- Price Paid By Year
- Property Type Price
Frequently asked questions about Winchester
What is the average price for a property for sale in Winchester?
The average price for a property for sale in Winchester is £633,899. This amount is 51% higher than the average price in Hampshire. There are more than 10,000 property listings for sale in Winchester.
What locations have the most expensive properties for sale in Winchester?
The locations with the most expensive properties for sale in Winchester are Cheriton And Bishops Sutton at an average of £1,500,000, Badger Farm and Oliver's Battery at an average of £1,432,500 and Itchen Valley at an average of £1,187,390.
What locations have the most affordable properties for sale in Winchester?
The locations with the most affordable properties for sale in Winchester are Alresford and Itchen Valley at an average of £250,000, Olivers Battery And Badger Farm at an average of £485,992 and St Luke at an average of £486,910.
Which train stations are available in or near Winchester?
Some of the train stations available in or near Winchester are Winchester, Shawford and Chandlers Ford.
Property Price Paid in Winchester by Year
The average sold property price by year was:
| Year | Average Sold Price | Price Change |
Sold Properties
|
|---|---|---|---|
| 2025 | £611,812 | -3% |
730 Properties |
| 2024 | £631,656 | -4% |
954 Properties |
| 2023 | £655,590 | 1% |
842 Properties |
| 2022 | £649,311 | 5% |
1,083 Properties |
| 2021 | £615,626 | 0,4% |
1,511 Properties |
| 2020 | £612,959 | 8% |
979 Properties |
| 2019 | £563,465 | 3% |
1,078 Properties |
| 2018 | £546,163 | - |
1,055 Properties |
| 2017 | £546,344 | 8% |
1,069 Properties |
| 2016 | £503,007 | 5% |
1,096 Properties |
| 2015 | £480,014 | 10% |
1,261 Properties |
| 2014 | £433,198 | 5% |
1,244 Properties |
| 2013 | £413,191 | 5% |
1,124 Properties |
| 2012 | £391,398 | 3% |
948 Properties |
| 2011 | £380,532 | -1% |
1,039 Properties |
| 2010 | £383,139 | 10% |
1,038 Properties |
| 2009 | £342,969 | -2% |
984 Properties |
| 2008 | £348,688 | -3% |
837 Properties |
| 2007 | £359,105 | 12% |
1,492 Properties |
| 2006 | £316,998 | 2% |
1,699 Properties |
| 2005 | £310,861 | 1% |
1,328 Properties |
| 2004 | £306,690 | 8% |
1,381 Properties |
| 2003 | £282,398 | 10% |
1,288 Properties |
| 2002 | £253,724 | 16% |
1,355 Properties |
| 2001 | £212,263 | 6% |
1,433 Properties |
| 2000 | £198,931 | 21% |
1,266 Properties |
| 1999 | £157,538 | 12% |
1,423 Properties |
| 1998 | £138,828 | 9% |
1,289 Properties |
| 1997 | £125,749 | 8% |
1,390 Properties |
| 1996 | £115,950 | 7% |
1,284 Properties |
| 1995 | £108,264 | - |
1,013 Properties |
Property Price per Property Type in Winchester
Here you can find historic sold price data in order to help with your property search.
The average Property Paid Price for specific property types in the last three years are:
| Property Type | Average Sold Price | Sold Properties |
|---|---|---|
| Semi Detached House | £569,173.00 | 574 Semi Detached Houses |
| Terraced House | £536,663.00 | 721 Terraced Houses |
| Detached House | £946,377.00 | 789 Detached Houses |
| Flat | £318,776.00 | 442 Flats |

