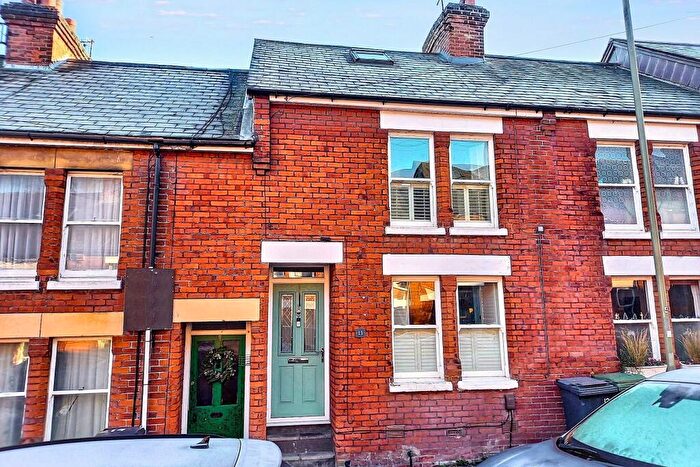
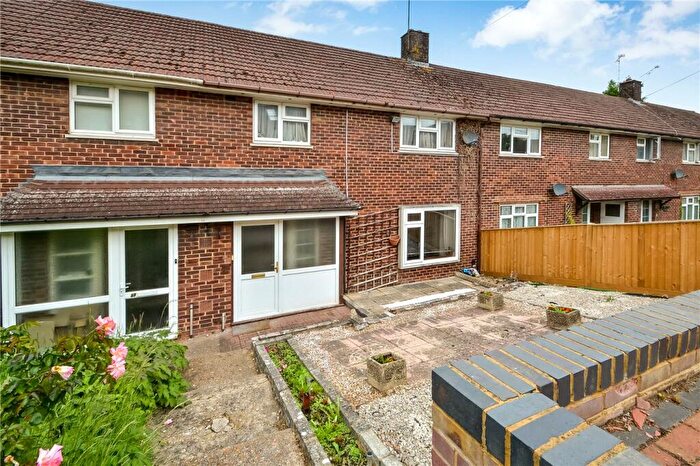
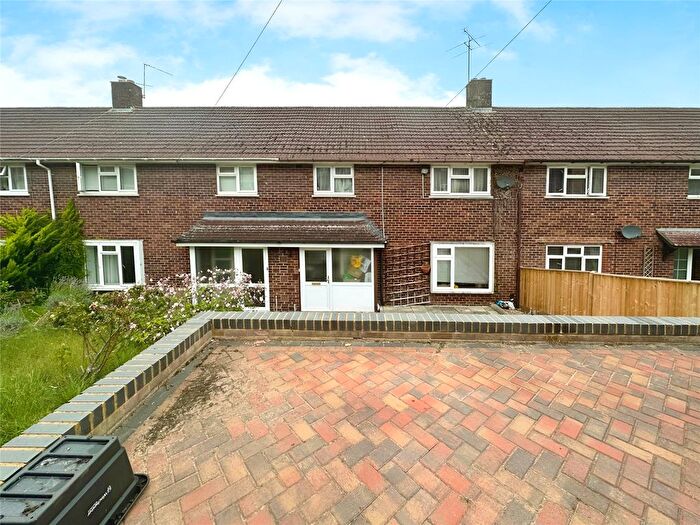
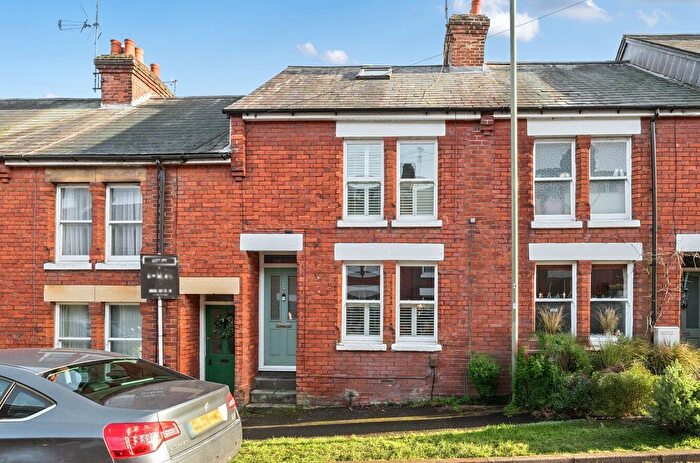
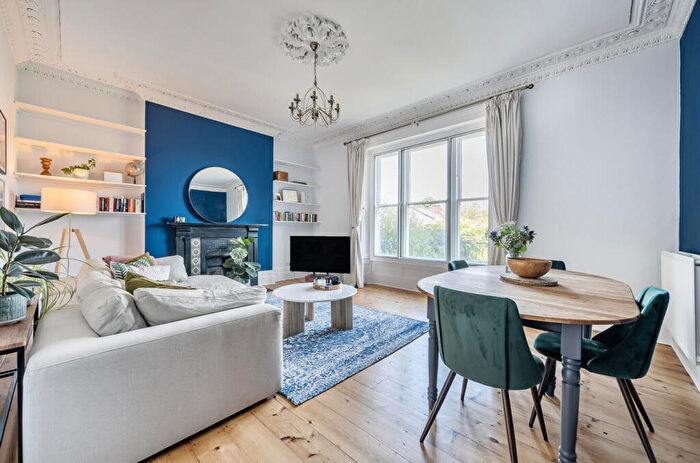
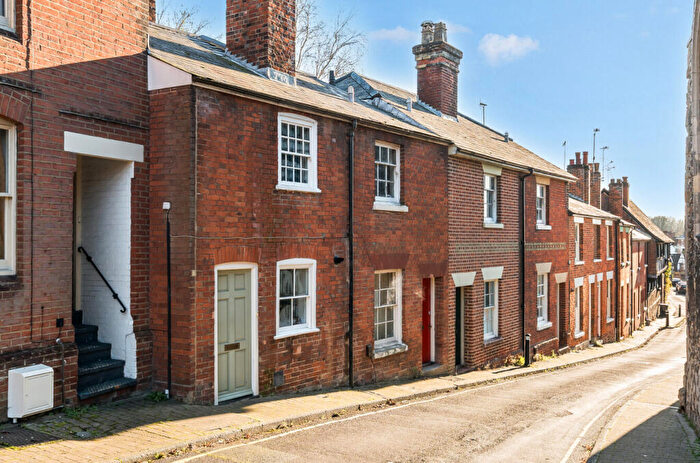
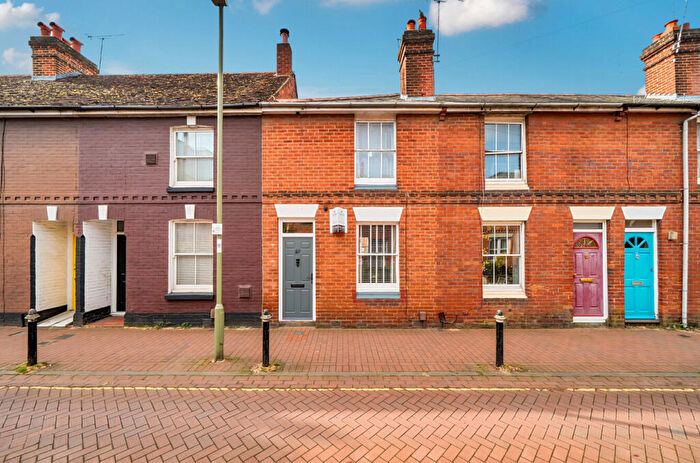
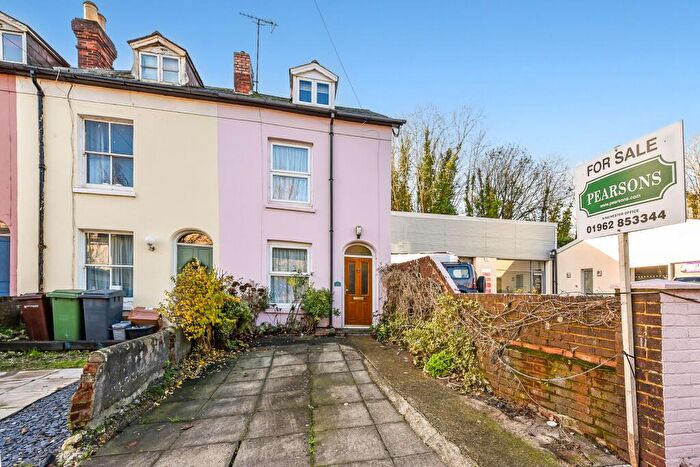
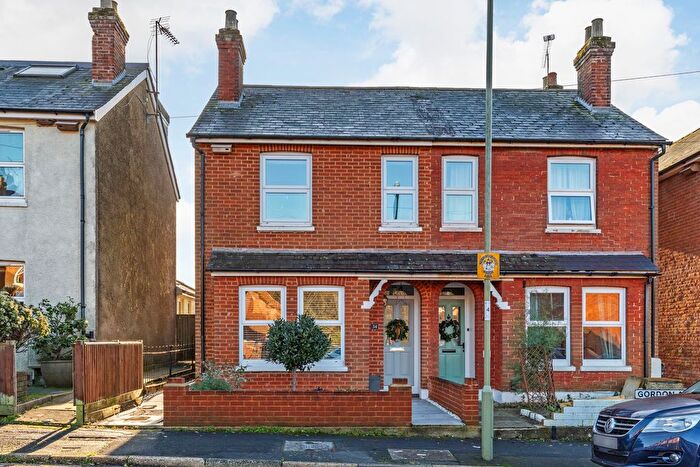
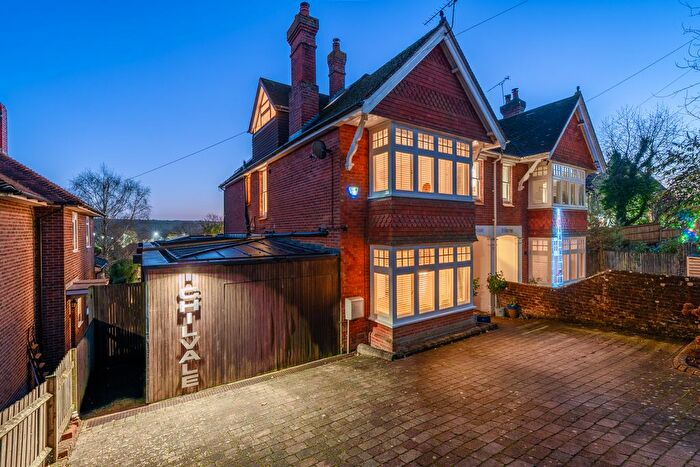
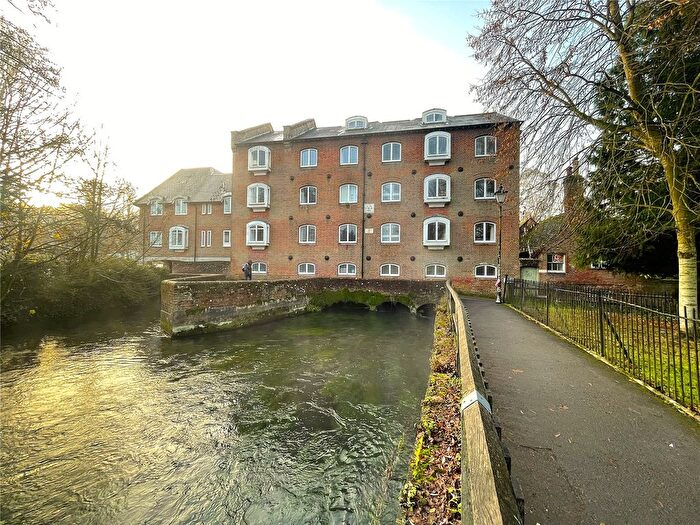
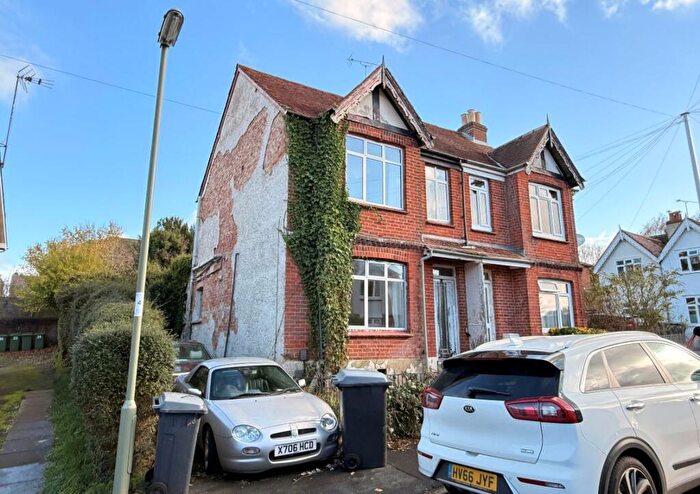
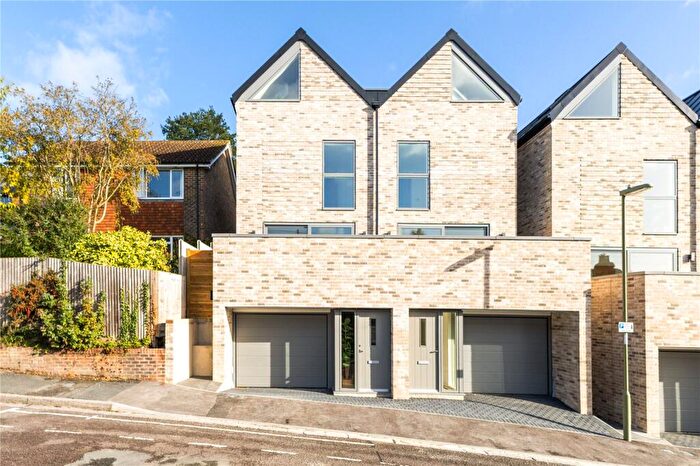
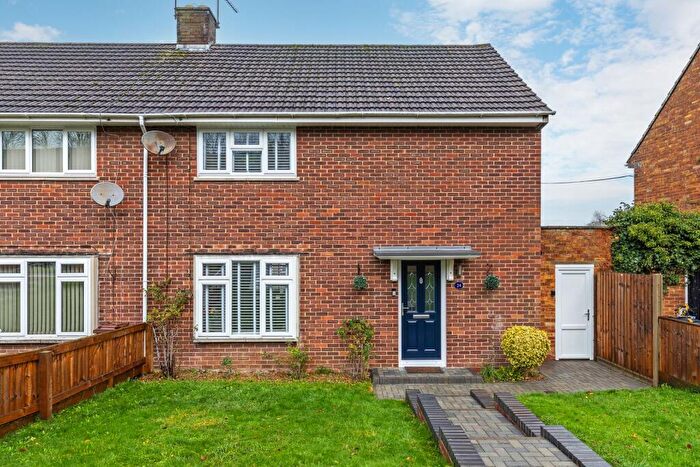
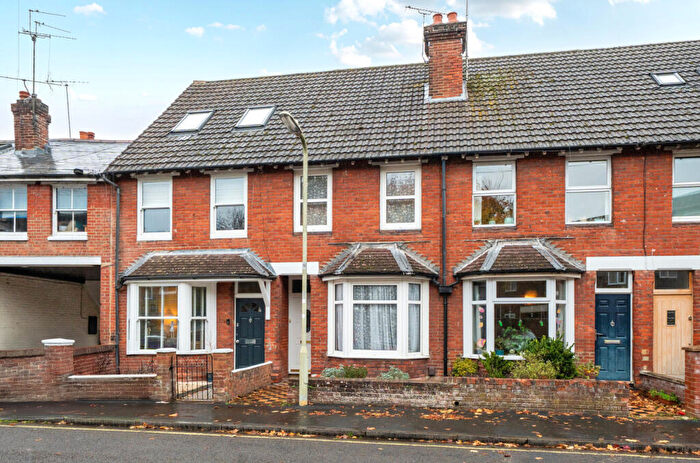
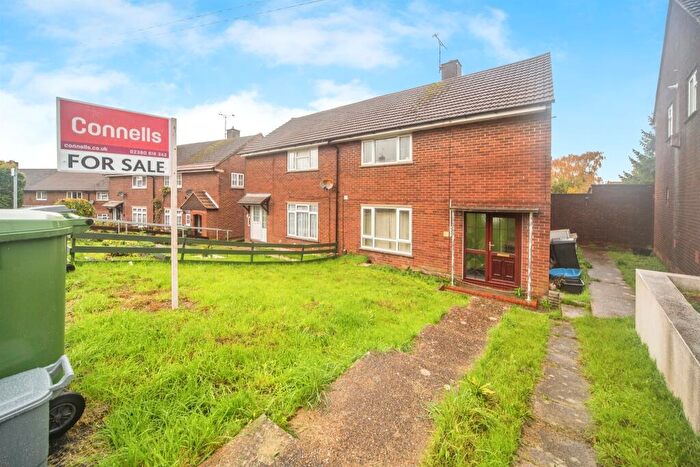
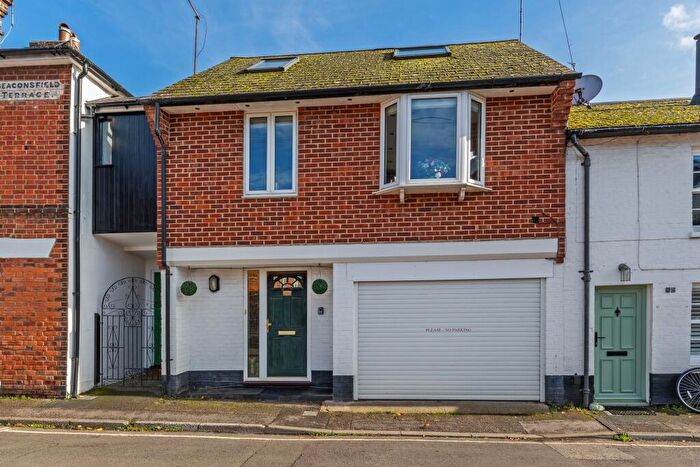
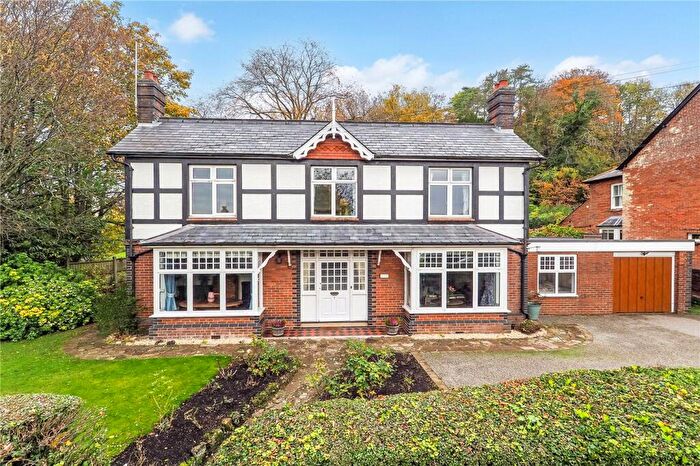
Houses for sale & to rent in St John And All Saints, Winchester
House Prices in St John And All Saints
Properties in St John And All Saints have an average house price of £521,358.00 and had 231 Property Transactions within the last 3 years¹.
St John And All Saints is an area in Winchester, Hampshire with 2,277 households², where the most expensive property was sold for £2,075,000.00.
Properties for sale in St John And All Saints
Roads and Postcodes in St John And All Saints
Navigate through our locations to find the location of your next house in St John And All Saints, Winchester for sale or to rent.
| Streets | Postcodes |
|---|---|
| Alresford Road | SO21 1HB SO23 0HG SO23 0JX SO23 0JY SO23 0JZ SO23 0LA |
| Baigent Close | SO23 0PE |
| Baring Road | SO23 0JN |
| Blue Ball Corner | SO23 0ER |
| Blue Ball Hill | SO23 0AF |
| Bridge Street | SO23 0HL |
| Canute Road | SO23 0PW |
| Cathedral View | SO23 0PR |
| Chalk Ridge | SO23 0QW |
| Chesil Wood | SO23 0DA |
| Chester Road | SO23 0EL |
| Chilcomb Lane | SO23 8RB |
| Chilcomb Place | SO23 0HZ |
| Colson Road | SO23 0EX |
| Dell Road | SO23 0QB |
| Easthill | SO23 0JA SO23 0JB |
| Easton Lane | SO23 0HA |
| Ebden Road | SO23 0NF |
| Fairdown Close | SO23 0JU |
| Fiona Close | SO23 0HB |
| Firmstone Road | SO23 0NZ SO23 0PA SO23 0PB |
| Fivefields Close | SO23 0QT |
| Fivefields Road | SO23 0QN SO23 0QR SO23 0QS |
| Furley Close | SO23 0PF |
| Garbett Road | SO23 0NX SO23 0NY |
| Gordon Avenue | SO23 0QE SO23 0QH SO23 0QL SO23 0QP SO23 0QQ |
| Highcliffe Road | SO23 0JE |
| Highmount Close | SO23 0JT |
| Imber Road | SO23 0NH SO23 0NQ |
| Longfield Road | SO23 0NS SO23 0NT SO23 0NU |
| Magdalen Hill | SO23 0AD SO23 0HJ |
| Magdalen Mews | SO23 0HT |
| Manor Close | SO23 0PH |
| Milesdown Place | SO23 0AG |
| Milland Road | SO23 0PZ SO23 0QA |
| Moss Road | SO23 0NG SO23 0PG |
| Nelson Road | SO23 0QF |
| Northbrook Avenue | SO23 0JP SO23 0JW SO23 0LE SO23 0LU |
| Northbrook Close | SO23 0JR |
| Palm Hall Close | SO23 0JL |
| Petersfield Road | SO23 0JD SO23 8RU |
| Portal Road | SO23 0PU SO23 0PX |
| Quarry Road | SO23 0HR SO23 0JF SO23 0JG SO23 0JS |
| Shepherds Road | SO23 0NP SO23 0NR |
| St Catherines Road | SO23 0PP SO23 0PS |
| St Catherines View | SO23 8RA |
| St Giles Close | SO23 0JJ |
| St Giles Hill | SO23 0HH SO23 0JH |
| St Johns Mead | SO23 0HE |
| St Johns Road | SO23 0HQ |
| St Johns Street | SO23 0HF |
| St Leonards Road | SO23 0QD |
| St Martins Close | SO23 0HD |
| Stratton Road | SO23 0JQ |
| Vale Road | SO23 0PT SO23 0PY |
| Wales Street | SO23 0ET SO23 0EU SO23 0EY |
| Warren Road | SO23 0NL |
| Water Lane | SO23 0EJ SO23 0ES SO23 0EW |
| Winnall Manor Road | SO23 0LX SO23 0LY SO23 0LZ SO23 0NA SO23 0NJ SO23 0NN SO23 0NW SO23 0PD |
| SO23 0QU |
Transport near St John And All Saints
-
Winchester Station
-
Shawford Station
-
Chandlers Ford Station
-
Eastleigh Station
-
Southampton Airport (Parkway) Station
-
Micheldever Station
-
Hedge End Station
-
Swaythling Station
-
Romsey Station
- FAQ
- Price Paid By Year
- Property Type Price
Frequently asked questions about St John And All Saints
What is the average price for a property for sale in St John And All Saints?
The average price for a property for sale in St John And All Saints is £521,358. This amount is 18% lower than the average price in Winchester. There are 692 property listings for sale in St John And All Saints.
What streets have the most expensive properties for sale in St John And All Saints?
The streets with the most expensive properties for sale in St John And All Saints are Stratton Road at an average of £1,487,500, Petersfield Road at an average of £890,000 and St Giles Close at an average of £777,500.
What streets have the most affordable properties for sale in St John And All Saints?
The streets with the most affordable properties for sale in St John And All Saints are Winnall Manor Road at an average of £271,500, Manor Close at an average of £297,250 and Firmstone Road at an average of £305,250.
Which train stations are available in or near St John And All Saints?
Some of the train stations available in or near St John And All Saints are Winchester, Shawford and Chandlers Ford.
Property Price Paid in St John And All Saints by Year
The average sold property price by year was:
| Year | Average Sold Price | Price Change |
Sold Properties
|
|---|---|---|---|
| 2025 | £521,414 | 4% |
41 Properties |
| 2024 | £498,336 | -3% |
58 Properties |
| 2023 | £511,520 | -7% |
58 Properties |
| 2022 | £547,083 | 11% |
74 Properties |
| 2021 | £486,977 | 14% |
112 Properties |
| 2020 | £419,334 | -16% |
63 Properties |
| 2019 | £487,558 | 3% |
100 Properties |
| 2018 | £474,488 | 12% |
66 Properties |
| 2017 | £417,989 | 4% |
56 Properties |
| 2016 | £400,099 | 10% |
65 Properties |
| 2015 | £361,086 | 4% |
80 Properties |
| 2014 | £345,512 | -2% |
73 Properties |
| 2013 | £354,110 | -1% |
91 Properties |
| 2012 | £356,591 | 1% |
77 Properties |
| 2011 | £353,125 | 15% |
79 Properties |
| 2010 | £301,114 | 8% |
57 Properties |
| 2009 | £276,867 | -8% |
53 Properties |
| 2008 | £299,823 | 13% |
57 Properties |
| 2007 | £259,980 | 2% |
96 Properties |
| 2006 | £255,316 | 5% |
109 Properties |
| 2005 | £242,636 | 2% |
116 Properties |
| 2004 | £238,214 | 19% |
79 Properties |
| 2003 | £192,497 | -4% |
77 Properties |
| 2002 | £200,080 | 17% |
78 Properties |
| 2001 | £165,995 | 11% |
94 Properties |
| 2000 | £146,922 | 21% |
97 Properties |
| 1999 | £115,699 | 3% |
99 Properties |
| 1998 | £111,840 | 6% |
99 Properties |
| 1997 | £105,550 | 19% |
88 Properties |
| 1996 | £85,277 | 21% |
86 Properties |
| 1995 | £67,662 | - |
49 Properties |
Property Price per Property Type in St John And All Saints
Here you can find historic sold price data in order to help with your property search.
The average Property Paid Price for specific property types in the last three years are:
| Property Type | Average Sold Price | Sold Properties |
|---|---|---|
| Semi Detached House | £472,087.00 | 64 Semi Detached Houses |
| Detached House | £1,004,545.00 | 33 Detached Houses |
| Terraced House | £468,027.00 | 98 Terraced Houses |
| Flat | £311,211.00 | 36 Flats |

