
Houses for sale & to rent in St Bartholomew, Winchester
House Prices in St Bartholomew
Properties in St Bartholomew have an average house price of £553k and had 357 Property Transactions within the last 3 years¹.
St Bartholomew is an area in Winchester, Hampshire with 3,058 households², where the most expensive property was sold for £2.43M.
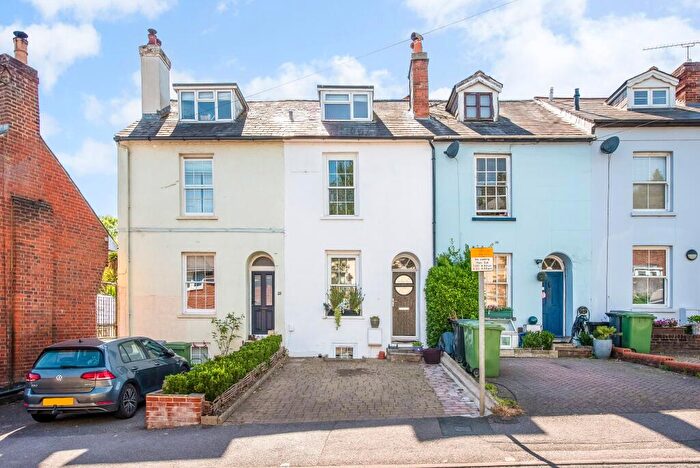
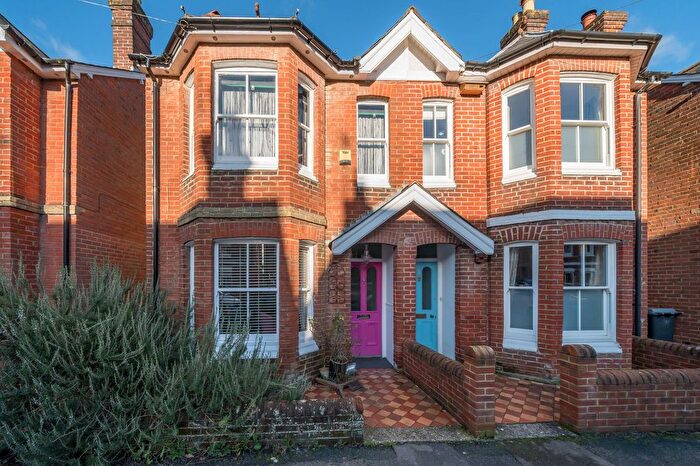
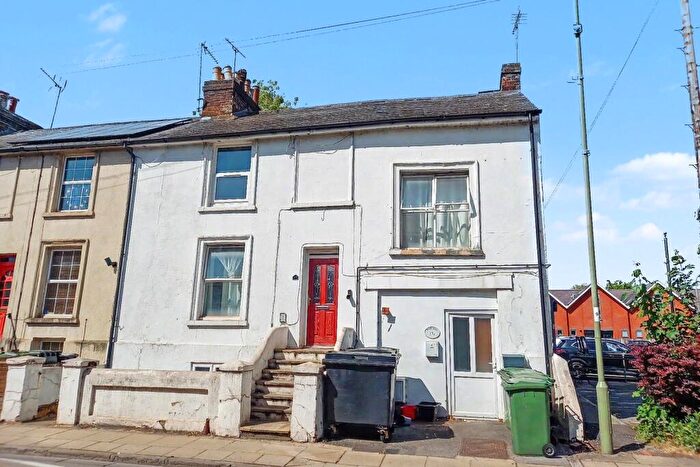
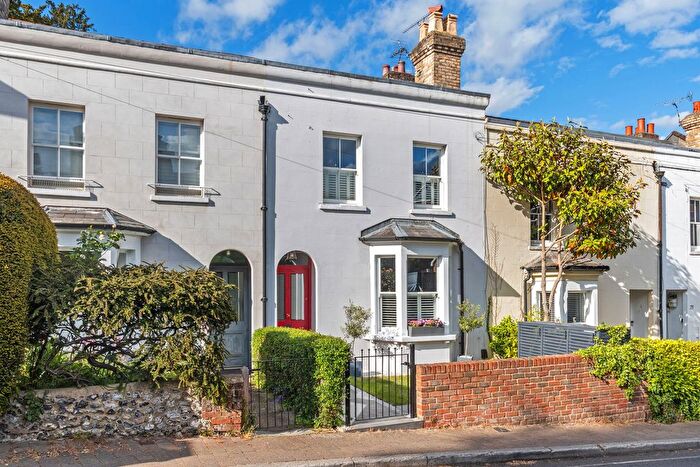
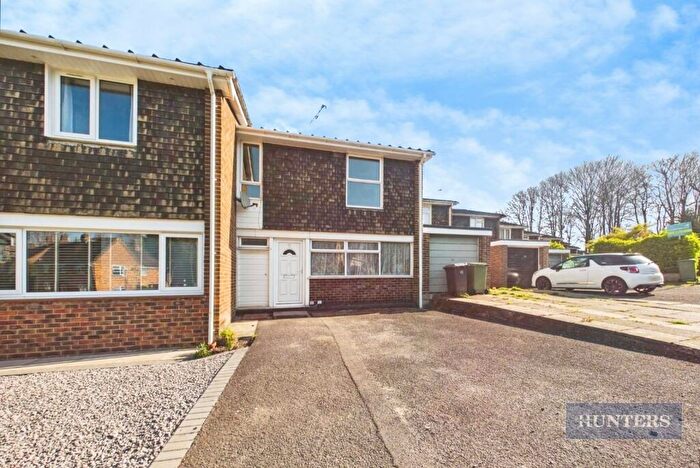
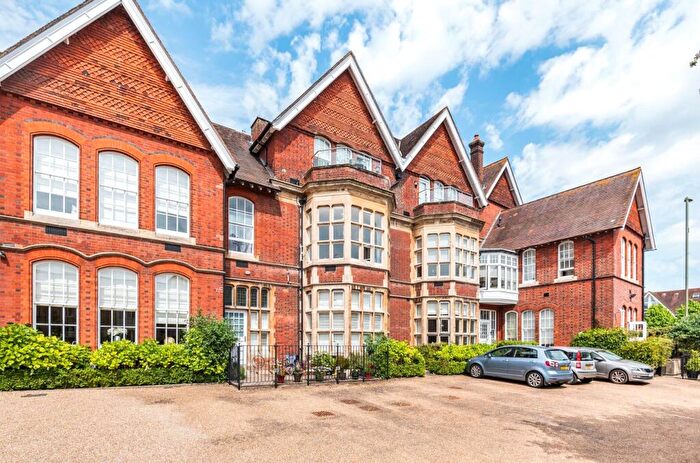
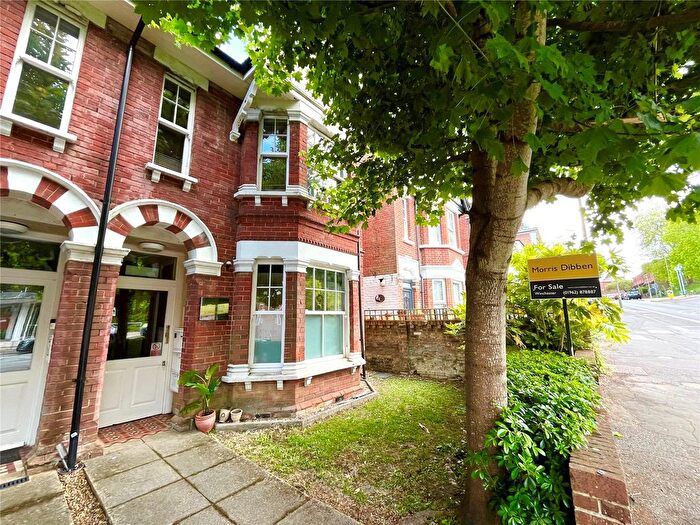
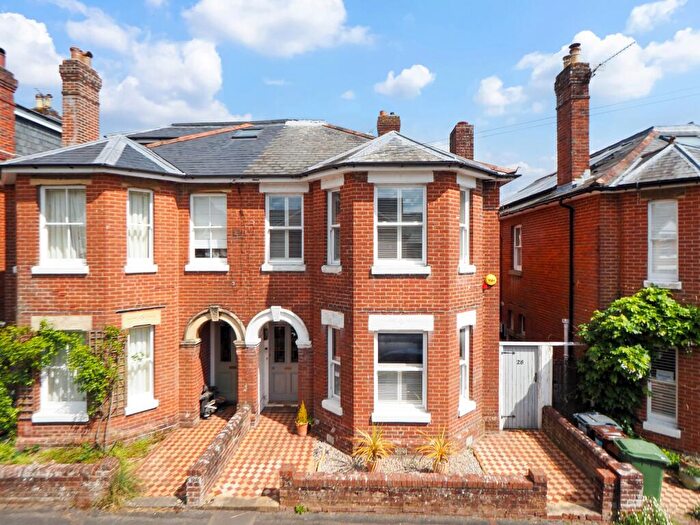
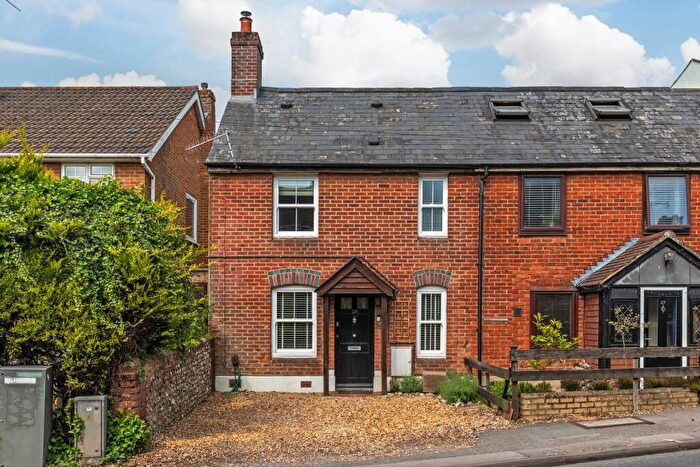
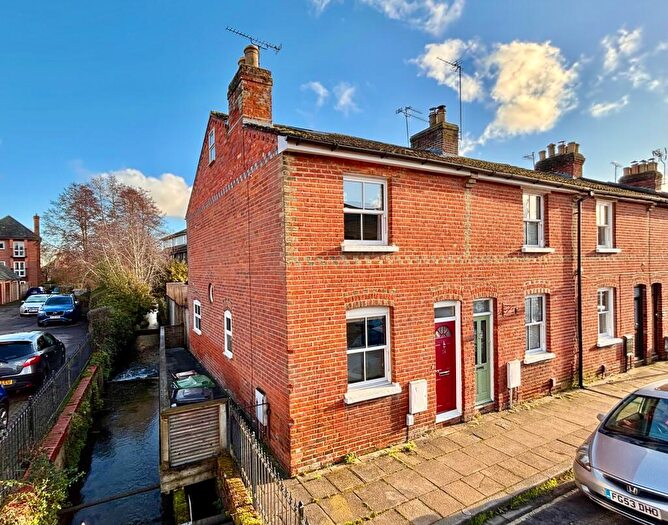
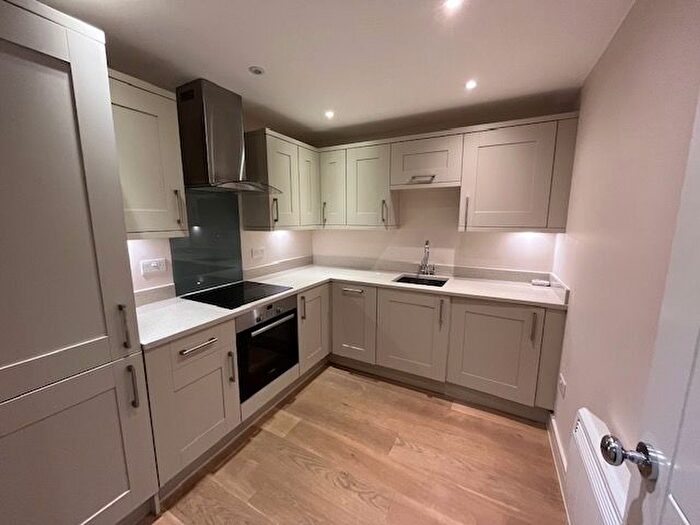
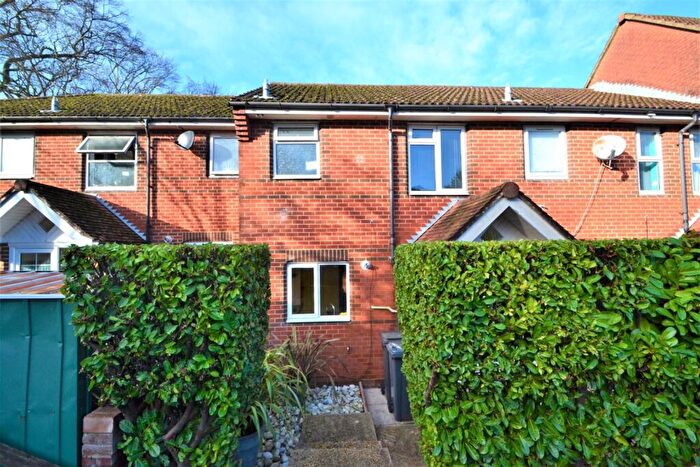
Properties for sale in St Bartholomew
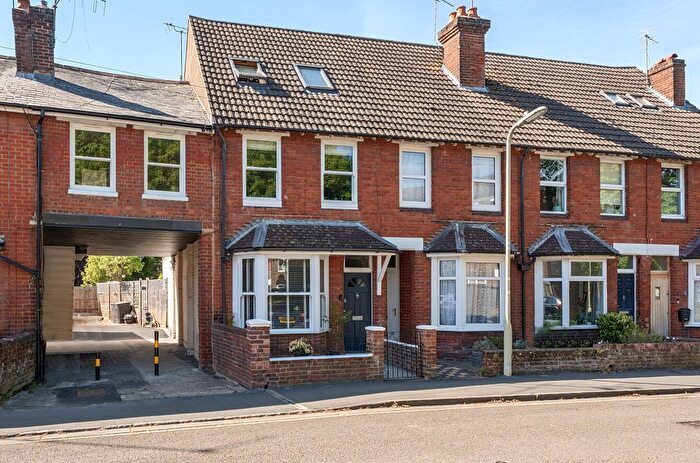
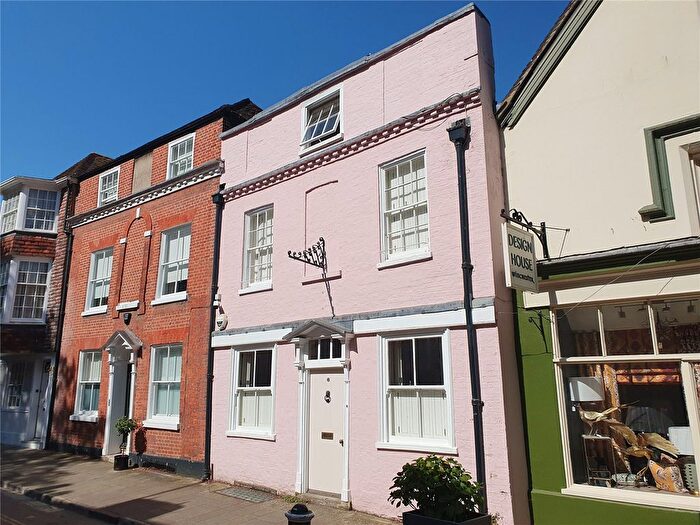
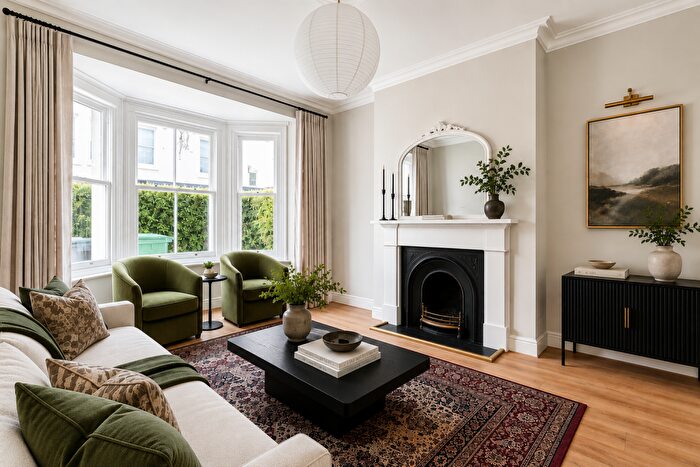
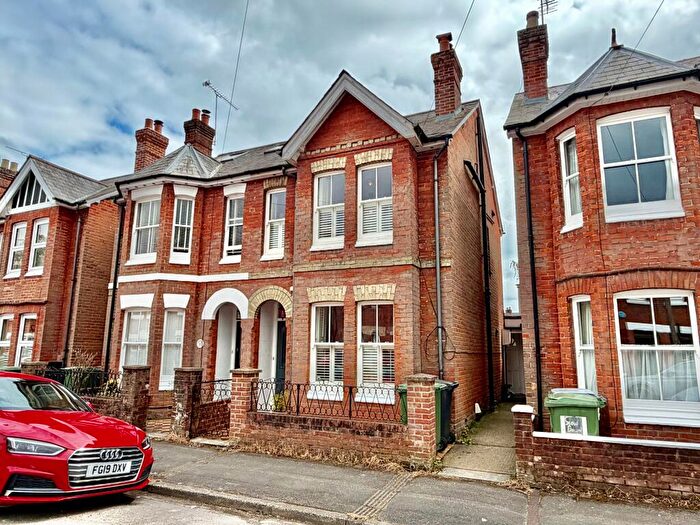
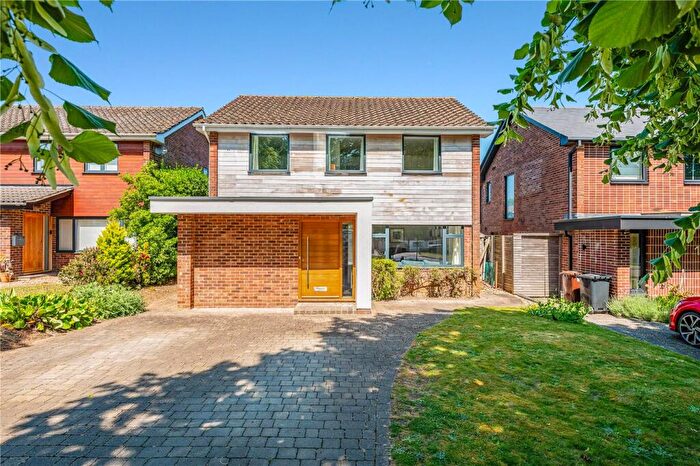
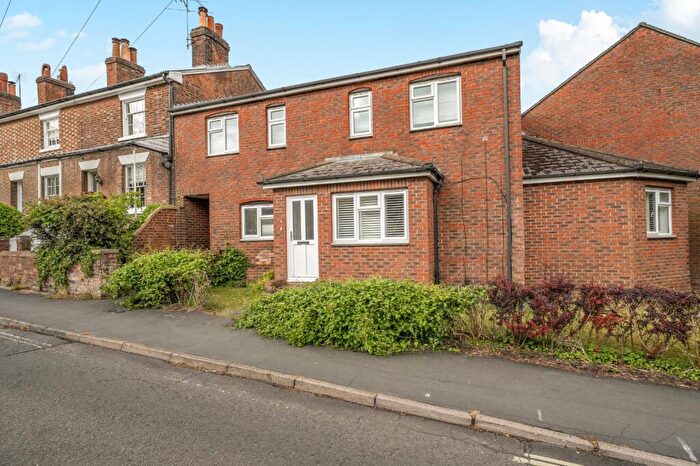
![]()
If you are looking to sell your house, let it out, or receive a property valuation, an expert can help you.
Click the button below to get started.
Roads and Postcodes in St Bartholomew
Navigate through our locations to find the location of your next house in St Bartholomew, Winchester for sale or to rent.
Transport near St Bartholomew
-
 Winchester Station
 -
Shawford Station
-
Chandlers Ford Station
-
Eastleigh Station
-
Micheldever Station
-
Southampton Airport (Parkway) Station
-
Swaythling Station
-
Hedge End Station
-
Romsey Station
- FAQ
- Price Paid By Year
- Property Type Price
Frequently asked questions about St Bartholomew
What is the average price for a property for sale in St Bartholomew?
The average price for a property for sale in St Bartholomew is £553,144. This amount is 12% lower than the average price in Winchester. There are 1,528 property listings for sale in St Bartholomew.
What streets have the most expensive properties for sale in St Bartholomew?
The streets with the most expensive properties for sale in St Bartholomew are Old Gardens at an average of £1,661,250, Jewry Street at an average of £1,075,000 and Park Close at an average of £987,500.
What streets have the most affordable properties for sale in St Bartholomew?
The streets with the most affordable properties for sale in St Bartholomew are Pilgrims Place at an average of £199,000, High Street at an average of £217,750 and Tower Street at an average of £220,000.
Which train stations are available in or near St Bartholomew?
Some of the train stations available in or near St Bartholomew are Winchester, Shawford and Chandlers Ford.
Property Price Paid in St Bartholomew by Year
The average sold property price by year was:
| Year | Average Sold Price | Price Change |
Sold Properties
|
|---|---|---|---|
| 2026 | £539,800 | -3% |
15 Properties |
| 2025 | £557,683 | 10% |
109 Properties |
| 2024 | £500,528 | -23% |
129 Properties |
| 2023 | £615,575 | 19% |
104 Properties |
| 2022 | £499,899 | 1% |
135 Properties |
| 2021 | £496,157 | -4% |
153 Properties |
| 2020 | £516,430 | 16% |
103 Properties |
| 2019 | £433,484 | -8% |
123 Properties |
| 2018 | £469,780 | 2% |
122 Properties |
| 2017 | £459,907 | -1% |
137 Properties |
| 2016 | £462,922 | 12% |
154 Properties |
| 2015 | £405,810 | 8% |
169 Properties |
| 2014 | £371,993 | -4% |
185 Properties |
| 2013 | £386,458 | 21% |
192 Properties |
| 2012 | £303,742 | -9% |
129 Properties |
| 2011 | £330,146 | -3% |
159 Properties |
| 2010 | £340,571 | 24% |
169 Properties |
| 2009 | £259,966 | -7% |
139 Properties |
| 2008 | £278,853 | -6% |
91 Properties |
| 2007 | £296,127 | 8% |
207 Properties |
| 2006 | £272,640 | 3% |
231 Properties |
| 2005 | £265,564 | 3% |
164 Properties |
| 2004 | £256,281 | -3% |
180 Properties |
| 2003 | £262,954 | 13% |
206 Properties |
| 2002 | £227,782 | 19% |
204 Properties |
| 2001 | £183,497 | 14% |
206 Properties |
| 2000 | £158,347 | 12% |
156 Properties |
| 1999 | £139,192 | 20% |
203 Properties |
| 1998 | £111,451 | 17% |
152 Properties |
| 1997 | £92,261 | 11% |
177 Properties |
| 1996 | £81,856 | -5% |
155 Properties |
| 1995 | £85,887 | - |
112 Properties |
Property Price per Property Type in St Bartholomew
Here you can find historic sold price data in order to help with your property search.
The average Property Paid Price for specific property types in the last three years are:
| Property Type | Average Sold Price | Sold Properties |
|---|---|---|
| Flat | £286,261.00 | 139 Flats |
| Semi Detached House | £776,826.00 | 46 Semi Detached Houses |
| Detached House | £949,640.00 | 50 Detached Houses |
| Terraced House | £610,378.00 | 122 Terraced Houses |