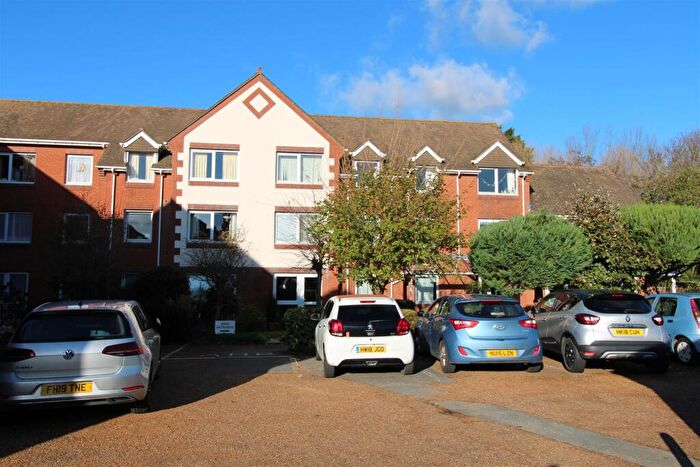
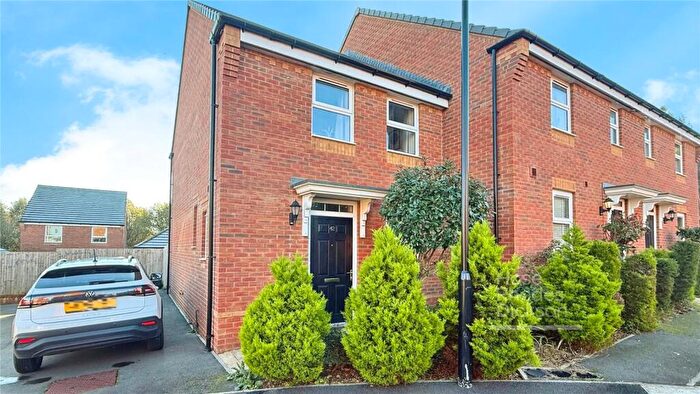
Houses for sale & to rent in Newport East, Newport
House Prices in Newport East
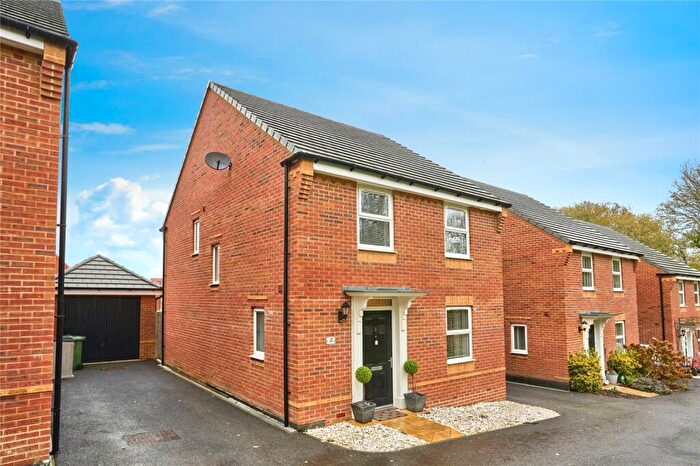
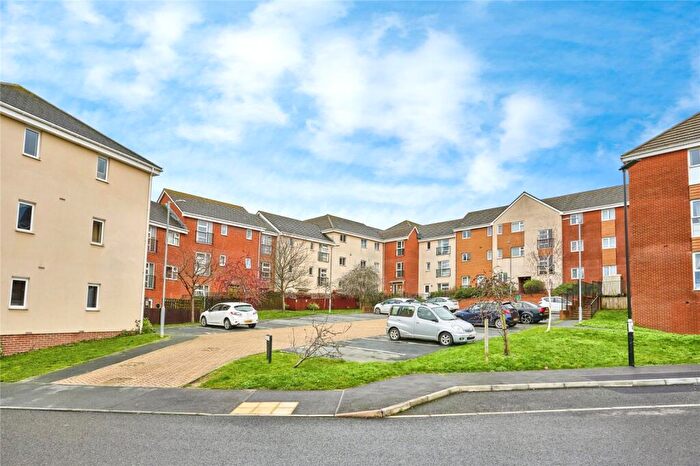
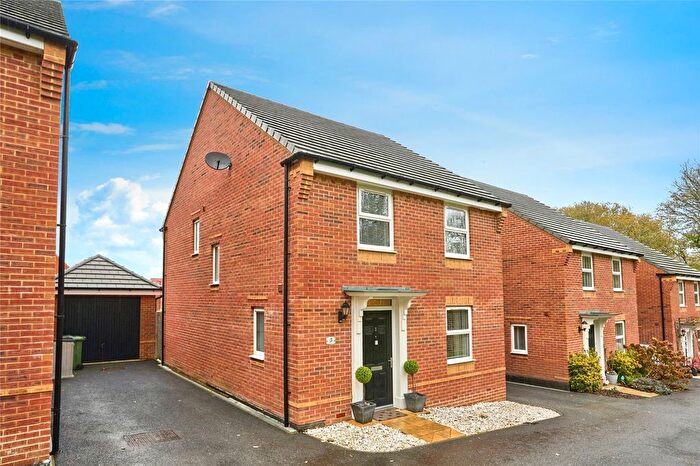
Properties in Newport East have an average house price of £219,059.00 and had 317 Property Transactions within the last 3 years¹.
Newport East is an area in Newport, Isle of Wight with 1,398 households², where the most expensive property was sold for £1,150,000.00.
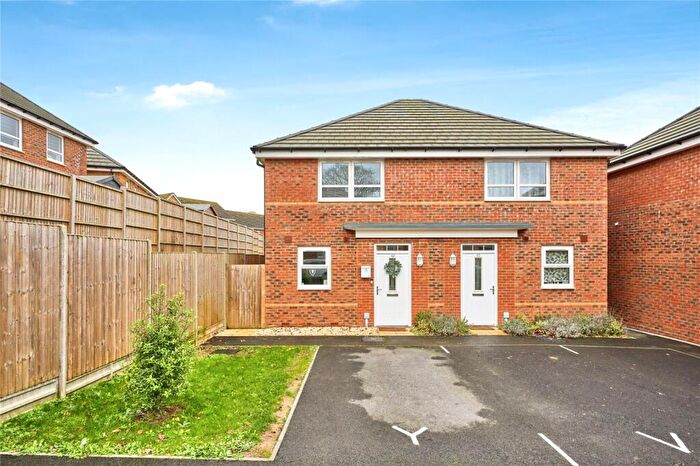
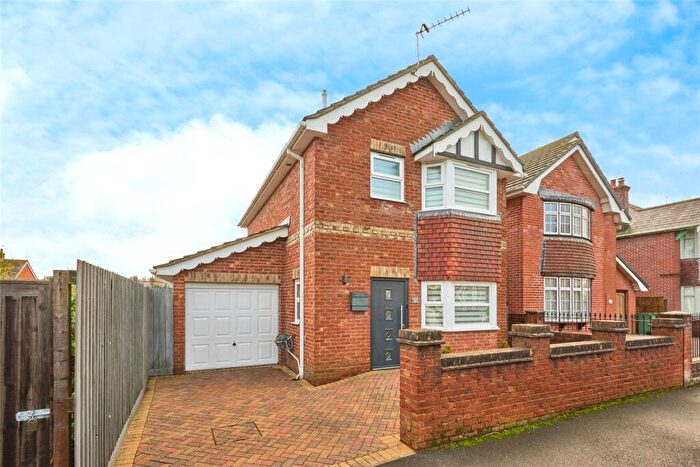
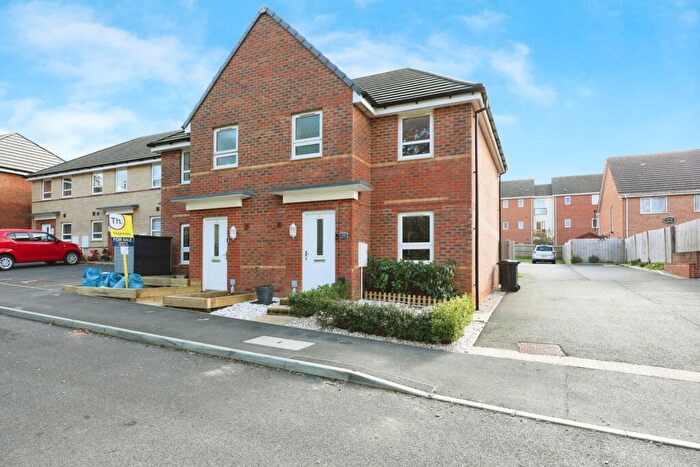
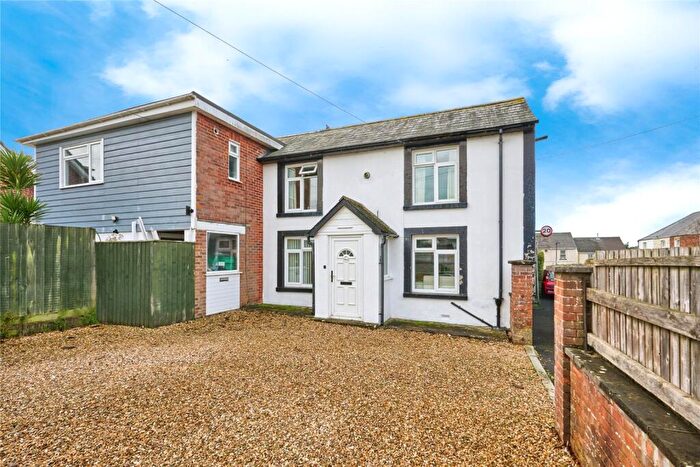
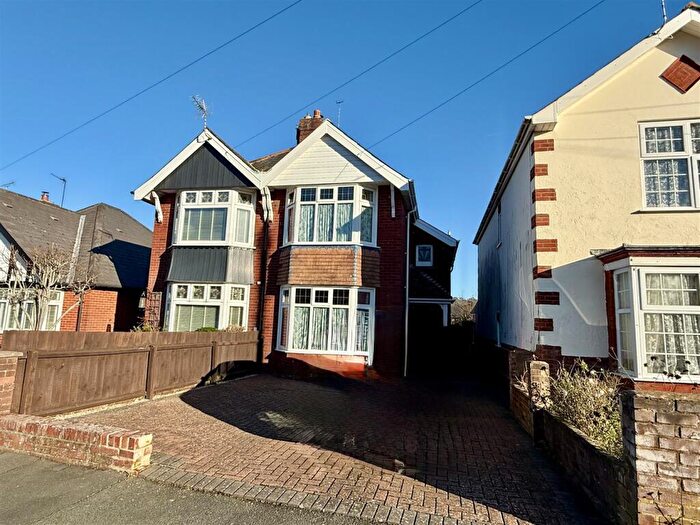
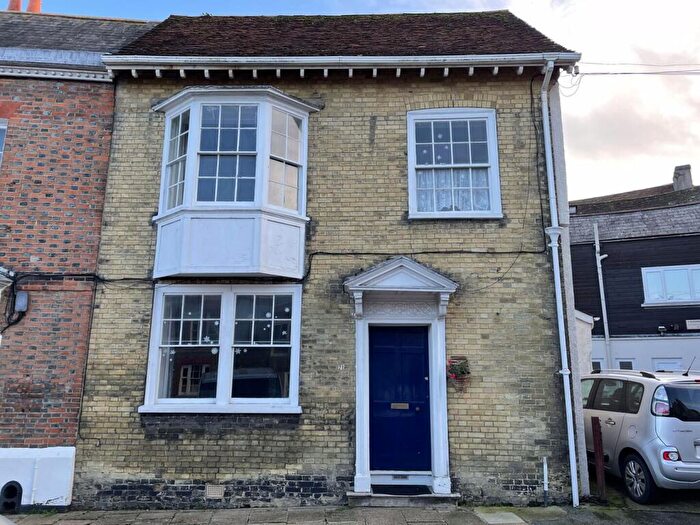
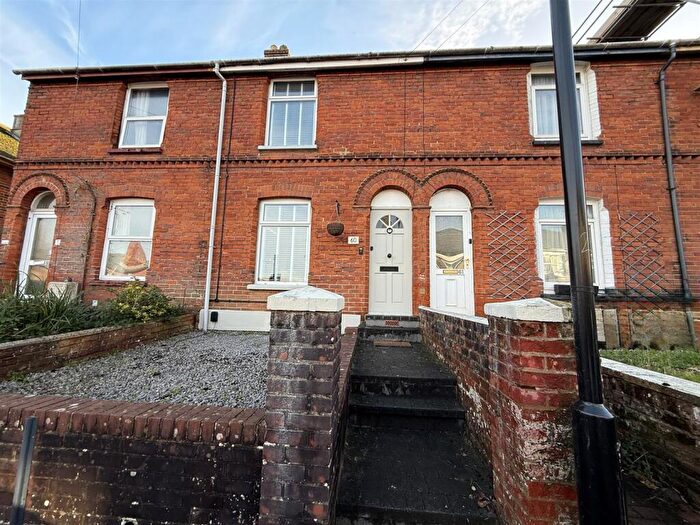
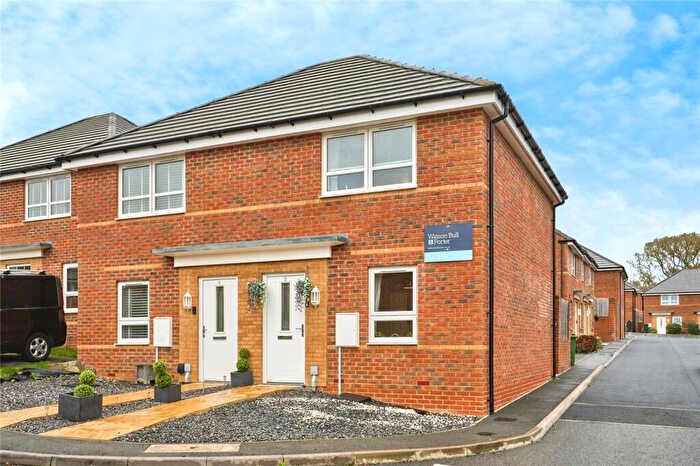
Properties for sale in Newport East
Roads and Postcodes in Newport East
Navigate through our locations to find the location of your next house in Newport East, Newport for sale or to rent.
| Streets | Postcodes |
|---|---|
| Angelica Grove | PO30 2GH |
| Ash Road | PO30 2AG PO30 2AQ |
| Badgers Walk | PO30 2GU |
| Barton Road | PO30 2HH PO30 2HJ PO30 2HL PO30 2JT |
| Beadmans Grove | PO30 2FD |
| Beauchamp Drive | PO30 2FE PO30 2FG |
| Beech Road | PO30 2AH |
| Bell Mews | PO30 2FY |
| Berry Close | PO30 2AU |
| Blackwater Road | PO30 3BB |
| Buckbury Close | PO30 2NN |
| Buckbury Heights | PO30 2LX |
| Buckbury Lane | PO30 2NJ PO30 2NL |
| Burnt House Lane | PO30 2PJ PO30 2PL |
| Canning Court | PO30 2FH |
| Chestnut Close | PO30 1YD |
| Chichester Walk | PO30 2BE |
| Chiverton Walk | PO30 2BS |
| Coppins Bridge | PO30 2BX PO30 2TA |
| Coppins Close | PO30 2DA |
| Cosham Close | PO30 2FL |
| Dairy Lane | PO30 1AL |
| Dormouse Drive | PO30 2HQ PO30 2JZ |
| Downs View Road | PO30 2AT |
| Flint Path | PO30 2FN |
| Foundry Road | PO30 2FJ PO30 2GR |
| Frank William Court | PO30 2RL |
| Furrlongs | PO30 2AP PO30 2AX PO30 2BA PO30 2BB PO30 2BD PO30 2BT PO30 2BU PO30 2AA PO30 2AF |
| Garden Way | PO30 2BN PO30 2BW |
| Godric Road | PO30 2FR PO30 2FP |
| Green Street | PO30 2AN |
| Greenways | PO30 2BG |
| Grove Close | PO30 2AY |
| Highfield Road | PO30 2HR |
| Home Mead | PO30 2AR |
| John Street | PO30 2AL |
| Langton Walk | PO30 2FS |
| Lavender Way | PO30 2FF |
| Lepen Path | PO30 2FW |
| Long Lane | PO30 2NQ PO30 2NW |
| Mallard Way | PO30 2HG |
| Manor Crescent | PO30 2BH PO30 2BJ PO30 2BL |
| Mckeown Close | PO30 2GQ |
| Meadowside | PO30 2BQ |
| Medina Avenue | PO30 1HF PO30 1DX PO30 1HQ |
| Merrick Close | PO30 2FT |
| Milne Way | PO30 1YF |
| Pan Close | PO30 2AE |
| Pan Lane | PO30 2AS PO30 2BP PO30 2PH |
| Pennycress Drive | PO30 2GF |
| Powell Close | PO30 2NX |
| Red Fox Approach | PO30 2GW |
| Red Fox Square | PO30 2HF |
| Robin Hood Street | PO30 2AJ PO30 2AW PO30 2DZ |
| Royal Exchange | PO30 2HN PO30 2HW |
| Saxon Close | PO30 2FX |
| School Lane | PO30 2HP PO30 2HS |
| Shide Path | PO30 1HJ |
| Shide Road | PO30 1HS PO30 1YE PO30 1YJ PO30 1YQ PO30 1HL PO30 1HR PO30 1YL |
| Squirrel Close | PO30 2GY |
| St Georges Lane | PO30 3BA |
| St Georges Way | PO30 2QH |
| Staplers Court | PO30 2DD PO30 2HT |
| Staplers Road | PO30 2BZ PO30 2DE PO30 2DQ PO30 2DT PO30 2GD PO30 2HZ |
| Swan Street | PO30 2FA |
| Sydney Close | PO30 1YG |
| Tinkers Hill | PO30 2AZ |
| Towngate Place | PO30 2FZ |
| Trattles Court | PO30 2GP |
| Wallace Court | PO30 2DF |
| Watergate Road | PO30 1XW |
| Wellesley Way | PO30 2GA PO30 2GB |
| PO30 2AB PO30 2AD PO30 2GE |
Transport near Newport East
-
Smallbrook Junction Station
-
Ryde St.John's Road Station
-
Ryde Esplanade Station
-
Sandown Station
-
Ryde Pier Head Station
-
Lake Station
-
Shanklin Station
-
Brading Station
- FAQ
- Price Paid By Year
- Property Type Price
Frequently asked questions about Newport East
What is the average price for a property for sale in Newport East?
The average price for a property for sale in Newport East is £219,059. This amount is 14% lower than the average price in Newport. There are 1,472 property listings for sale in Newport East.
What streets have the most expensive properties for sale in Newport East?
The streets with the most expensive properties for sale in Newport East are Buckbury Lane at an average of £295,000, Swan Street at an average of £279,083 and Cosham Close at an average of £274,000.
What streets have the most affordable properties for sale in Newport East?
The streets with the most affordable properties for sale in Newport East are Highfield Road at an average of £143,625, Robin Hood Street at an average of £145,111 and Berry Close at an average of £161,250.
Which train stations are available in or near Newport East?
Some of the train stations available in or near Newport East are Smallbrook Junction, Ryde St.John's Road and Ryde Esplanade.
Property Price Paid in Newport East by Year
The average sold property price by year was:
| Year | Average Sold Price | Price Change |
Sold Properties
|
|---|---|---|---|
| 2025 | £225,543 | 10% |
39 Properties |
| 2024 | £203,692 | -11% |
57 Properties |
| 2023 | £225,570 | 3% |
91 Properties |
| 2022 | £219,295 | 5% |
130 Properties |
| 2021 | £208,718 | 10% |
111 Properties |
| 2020 | £187,802 | -2% |
100 Properties |
| 2019 | £192,420 | 1% |
113 Properties |
| 2018 | £190,455 | 18% |
67 Properties |
| 2017 | £155,877 | -12% |
88 Properties |
| 2016 | £175,074 | 3% |
74 Properties |
| 2015 | £170,571 | -0,2% |
86 Properties |
| 2014 | £170,985 | 14% |
61 Properties |
| 2013 | £147,655 | -2% |
69 Properties |
| 2012 | £150,123 | -7% |
59 Properties |
| 2011 | £161,215 | 9% |
30 Properties |
| 2010 | £145,900 | -7% |
26 Properties |
| 2009 | £155,416 | -3% |
24 Properties |
| 2008 | £159,654 | 10% |
34 Properties |
| 2007 | £143,110 | -6% |
51 Properties |
| 2006 | £151,546 | 12% |
57 Properties |
| 2005 | £132,993 | -6% |
46 Properties |
| 2004 | £140,888 | 24% |
51 Properties |
| 2003 | £106,967 | 11% |
59 Properties |
| 2002 | £94,686 | 16% |
68 Properties |
| 2001 | £79,219 | 15% |
54 Properties |
| 2000 | £67,618 | 21% |
58 Properties |
| 1999 | £53,642 | 9% |
56 Properties |
| 1998 | £48,664 | 7% |
47 Properties |
| 1997 | £45,031 | 2% |
71 Properties |
| 1996 | £44,052 | 3% |
43 Properties |
| 1995 | £42,657 | - |
33 Properties |
Property Price per Property Type in Newport East
Here you can find historic sold price data in order to help with your property search.
The average Property Paid Price for specific property types in the last three years are:
| Property Type | Average Sold Price | Sold Properties |
|---|---|---|
| Semi Detached House | £228,986.00 | 149 Semi Detached Houses |
| Detached House | £304,574.00 | 38 Detached Houses |
| Terraced House | £199,846.00 | 100 Terraced Houses |
| Flat | £125,483.00 | 30 Flats |

