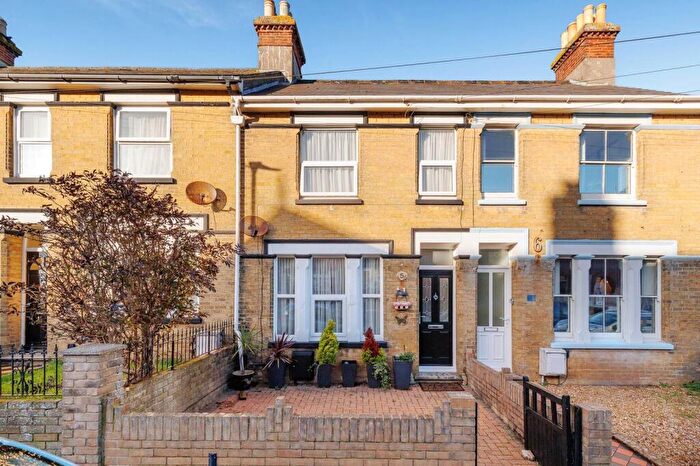
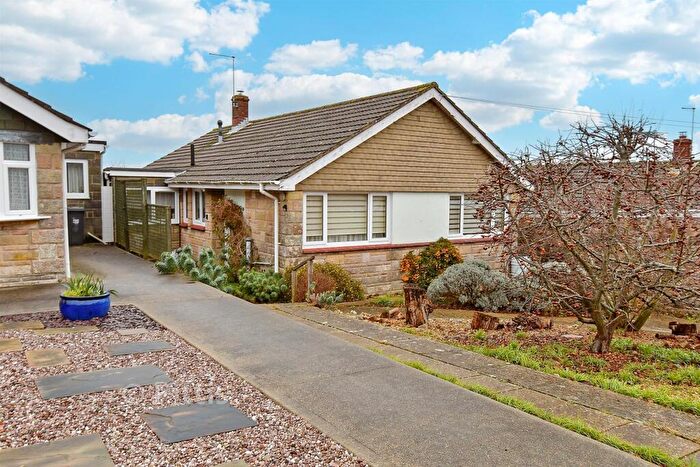
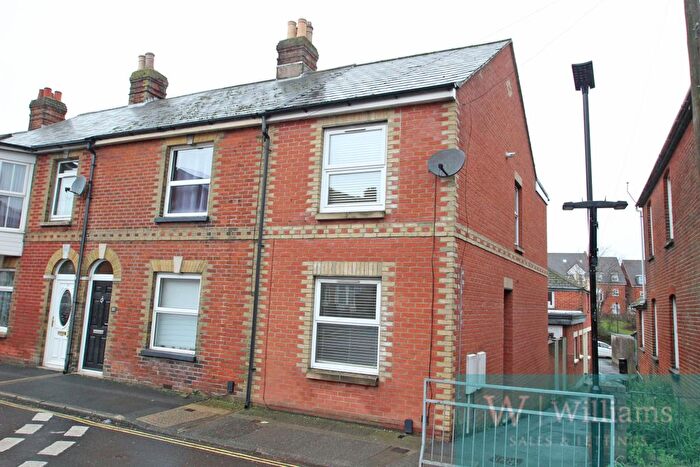
Houses for sale & to rent in Newport South, Newport
House Prices in Newport South
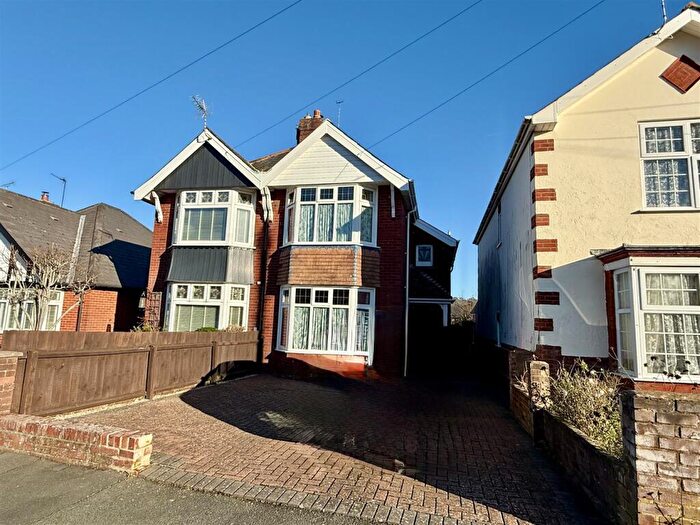
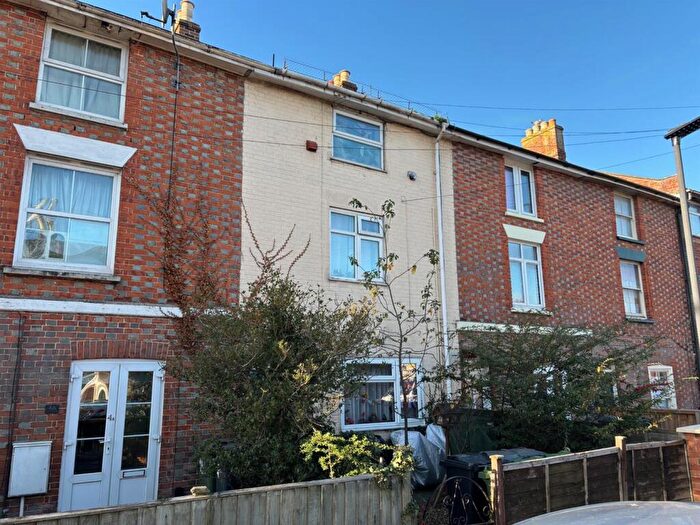
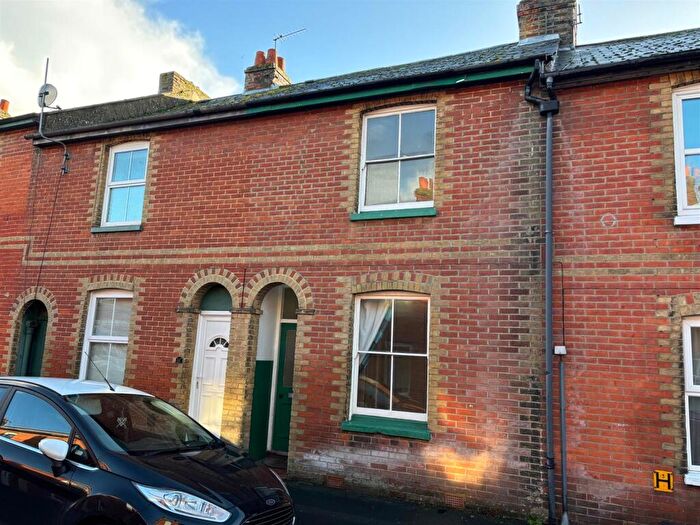
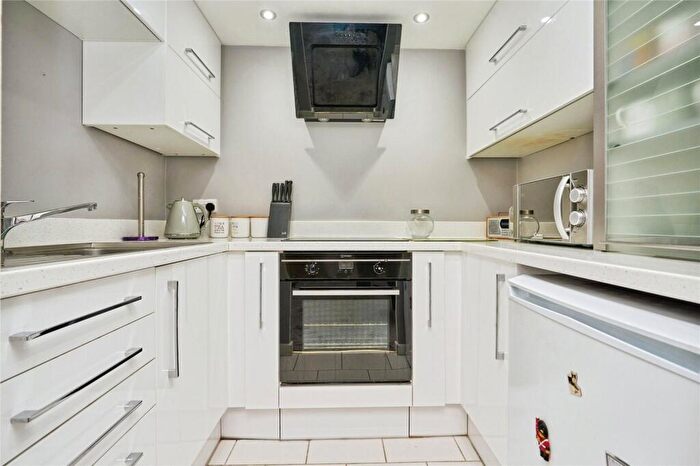
Properties in Newport South have an average house price of £265,409.00 and had 219 Property Transactions within the last 3 years¹.
Newport South is an area in Newport, Isle of Wight with 1,570 households², where the most expensive property was sold for £875,000.00.
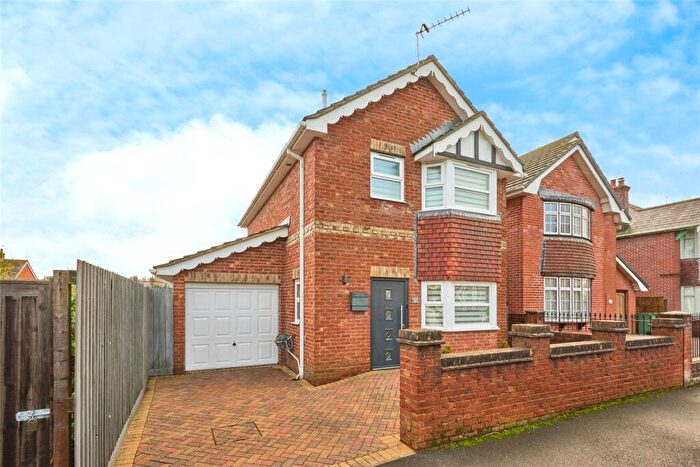
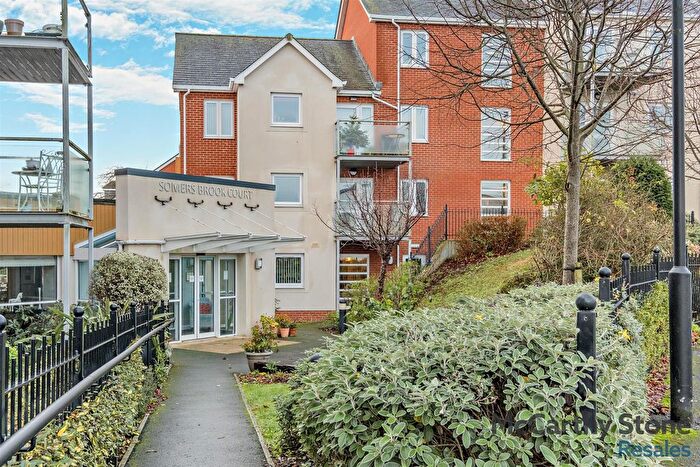
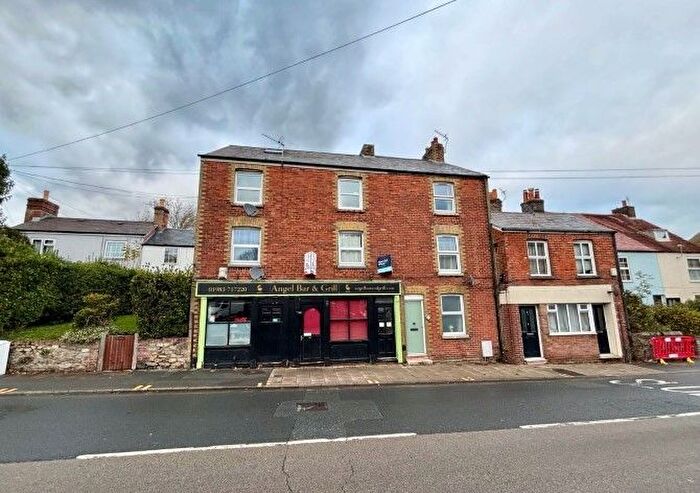
Properties for sale in Newport South
Roads and Postcodes in Newport South
Navigate through our locations to find the location of your next house in Newport South, Newport for sale or to rent.
| Streets | Postcodes |
|---|---|
| Albert Street | PO30 1EF |
| Avondale Road | PO30 1ET PO30 1HE |
| Bignor Place | PO30 1PL |
| Canberra Terrace | PO30 1RA |
| Carisbrooke Road | PO30 1DU PO30 1HP |
| Castle Road | PO30 1DP PO30 1DS PO30 1DT |
| Chandler Close | PO30 1RH |
| Chatfield Lodge | PO30 1XR |
| Clarence Road | PO30 1ER PO30 1EW |
| Clarendon Place | PO30 1RB |
| Clarendon Street | PO30 1QZ |
| College Road | PO30 1HB |
| Collingwood Road | PO30 1QS |
| Cypress Road | PO30 1EX PO30 1EY PO30 1HA |
| Drake Road | PO30 1EQ |
| East View | PO30 1QR |
| Elm Grove | PO30 1RN PO30 1RW |
| Heath Close | PO30 1HN PO30 1HW |
| Keats Vale | PO30 3FH |
| Laburnam Close | PO30 1YH |
| Linden Road | PO30 1RJ PO30 1RL PO30 1RQ |
| Marvel Lane | PO30 3DS PO30 3DT |
| Meadow Green | PO30 1XS |
| Medina Avenue | PO30 1EN PO30 1HG PO30 1HH |
| Melbourne Street | PO30 1QX PO30 1QY |
| Melrose Close | PO30 1AW |
| Mount Joy | PO30 1NB |
| Mount Pleasant Road | PO30 1ES PO30 1EU PO30 1HT |
| Nelson Road | PO30 1QT PO30 1RE PO30 1RD |
| Nunnery Lane | PO30 1YR |
| Queens Road | PO30 1EZ |
| Sandy Lane | PO30 3EA PO30 3NA |
| South View | PO30 1QP |
| St Johns Close | PO30 1LU |
| St Johns Place | PO30 1LH |
| St Johns Road | PO30 1LP PO30 1LY PO30 1LN PO30 1LS PO30 1LW |
| St Nicholas Close | PO30 1NA |
| Terrace Road | PO30 1EE |
| Trafalgar Road | PO30 1QD PO30 1QE PO30 1QF PO30 1QG PO30 1QU PO30 1RT |
| Watergate Road | PO30 1XN PO30 1XP PO30 1YP |
| West View | PO30 1QW |
| Whitcombe Road | PO30 1DW PO30 1YS PO30 1EB PO30 3DX |
| Whitecroft Park | PO30 3BY PO30 3DW PO30 3FA PO30 3FB PO30 3FE PO30 3FF |
| Whitepit Lane | PO30 1LX PO30 1ND PO30 1NE PO30 1NF PO30 1NH PO30 1NJ |
| Winchester Close | PO30 1DR |
| Winston Road | PO30 1RF PO30 1RG |
| Woodbine Close | PO30 1AF PO30 1AH PO30 1AE PO30 1AN |
| Wykeham Road | PO30 1HD |
Transport near Newport South
-
Sandown Station
-
Smallbrook Junction Station
-
Shanklin Station
-
Lake Station
-
Ryde St.John's Road Station
-
Ryde Esplanade Station
-
Ryde Pier Head Station
-
Brading Station
- FAQ
- Price Paid By Year
- Property Type Price
Frequently asked questions about Newport South
What is the average price for a property for sale in Newport South?
The average price for a property for sale in Newport South is £265,409. This amount is 4% higher than the average price in Newport. There are 1,842 property listings for sale in Newport South.
What streets have the most expensive properties for sale in Newport South?
The streets with the most expensive properties for sale in Newport South are Nunnery Lane at an average of £735,000, Watergate Road at an average of £506,875 and Queens Road at an average of £405,000.
What streets have the most affordable properties for sale in Newport South?
The streets with the most affordable properties for sale in Newport South are Carisbrooke Road at an average of £56,000, Chandler Close at an average of £123,150 and Clarendon Street at an average of £134,642.
Which train stations are available in or near Newport South?
Some of the train stations available in or near Newport South are Sandown, Smallbrook Junction and Shanklin.
Property Price Paid in Newport South by Year
The average sold property price by year was:
| Year | Average Sold Price | Price Change |
Sold Properties
|
|---|---|---|---|
| 2025 | £281,058 | 6% |
47 Properties |
| 2024 | £262,904 | 4% |
55 Properties |
| 2023 | £253,387 | -5% |
54 Properties |
| 2022 | £266,225 | 4% |
63 Properties |
| 2021 | £255,291 | 8% |
88 Properties |
| 2020 | £234,250 | 4% |
58 Properties |
| 2019 | £225,505 | 20% |
73 Properties |
| 2018 | £180,623 | -24% |
43 Properties |
| 2017 | £224,275 | 4% |
71 Properties |
| 2016 | £215,131 | 8% |
87 Properties |
| 2015 | £197,295 | 7% |
80 Properties |
| 2014 | £183,449 | -3% |
75 Properties |
| 2013 | £189,529 | 6% |
54 Properties |
| 2012 | £178,187 | -6% |
40 Properties |
| 2011 | £188,505 | -1% |
37 Properties |
| 2010 | £190,581 | 6% |
30 Properties |
| 2009 | £178,218 | -6% |
41 Properties |
| 2008 | £188,631 | 1% |
47 Properties |
| 2007 | £187,011 | 3% |
77 Properties |
| 2006 | £181,249 | 5% |
80 Properties |
| 2005 | £172,220 | 11% |
68 Properties |
| 2004 | £153,599 | 11% |
102 Properties |
| 2003 | £136,622 | 15% |
78 Properties |
| 2002 | £115,718 | 16% |
83 Properties |
| 2001 | £96,832 | 21% |
98 Properties |
| 2000 | £76,508 | 12% |
61 Properties |
| 1999 | £67,186 | 15% |
79 Properties |
| 1998 | £56,831 | 2% |
72 Properties |
| 1997 | £55,614 | 7% |
80 Properties |
| 1996 | £51,846 | -0,4% |
67 Properties |
| 1995 | £52,035 | - |
54 Properties |
Property Price per Property Type in Newport South
Here you can find historic sold price data in order to help with your property search.
The average Property Paid Price for specific property types in the last three years are:
| Property Type | Average Sold Price | Sold Properties |
|---|---|---|
| Semi Detached House | £265,807.00 | 59 Semi Detached Houses |
| Detached House | £417,505.00 | 49 Detached Houses |
| Terraced House | £205,504.00 | 68 Terraced Houses |
| Flat | £186,277.00 | 43 Flats |

