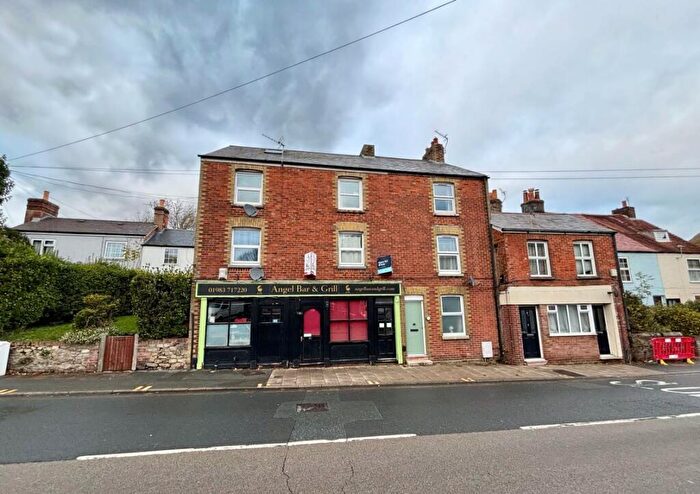
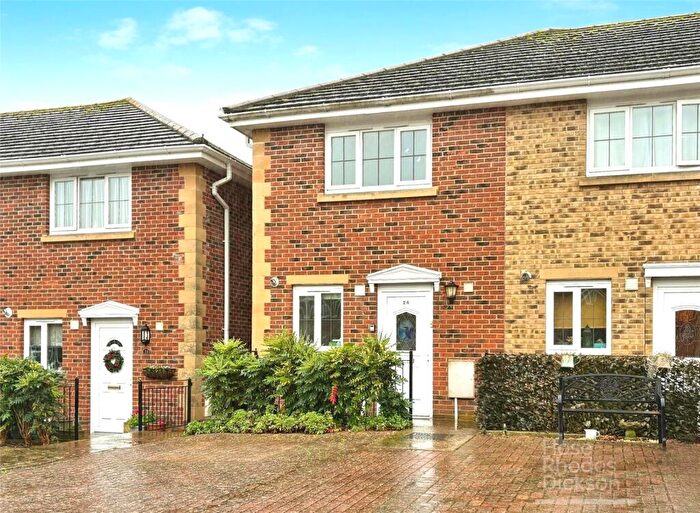
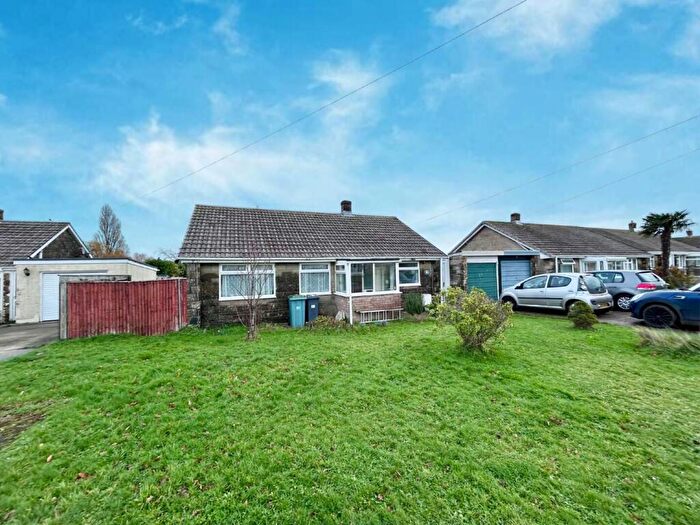
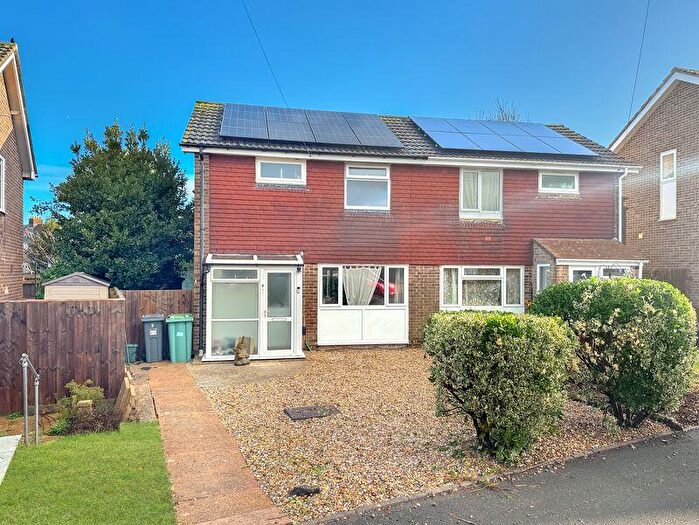
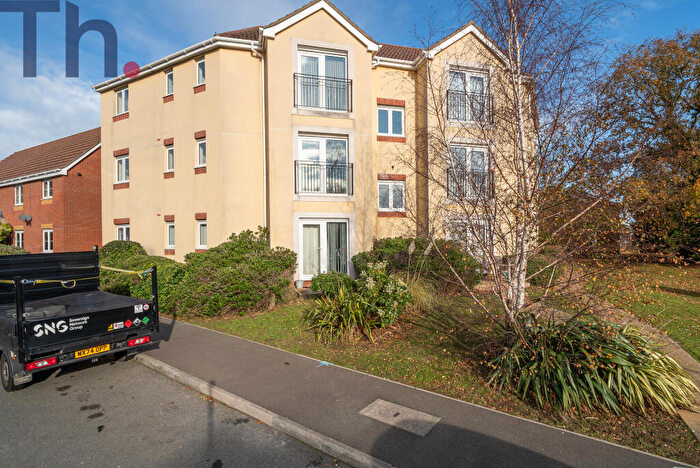
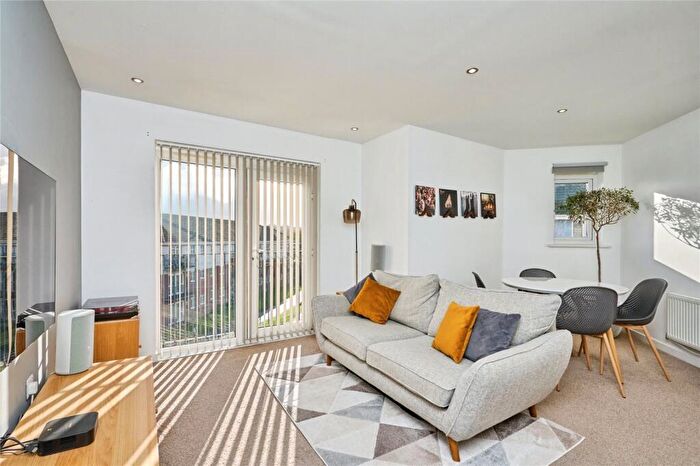
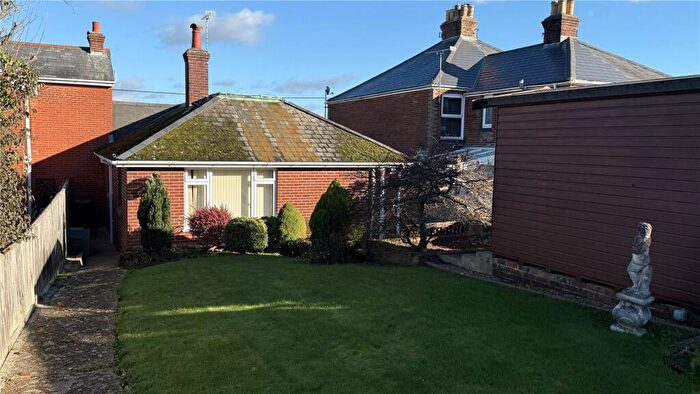
Houses for sale & to rent in Newport West, Newport
House Prices in Newport West
Properties in Newport West have an average house price of £253,710.00 and had 209 Property Transactions within the last 3 years¹.
Newport West is an area in Newport, Isle of Wight with 1,272 households², where the most expensive property was sold for £700,000.00.
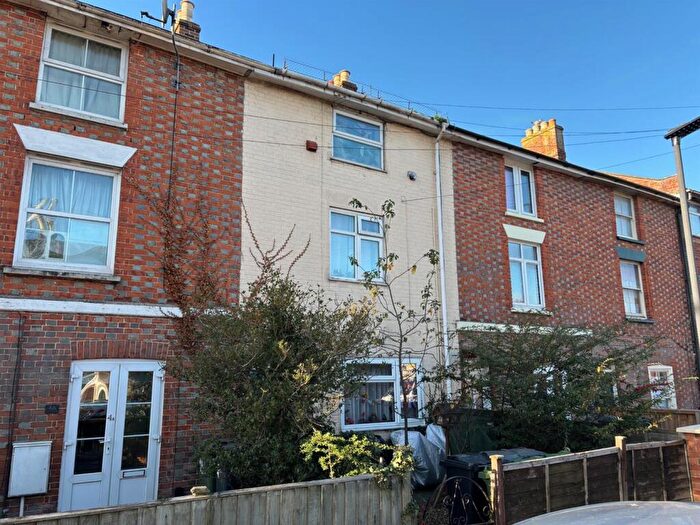
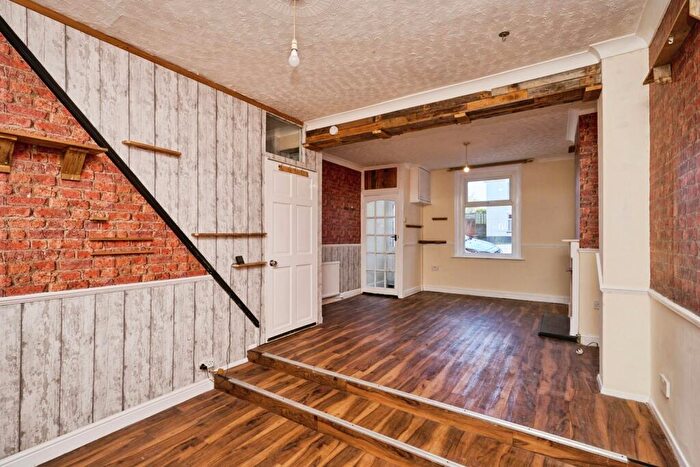
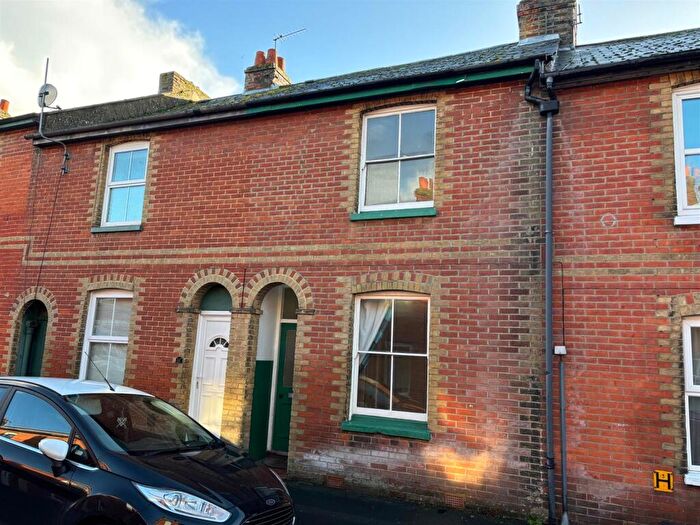
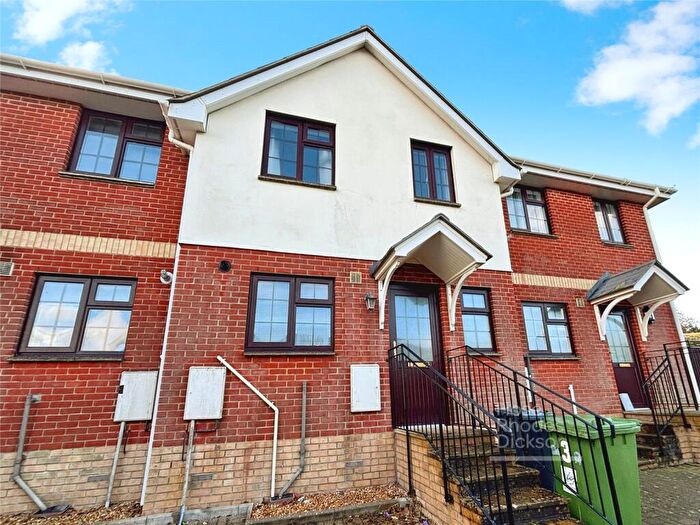
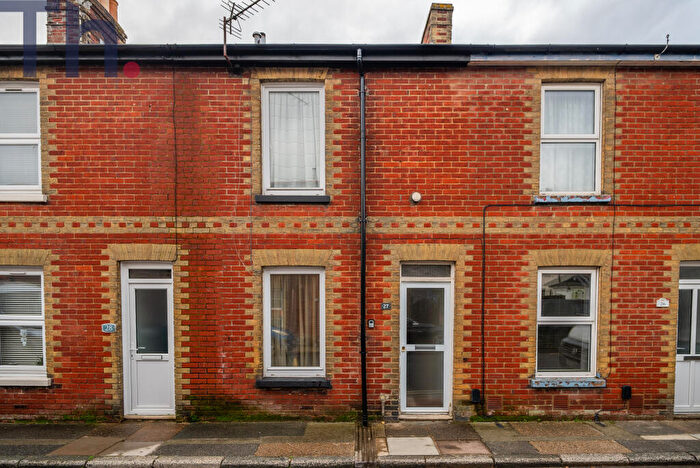
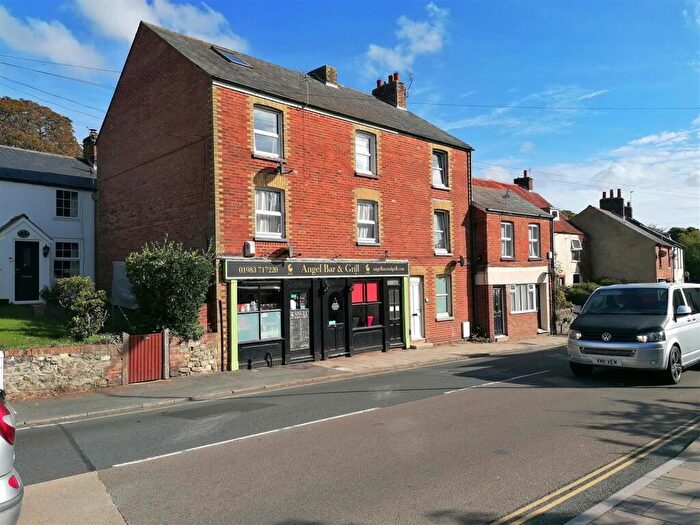
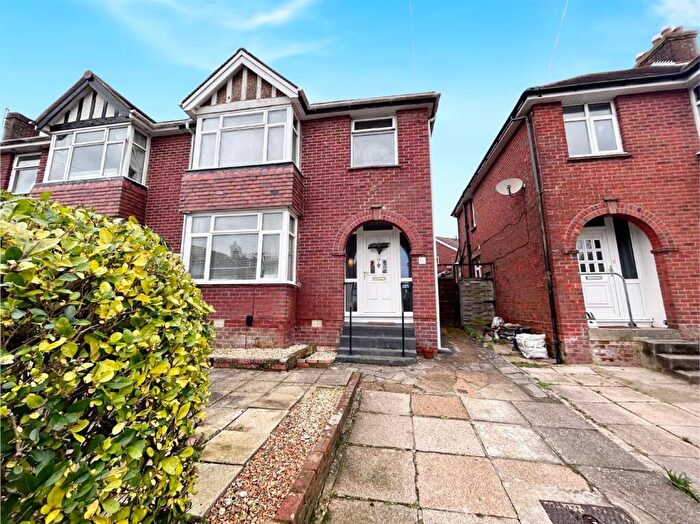
Properties for sale in Newport West
Roads and Postcodes in Newport West
Navigate through our locations to find the location of your next house in Newport West, Newport for sale or to rent.
| Streets | Postcodes |
|---|---|
| Acacia Close | PO30 5FQ |
| Alderbury Road | PO30 5DR |
| Bowdens Mead Close | PO30 5GZ |
| Brickfield Close | PO30 5GF |
| Brooke Road | PO30 5DU |
| Caesars Road | PO30 5EA |
| Carisbrooke Road | PO30 1DB |
| Charnwood Close | PO30 5ZQ |
| Dairy Crest Drive | PO30 5GG |
| Fieldfare Road | PO30 5FH PO30 5GP PO30 5GS PO30 5YB PO30 5YD |
| Foxes Road | PO30 5UN |
| Goldcrest Close | PO30 5FX |
| Hazel Close | PO30 5FG PO30 5GD |
| Hinton Road | PO30 5QZ PO30 5RA PO30 5RD PO30 5RP |
| Juniper Close | PO30 5EW |
| Kestrel Way | PO30 5GR |
| Kinchington Road | PO30 5ST |
| Kingfisher Close | PO30 5XS |
| Kitbridge Road | PO30 5RF |
| Lark Rise | PO30 5YJ |
| Linnet Close | PO30 5GT |
| Machin Close | PO30 5SQ |
| Marlborough Road | PO30 5RQ |
| Millfield Road | PO30 5RH |
| Mountbatten Drive | PO30 5RL PO30 5SG PO30 5SJ PO30 5QU PO30 5QX |
| Mulberry Close | PO30 5EY |
| Nightingale Road | PO30 5GB |
| Priors Walk | PO30 5RN PO30 5RW |
| Purdy Road | PO30 5SU PO30 5SX |
| Recreation Ground Road | PO30 5AH |
| Redstart Close | PO30 5SZ |
| Redwing Close | PO30 5SW |
| Redwood Close | PO30 5RT |
| Silver Birch Drive | PO30 5AG |
| Snowberry Road | PO30 5EZ PO30 5GN PO30 5QQ |
| Spindleberry Close | PO30 5FN |
| St Augustines Road | PO30 5EX |
| Stonechat Close | PO30 5SN |
| Sunningdale Road | PO30 5DS |
| Swallow Close | PO30 5SY |
| Sylvan Drive | PO30 5EG PO30 5EQ |
| Tayberry Close | PO30 5BT |
| Taylor Road | PO30 5LG |
| The Finches | PO30 5GU |
| Ward Close | PO30 5SL |
| Wellington Road | PO30 5PX PO30 5QT PO30 5QY |
| Westmill Road | PO30 5RE PO30 5RG PO30 5RR |
| Westminster Lane | PO30 5DP PO30 5ZF PO30 5ZG PO30 5ZH PO30 5BH PO30 5ZE |
| Wheatear Close | PO30 5XR |
| Wilver Road | PO30 5DT PO30 5DX |
| Winchat Close | PO30 5XP |
| Withybed Close | PO30 5RJ |
| Wolfe Close | PO30 5RB |
Transport near Newport West
-
Smallbrook Junction Station
-
Ryde St.John's Road Station
-
Ryde Esplanade Station
-
Sandown Station
-
Ryde Pier Head Station
-
Shanklin Station
-
Lake Station
-
Brading Station
- FAQ
- Price Paid By Year
- Property Type Price
Frequently asked questions about Newport West
What is the average price for a property for sale in Newport West?
The average price for a property for sale in Newport West is £253,710. This amount is 0.45% lower than the average price in Newport. There are 1,664 property listings for sale in Newport West.
What streets have the most expensive properties for sale in Newport West?
The streets with the most expensive properties for sale in Newport West are Carisbrooke Road at an average of £436,666, Sunningdale Road at an average of £421,231 and Redwood Close at an average of £420,000.
What streets have the most affordable properties for sale in Newport West?
The streets with the most affordable properties for sale in Newport West are Foxes Road at an average of £112,750, Snowberry Road at an average of £177,322 and Caesars Road at an average of £199,428.
Which train stations are available in or near Newport West?
Some of the train stations available in or near Newport West are Smallbrook Junction, Ryde St.John's Road and Ryde Esplanade.
Property Price Paid in Newport West by Year
The average sold property price by year was:
| Year | Average Sold Price | Price Change |
Sold Properties
|
|---|---|---|---|
| 2025 | £256,130 | 1% |
38 Properties |
| 2024 | £253,836 | 8% |
55 Properties |
| 2023 | £234,398 | -16% |
59 Properties |
| 2022 | £271,964 | 7% |
57 Properties |
| 2021 | £252,300 | 9% |
80 Properties |
| 2020 | £229,647 | 6% |
71 Properties |
| 2019 | £214,886 | 5% |
62 Properties |
| 2018 | £204,602 | -4% |
72 Properties |
| 2017 | £213,434 | 11% |
97 Properties |
| 2016 | £188,896 | -3% |
99 Properties |
| 2015 | £195,110 | -6% |
74 Properties |
| 2014 | £205,889 | 13% |
91 Properties |
| 2013 | £179,243 | 2% |
90 Properties |
| 2012 | £175,133 | 3% |
45 Properties |
| 2011 | £170,217 | -5% |
56 Properties |
| 2010 | £178,785 | 3% |
64 Properties |
| 2009 | £173,778 | -4% |
61 Properties |
| 2008 | £180,646 | -3% |
82 Properties |
| 2007 | £186,591 | -1% |
82 Properties |
| 2006 | £189,322 | - |
103 Properties |
| 2005 | £189,391 | 9% |
98 Properties |
| 2004 | £172,899 | 10% |
112 Properties |
| 2003 | £156,241 | 13% |
98 Properties |
| 2002 | £135,790 | 23% |
94 Properties |
| 2001 | £105,151 | 20% |
96 Properties |
| 2000 | £83,614 | 10% |
69 Properties |
| 1999 | £75,298 | 15% |
58 Properties |
| 1998 | £63,926 | 11% |
68 Properties |
| 1997 | £56,738 | 5% |
59 Properties |
| 1996 | £54,181 | 6% |
49 Properties |
| 1995 | £50,922 | - |
48 Properties |
Property Price per Property Type in Newport West
Here you can find historic sold price data in order to help with your property search.
The average Property Paid Price for specific property types in the last three years are:
| Property Type | Average Sold Price | Sold Properties |
|---|---|---|
| Semi Detached House | £278,586.00 | 52 Semi Detached Houses |
| Detached House | £336,607.00 | 55 Detached Houses |
| Terraced House | £244,270.00 | 61 Terraced Houses |
| Flat | £125,000.00 | 41 Flats |

