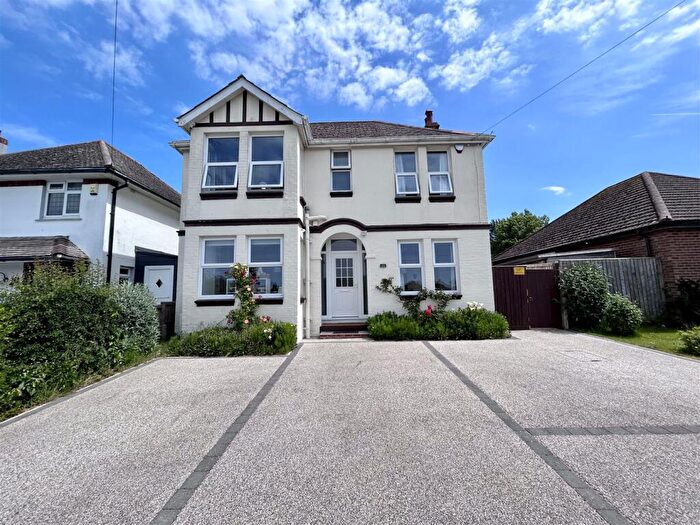
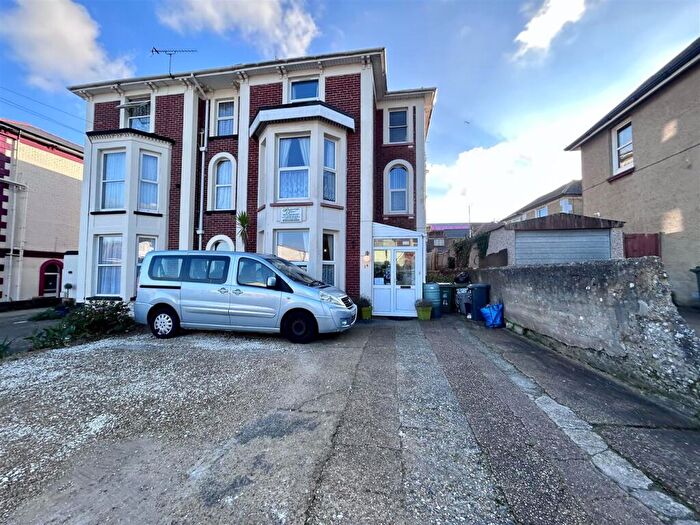
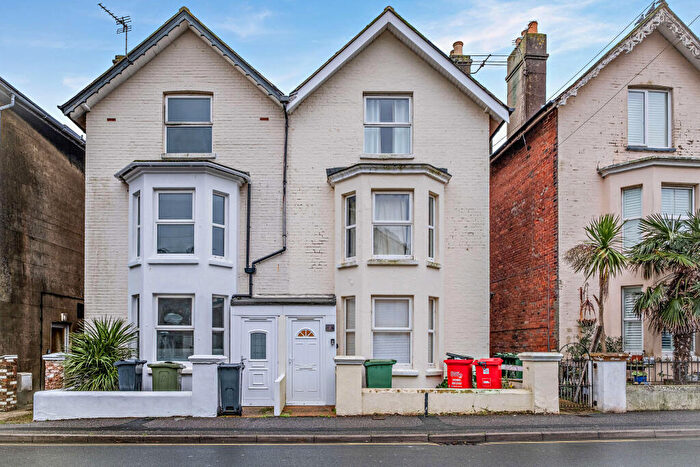
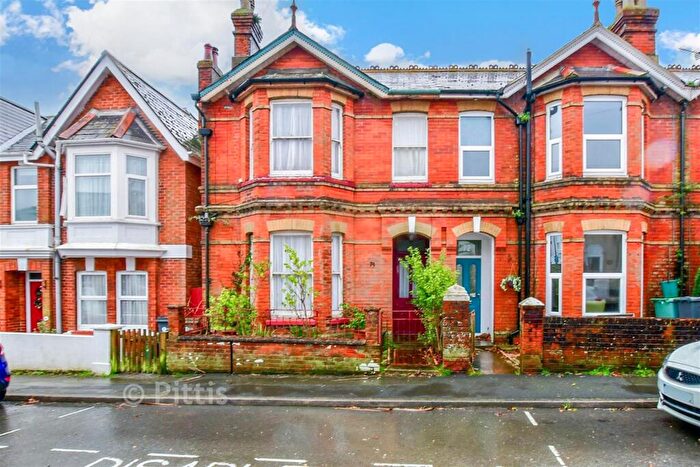
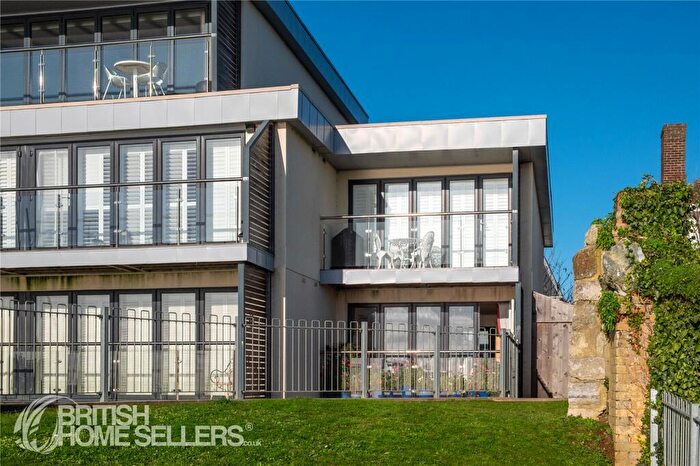
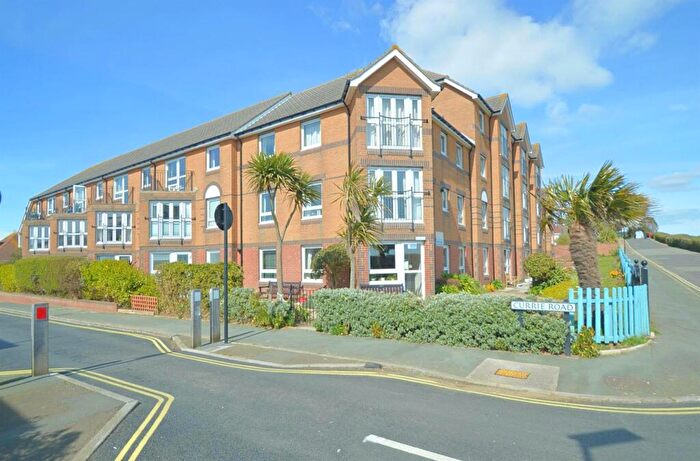
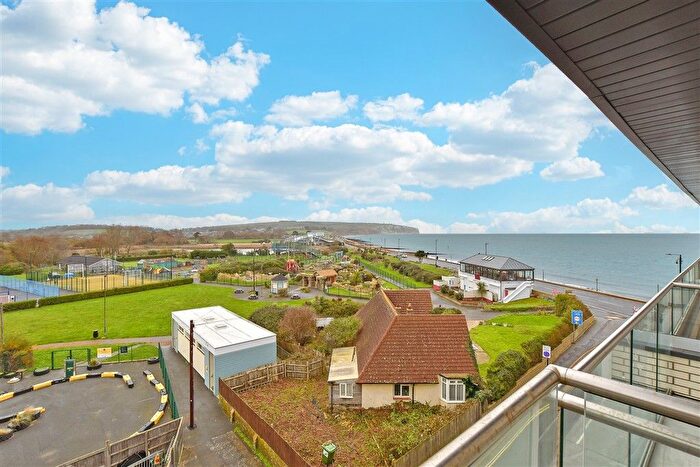
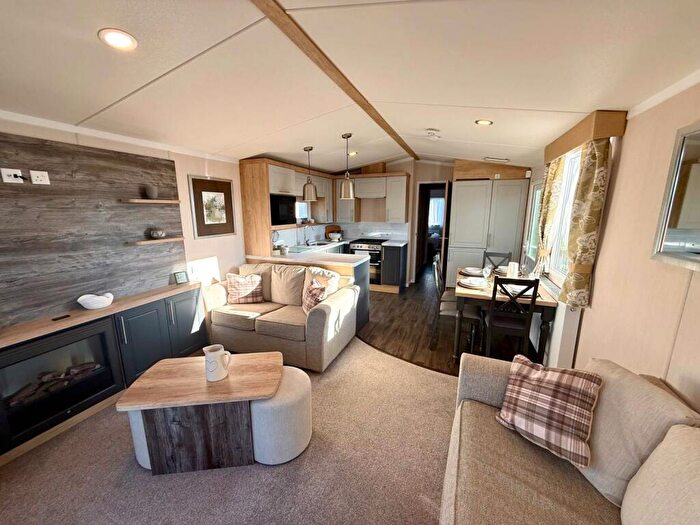
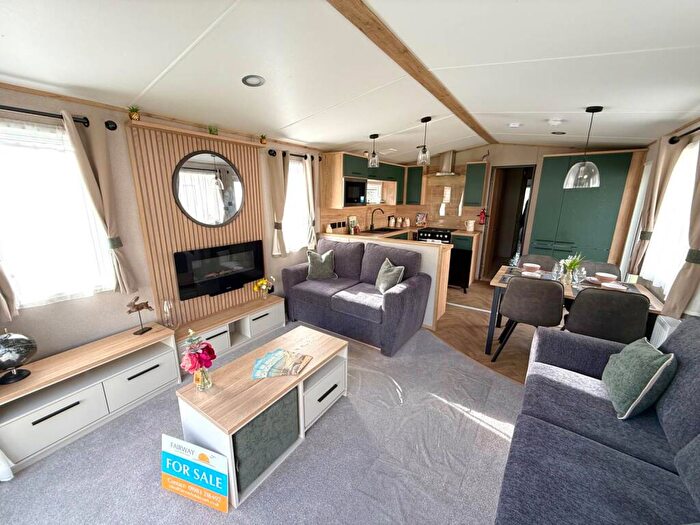
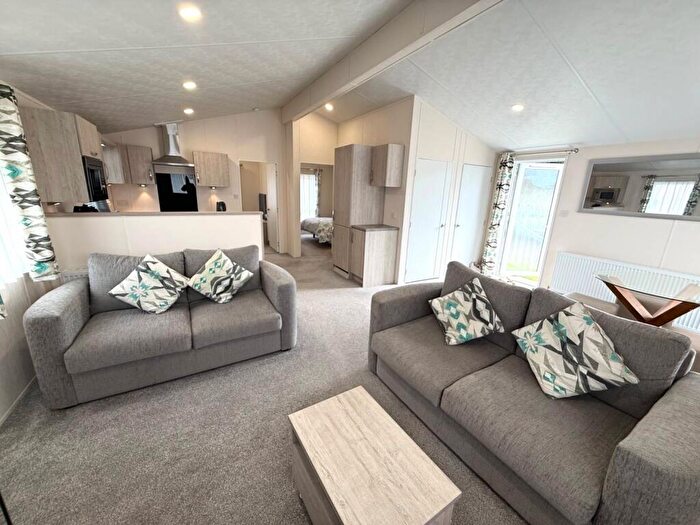
Houses for sale & to rent in Sandown South, Sandown
House Prices in Sandown South
Properties in Sandown South have an average house price of £233,166.00 and had 229 Property Transactions within the last 3 years¹.
Sandown South is an area in Sandown, Isle of Wight with 1,741 households², where the most expensive property was sold for £755,000.00.
Properties for sale in Sandown South
Roads and Postcodes in Sandown South
Navigate through our locations to find the location of your next house in Sandown South, Sandown for sale or to rent.
Transport near Sandown South
- FAQ
- Price Paid By Year
- Property Type Price
Frequently asked questions about Sandown South
What is the average price for a property for sale in Sandown South?
The average price for a property for sale in Sandown South is £233,166. This amount is 16% lower than the average price in Sandown. There are 1,744 property listings for sale in Sandown South.
What streets have the most expensive properties for sale in Sandown South?
The streets with the most expensive properties for sale in Sandown South are Park Rise at an average of £550,000, Old Reservoir Lane at an average of £455,000 and Elmbank Gardens at an average of £422,500.
What streets have the most affordable properties for sale in Sandown South?
The streets with the most affordable properties for sale in Sandown South are Stower Place at an average of £76,000, Royal Street at an average of £128,750 and The Warren at an average of £130,600.
Which train stations are available in or near Sandown South?
Some of the train stations available in or near Sandown South are Sandown, Lake and Shanklin.
Property Price Paid in Sandown South by Year
The average sold property price by year was:
| Year | Average Sold Price | Price Change |
Sold Properties
|
|---|---|---|---|
| 2025 | £234,247 | 2% |
39 Properties |
| 2024 | £230,368 | 3% |
64 Properties |
| 2023 | £224,291 | -7% |
48 Properties |
| 2022 | £240,384 | 8% |
78 Properties |
| 2021 | £221,850 | 10% |
96 Properties |
| 2020 | £200,414 | 3% |
52 Properties |
| 2019 | £194,284 | 11% |
77 Properties |
| 2018 | £172,820 | -8% |
76 Properties |
| 2017 | £187,317 | 13% |
103 Properties |
| 2016 | £162,032 | 1% |
101 Properties |
| 2015 | £159,898 | 8% |
74 Properties |
| 2014 | £147,551 | -18% |
89 Properties |
| 2013 | £173,395 | 21% |
60 Properties |
| 2012 | £136,923 | -6% |
55 Properties |
| 2011 | £145,062 | 11% |
69 Properties |
| 2010 | £129,559 | -17% |
67 Properties |
| 2009 | £151,450 | -11% |
83 Properties |
| 2008 | £168,009 | -5% |
65 Properties |
| 2007 | £176,911 | 11% |
129 Properties |
| 2006 | £157,843 | 13% |
139 Properties |
| 2005 | £137,724 | -9% |
111 Properties |
| 2004 | £150,672 | 17% |
136 Properties |
| 2003 | £125,800 | 19% |
139 Properties |
| 2002 | £102,178 | 15% |
160 Properties |
| 2001 | £86,827 | 11% |
120 Properties |
| 2000 | £76,994 | 16% |
116 Properties |
| 1999 | £64,709 | 11% |
133 Properties |
| 1998 | £57,660 | 17% |
133 Properties |
| 1997 | £47,950 | 6% |
130 Properties |
| 1996 | £45,163 | -1% |
67 Properties |
| 1995 | £45,476 | - |
77 Properties |
Property Price per Property Type in Sandown South
Here you can find historic sold price data in order to help with your property search.
The average Property Paid Price for specific property types in the last three years are:
| Property Type | Average Sold Price | Sold Properties |
|---|---|---|
| Semi Detached House | £259,221.00 | 46 Semi Detached Houses |
| Detached House | £341,602.00 | 38 Detached Houses |
| Terraced House | £225,840.00 | 53 Terraced Houses |
| Flat | £179,571.00 | 92 Flats |

