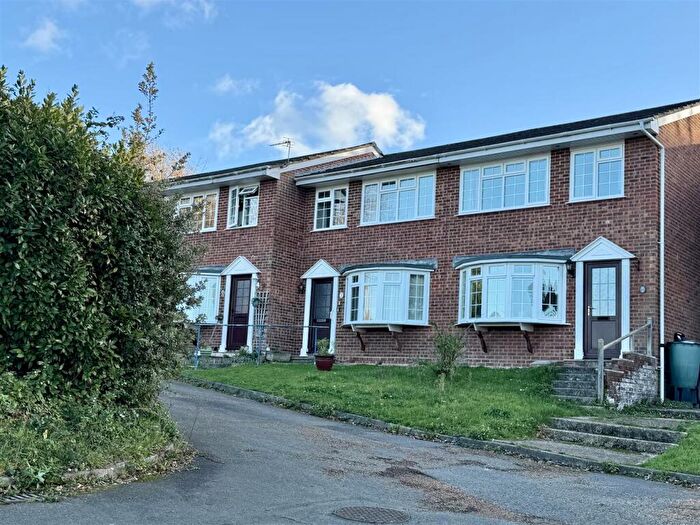
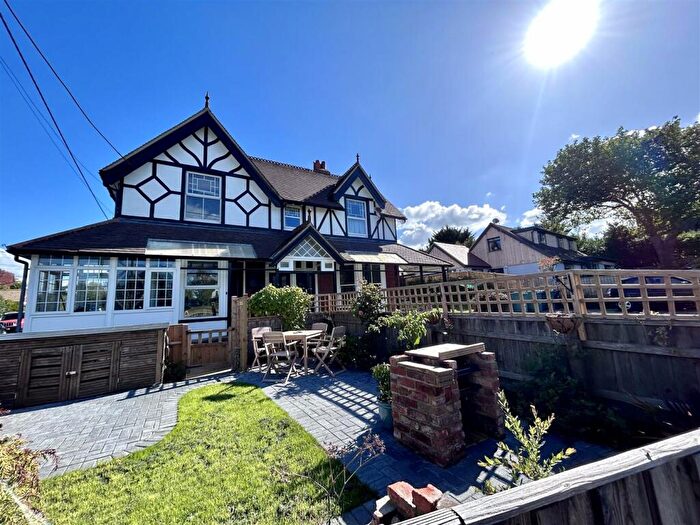
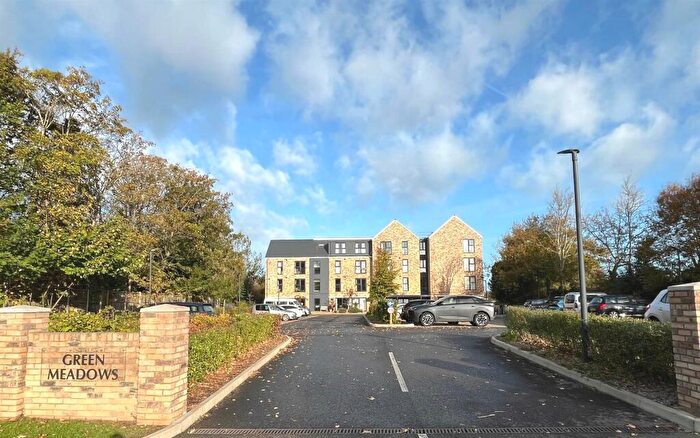
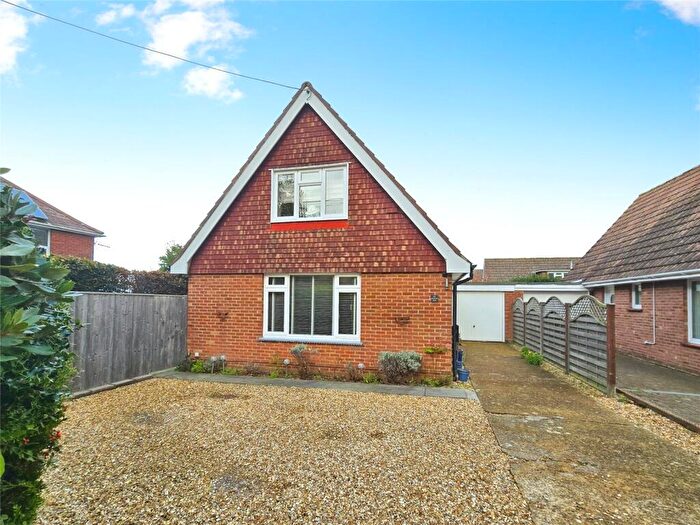
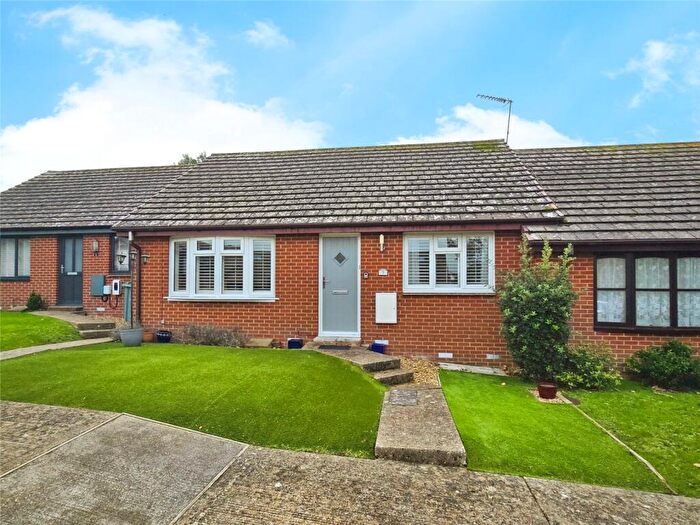
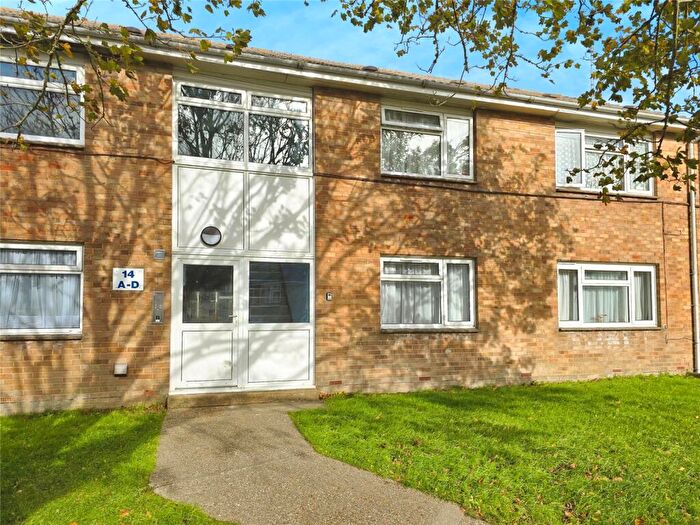
Houses for sale & to rent in Totland, Totland Bay
House Prices in Totland
Properties in Totland have an average house price of £355,632.00 and had 206 Property Transactions within the last 3 years¹.
Totland is an area in Totland Bay, Isle of Wight with 1,108 households², where the most expensive property was sold for £1,048,000.00.
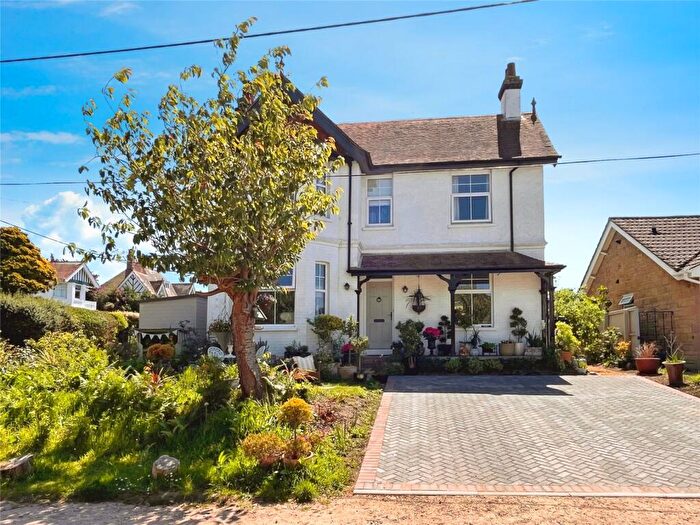
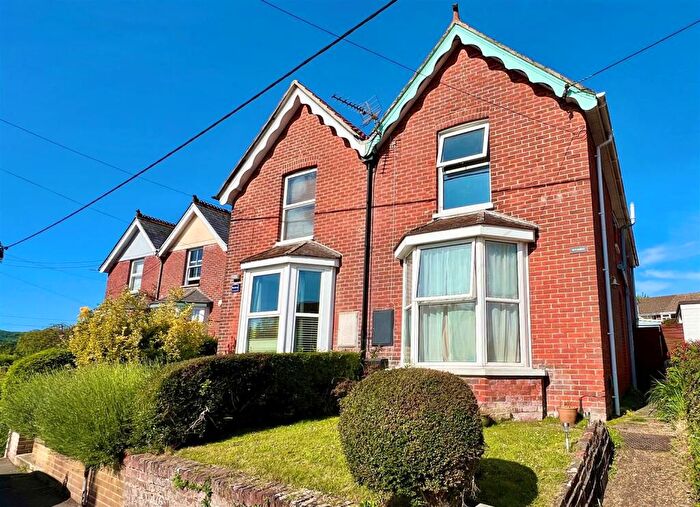
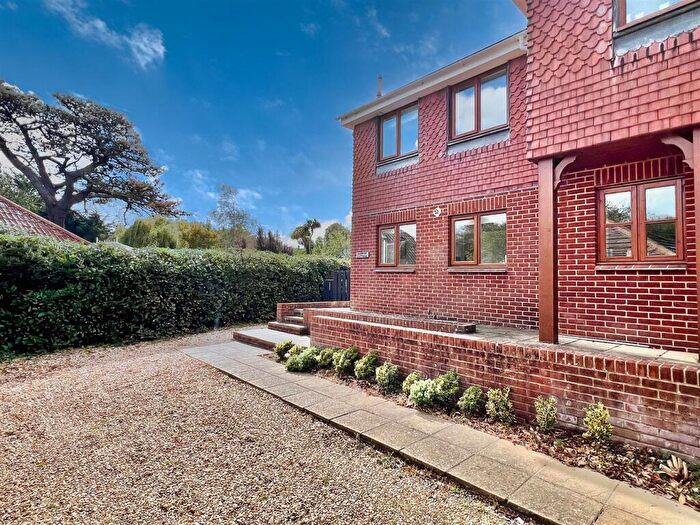
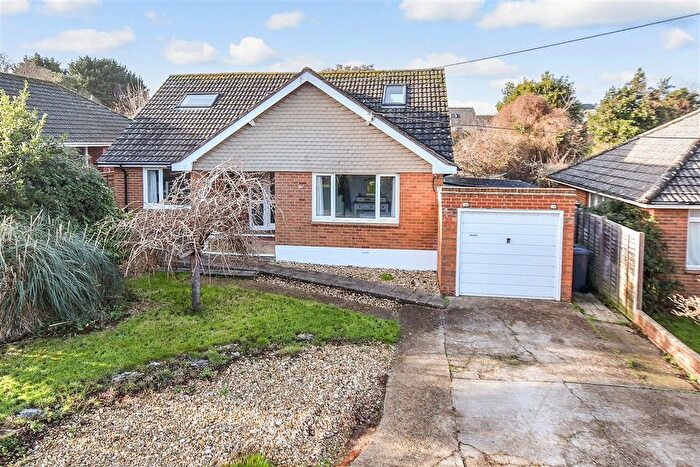
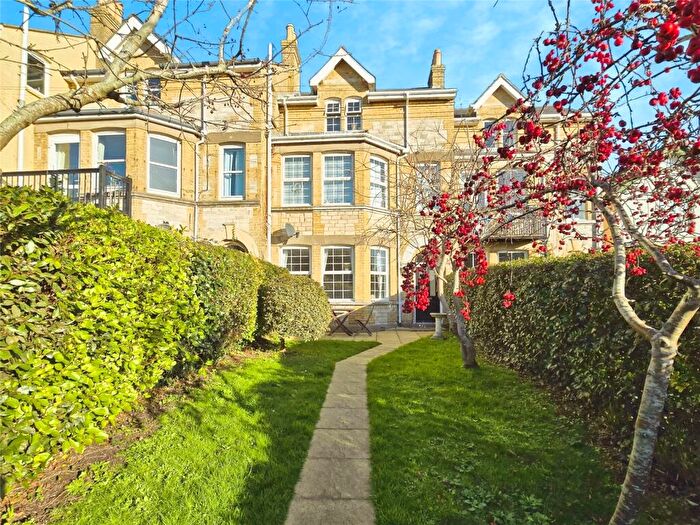
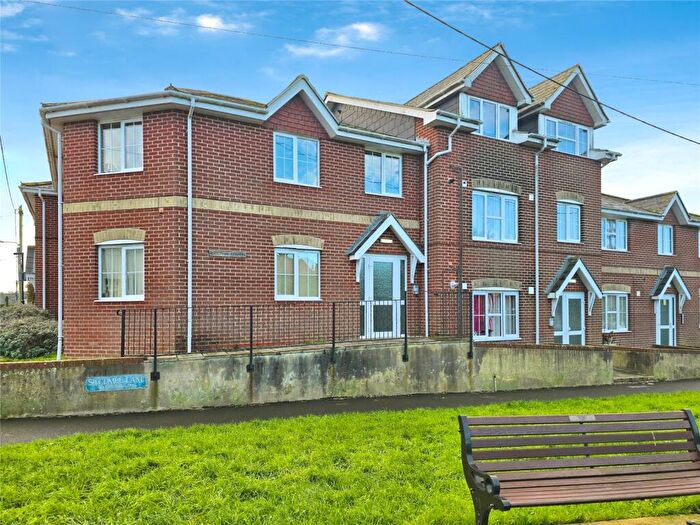
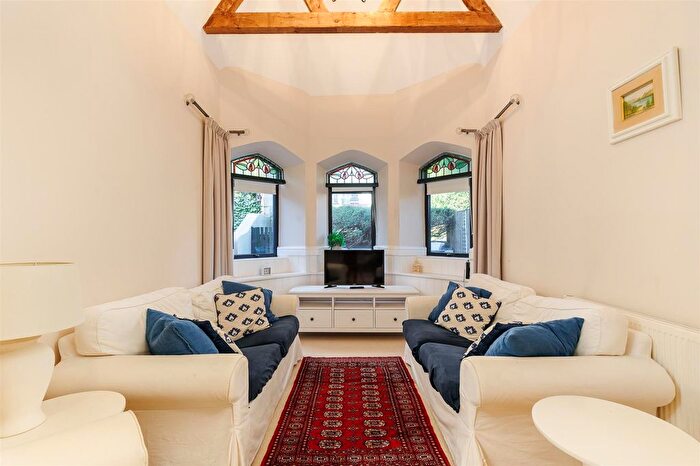
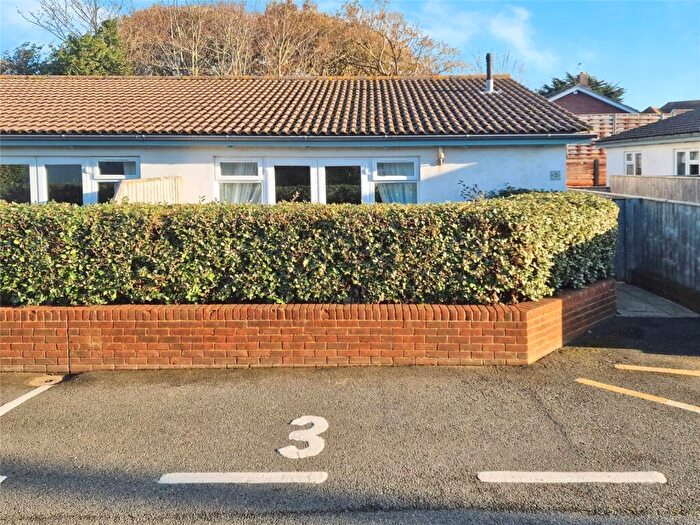
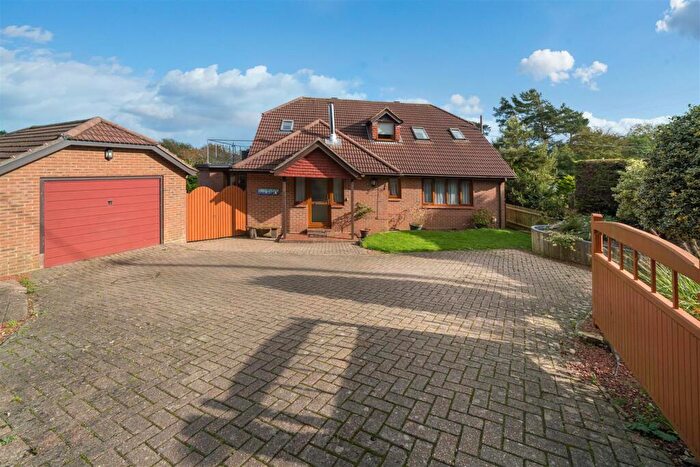
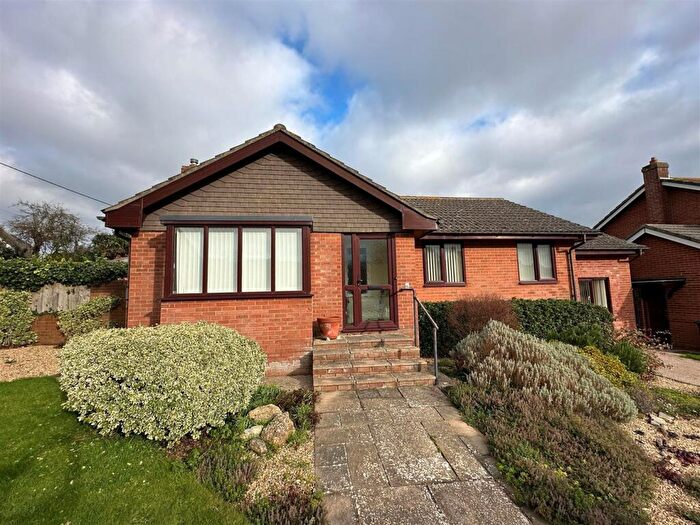
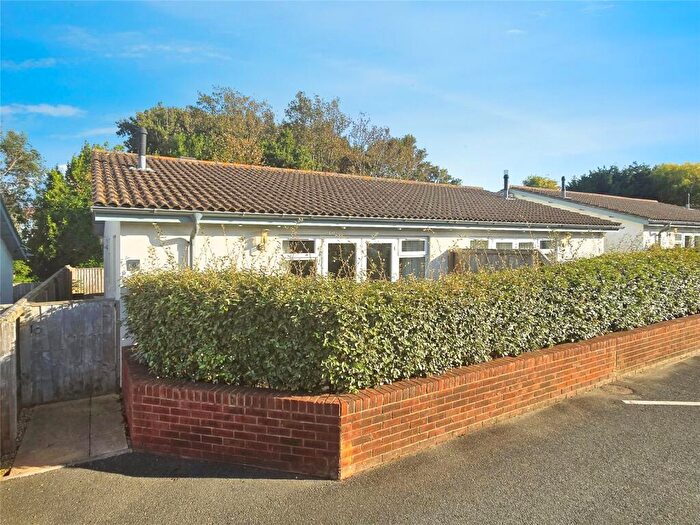
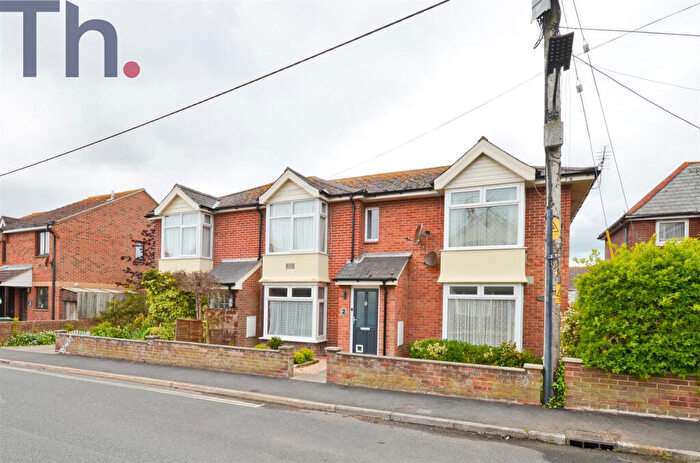
Properties for sale in Totland
Roads and Postcodes in Totland
Navigate through our locations to find the location of your next house in Totland, Totland Bay for sale or to rent.
| Streets | Postcodes |
|---|---|
| Alum Bay | PO39 0JB |
| Alum Bay New Road | PO39 0ES |
| Alum Bay Old Road | PO39 0HZ PO39 0JA |
| Amos Hill | PO39 0DP PO39 0DW |
| Brickfield Lane | PO39 0HN |
| Broadway | PO39 0AN PO39 0AS PO39 0AT PO39 0AU PO39 0BN PO39 0BS PO39 0BT PO39 0BU PO39 0BW |
| Church Hill | PO39 0ET PO39 0EU PO39 0EX |
| Cliff Road | PO39 0EH PO39 0EN PO39 0EW PO39 0BH PO39 0EP |
| Colmar Way | PO39 0EB |
| Colwell Common Road | PO39 0BZ PO39 0DD PO39 0LA |
| Colwell Road | PO39 0AB PO39 0AE PO39 0AH PO39 0BY |
| Conway Lane | PO39 0JJ |
| Cranstoun Close | PO39 0JR |
| Diana Close | PO39 0EE |
| Eden Place | PO39 0HP |
| Eden Road | PO39 0EJ |
| Elliston Road | PO39 0BA |
| Fairfield Park | PO39 0FF |
| Fairfield Way | PO39 0EF |
| Farthings Way | PO39 0LD |
| Fort Warden Road | PO39 0DA |
| Glenheadon Drive | PO39 0HR |
| Granville Rise | PO39 0DX |
| Granville Road | PO39 0AP PO39 0AX PO39 0AY PO39 0AZ PO39 0BG PO39 0FA PO39 0JS |
| Greenways | PO39 0ED |
| Hambrough Lane | PO39 0JX |
| Headon Cottages | PO39 0JD |
| Heatherwood Park Road | PO39 0EL |
| Highdown Lane | PO39 0HY |
| Hurst Hill | PO39 0HD |
| Hurst Point View | PO39 0AG PO39 0AQ PO39 0AW PO39 0FD |
| Ivylands Close | PO39 0FG |
| Jameson Gardens | PO39 0AA |
| Kendal Road | PO39 0BP PO39 0EA |
| Key Haven Court | PO39 0BF |
| Lanes End | PO39 0AL PO39 0BE |
| Madeira Road | PO39 0BJ PO39 0JP |
| Manor Villas | PO39 0BX |
| Meadow Barn Close | PO39 0DF |
| Moons Hill | PO39 0HS PO39 0HF |
| Oak Terrace | PO39 0HX |
| Portland Terrace | PO39 0HT |
| Princes Close | PO39 0AF |
| Roselands | PO39 0DB |
| St Saviours Road | PO39 0EZ |
| Summers Lane | PO39 0HG PO39 0HJ PO39 0HL PO39 0HQ PO39 0HW |
| Swanage Terrace | PO39 0HU |
| The Avenue | PO39 0DH PO39 0DL PO39 0DN PO39 0JT |
| The Beach | PO39 0BQ |
| The Mall | PO39 0DR PO39 0DS |
| The Promenade | PO39 0JU |
| Trevanions Way | PO39 0JL PO39 0LB |
| Uplands Road | PO39 0DT PO39 0DU PO39 0DY PO39 0DZ |
| Velsheda Close | PO39 0AJ |
| Ward Road | PO39 0AR PO39 0BB PO39 0BD PO39 0FB |
| Warden Road | PO39 0AD |
| Westlands | PO39 0DJ |
| Weston Lane | PO39 0HE |
| Weston Road | PO39 0EY PO39 0HA |
| Weston Terrace | PO39 0BL |
| Windmill Lane | PO39 0HH |
| Woodlands | PO39 0FE |
| York Lane | PO39 0ER |
| York Road | PO39 0HB |
| PO39 0FH PO39 0JH |
Transport near Totland
-
Lymington Pier Station
-
Lymington Town Station
-
New Milton Station
-
Sway Station
-
Hinton Admiral Station
-
Brockenhurst Station
- FAQ
- Price Paid By Year
- Property Type Price
Frequently asked questions about Totland
What is the average price for a property for sale in Totland?
The average price for a property for sale in Totland is £355,632. There are 1,190 property listings for sale in Totland.
What streets have the most expensive properties for sale in Totland?
The streets with the most expensive properties for sale in Totland are Alum Bay New Road at an average of £738,500, Cliff Road at an average of £716,666 and Greenways at an average of £700,000.
What streets have the most affordable properties for sale in Totland?
The streets with the most affordable properties for sale in Totland are Broadway at an average of £173,363, Hurst Hill at an average of £185,000 and Lanes End at an average of £196,270.
Which train stations are available in or near Totland?
Some of the train stations available in or near Totland are Lymington Pier, Lymington Town and New Milton.
Property Price Paid in Totland by Year
The average sold property price by year was:
| Year | Average Sold Price | Price Change |
Sold Properties
|
|---|---|---|---|
| 2025 | £384,544 | 16% |
33 Properties |
| 2024 | £324,733 | -13% |
57 Properties |
| 2023 | £367,828 | 3% |
54 Properties |
| 2022 | £358,027 | -6% |
62 Properties |
| 2021 | £378,920 | 21% |
76 Properties |
| 2020 | £298,518 | 3% |
74 Properties |
| 2019 | £289,101 | 16% |
54 Properties |
| 2018 | £241,827 | -17% |
72 Properties |
| 2017 | £282,629 | 23% |
66 Properties |
| 2016 | £218,742 | -14% |
90 Properties |
| 2015 | £249,541 | 10% |
66 Properties |
| 2014 | £224,245 | -2% |
80 Properties |
| 2013 | £228,598 | 0,5% |
55 Properties |
| 2012 | £227,544 | 9% |
56 Properties |
| 2011 | £207,120 | -8% |
57 Properties |
| 2010 | £223,212 | -5% |
49 Properties |
| 2009 | £233,814 | -26% |
46 Properties |
| 2008 | £294,876 | 8% |
45 Properties |
| 2007 | £270,653 | 21% |
93 Properties |
| 2006 | £215,158 | 1% |
93 Properties |
| 2005 | £213,472 | -9% |
60 Properties |
| 2004 | £232,953 | 28% |
81 Properties |
| 2003 | £168,685 | 16% |
74 Properties |
| 2002 | £141,552 | 14% |
101 Properties |
| 2001 | £122,346 | 22% |
76 Properties |
| 2000 | £95,839 | 3% |
57 Properties |
| 1999 | £93,069 | 16% |
82 Properties |
| 1998 | £78,131 | 12% |
81 Properties |
| 1997 | £68,746 | -6% |
64 Properties |
| 1996 | £72,946 | 6% |
80 Properties |
| 1995 | £68,753 | - |
48 Properties |
Property Price per Property Type in Totland
Here you can find historic sold price data in order to help with your property search.
The average Property Paid Price for specific property types in the last three years are:
| Property Type | Average Sold Price | Sold Properties |
|---|---|---|
| Semi Detached House | £315,912.00 | 37 Semi Detached Houses |
| Detached House | £511,445.00 | 82 Detached Houses |
| Terraced House | £258,039.00 | 37 Terraced Houses |
| Flat | £201,708.00 | 50 Flats |

