
Houses for sale in Bybrook, Ashford
House Prices in Bybrook
Properties in Bybrook have an average house price of £318k and had 90 Property Transactions within the last 3 years¹.
Bybrook is an area in Ashford, Kent with 1,087 households², where the most expensive property was sold for £668k.
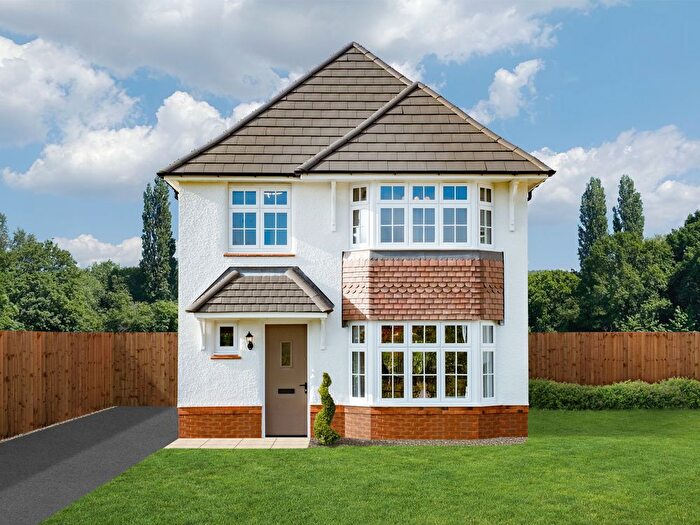
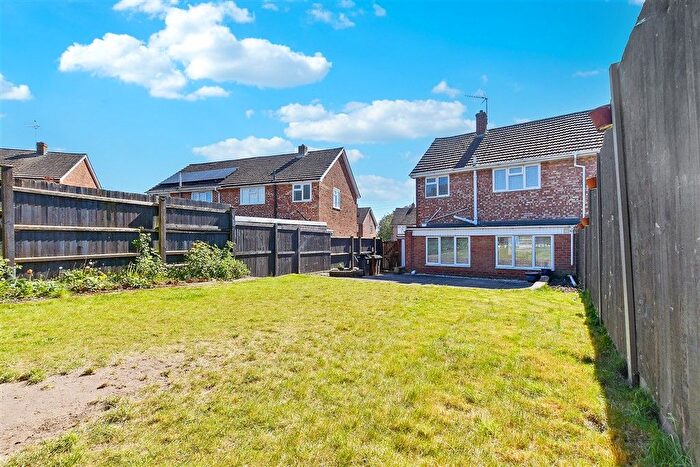
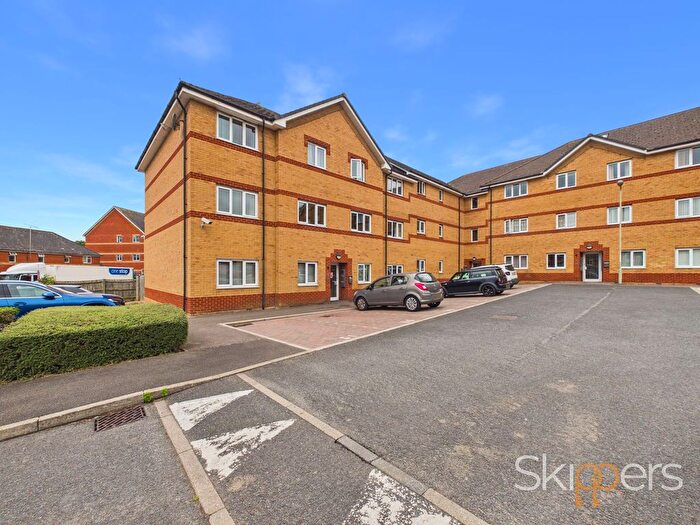
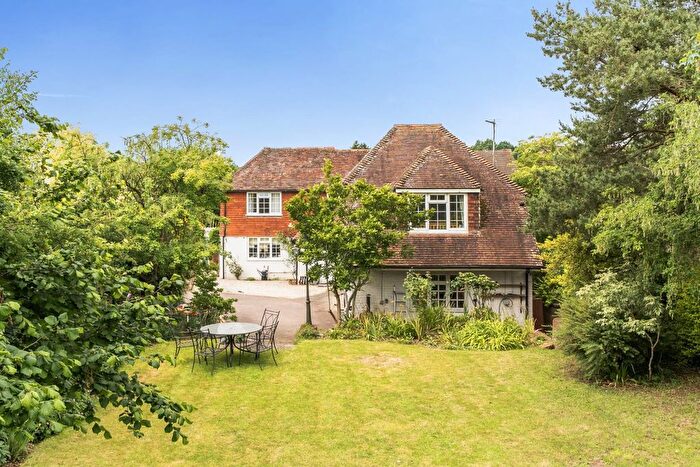
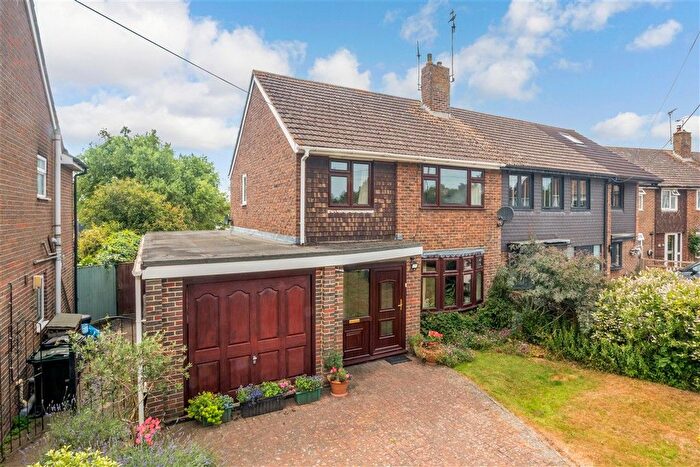
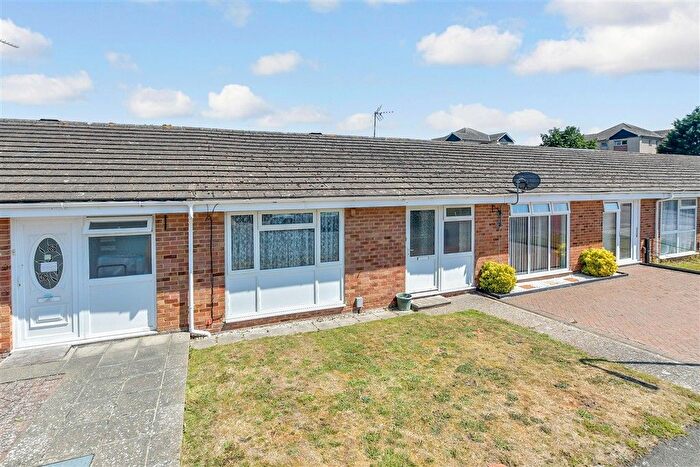
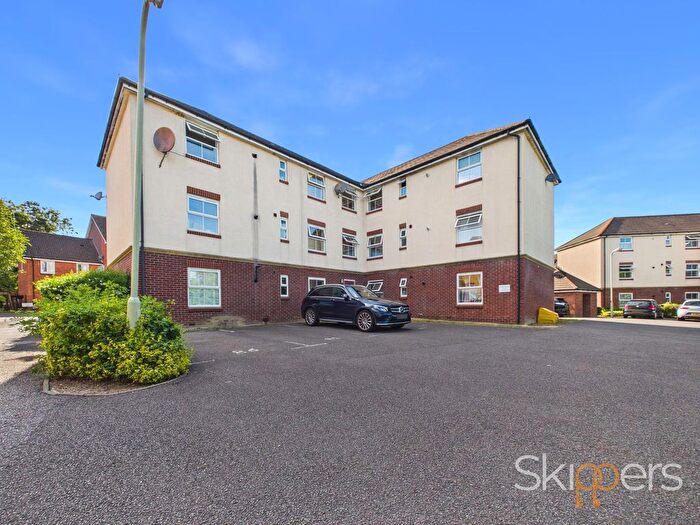
Properties for sale in Bybrook
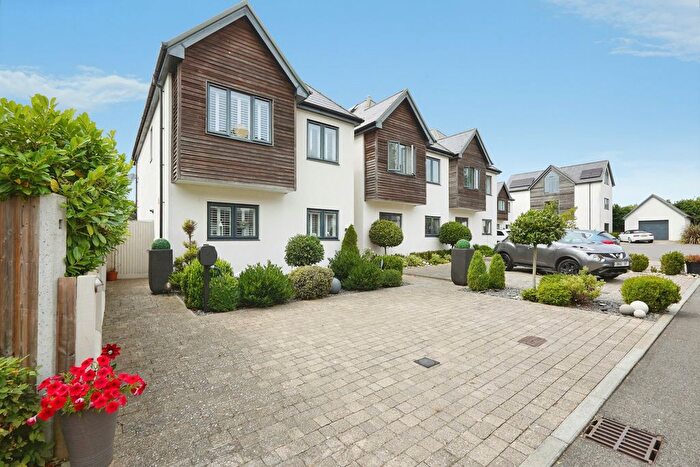
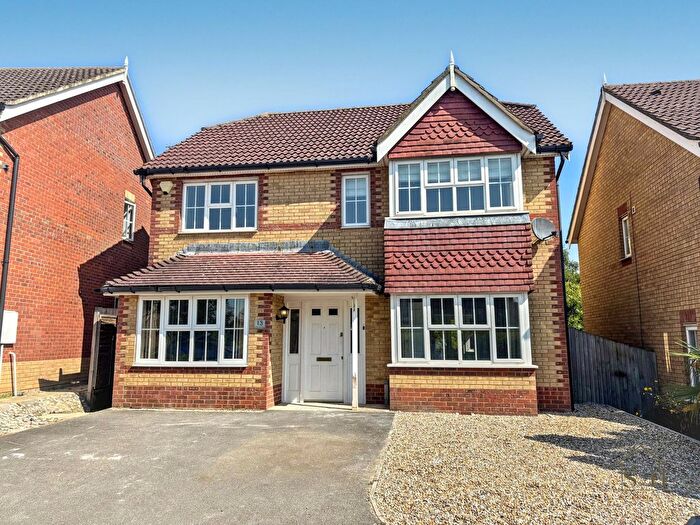
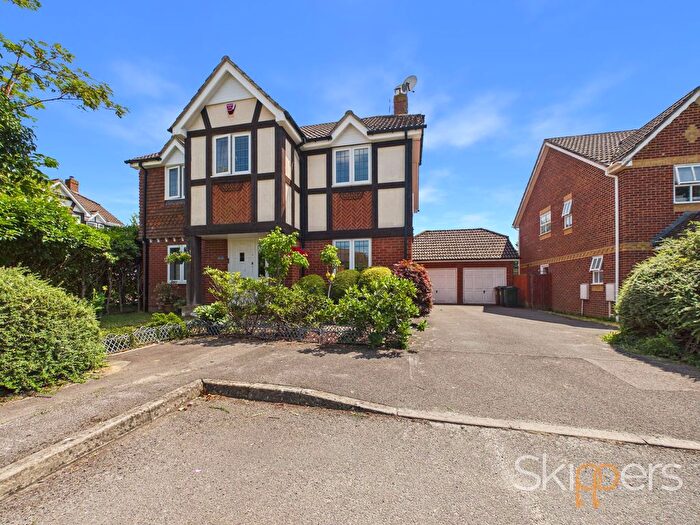
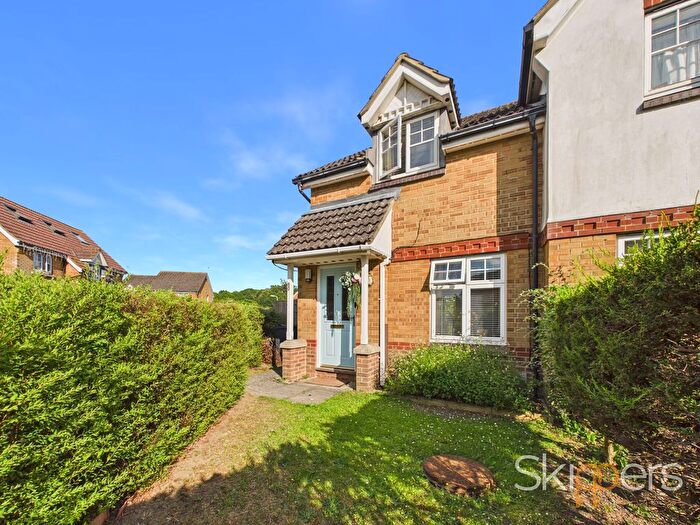
![]()
If you are looking to sell your house, let it out, or receive a property valuation, an expert can help you.
Click the button below to get started.
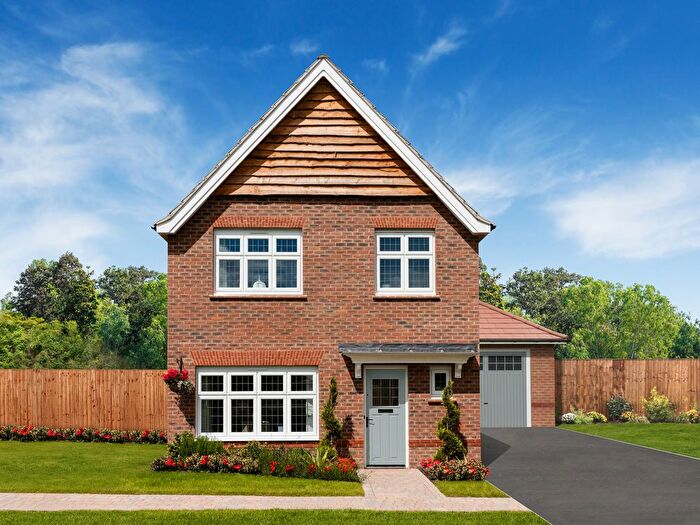
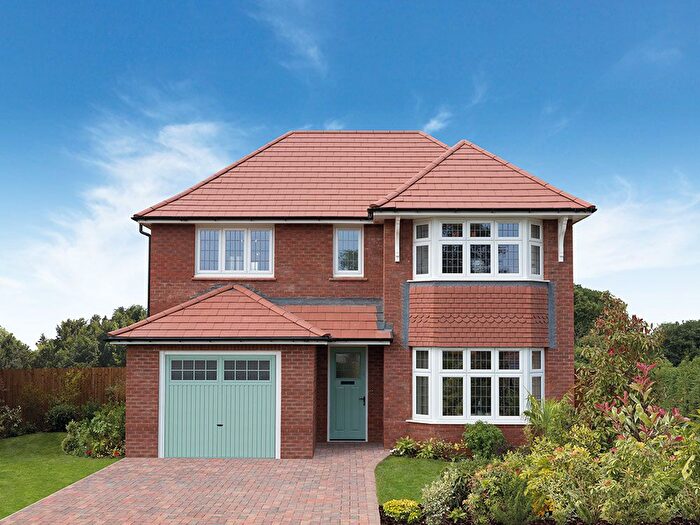

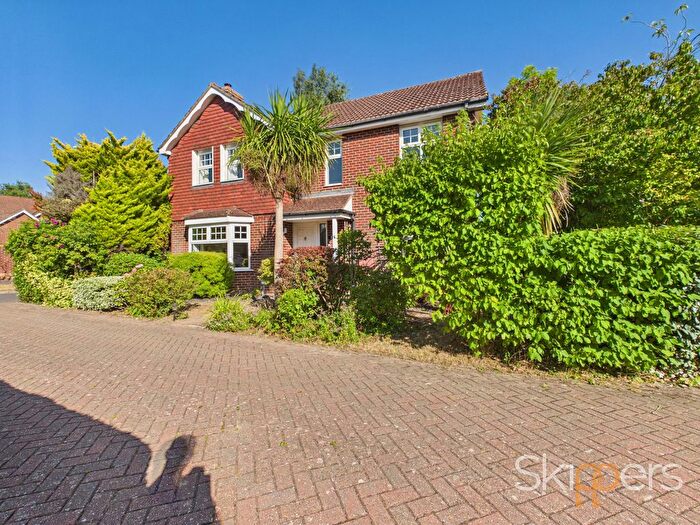
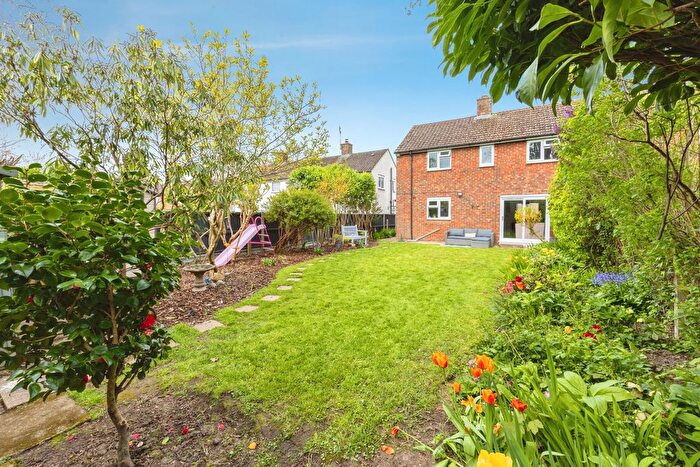
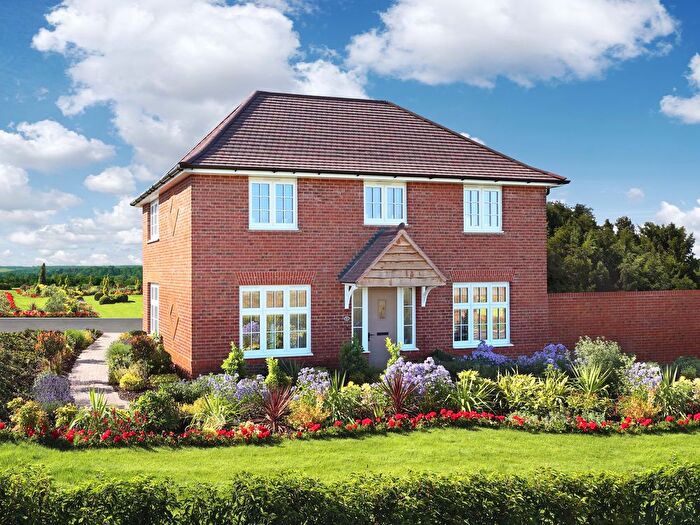
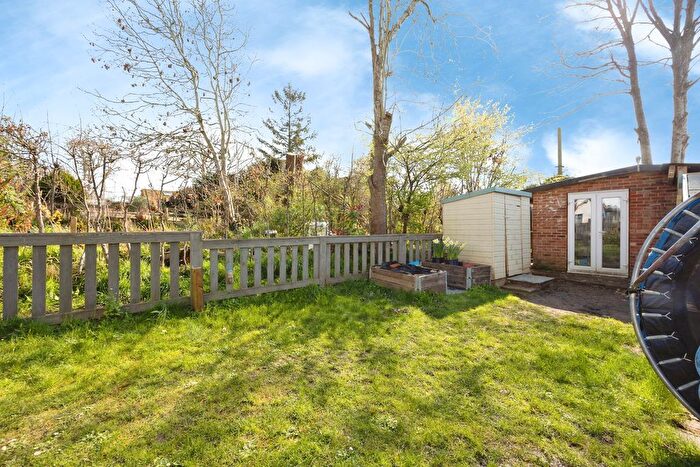
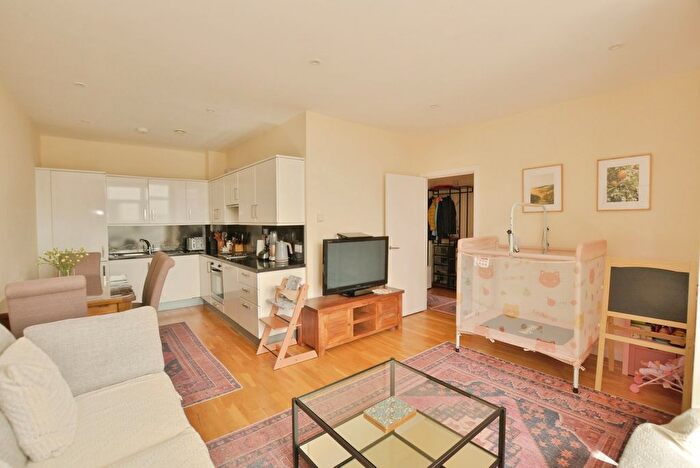
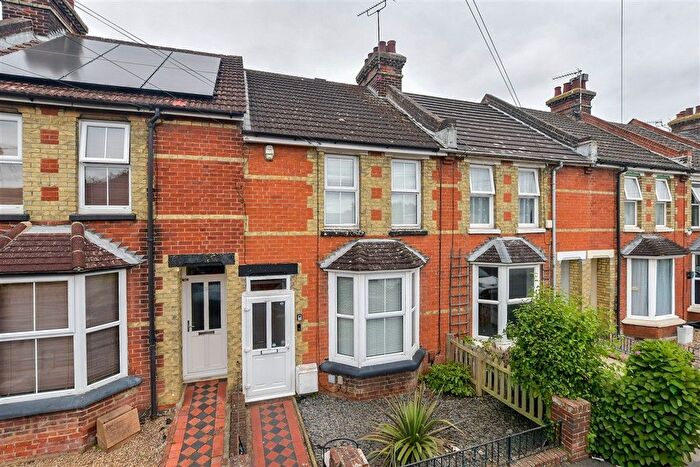
Previously listed properties in Bybrook
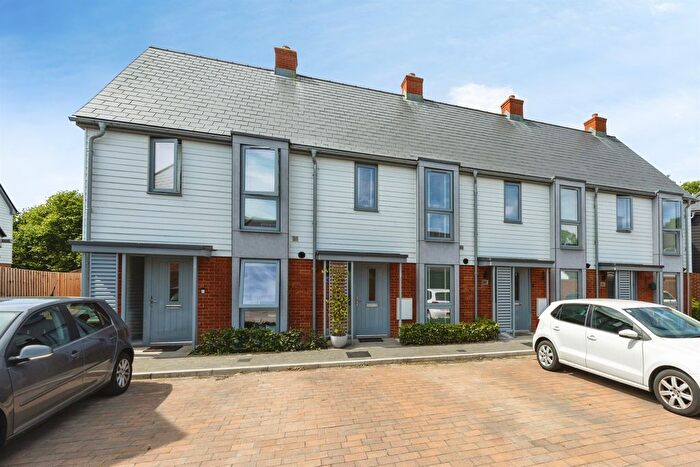
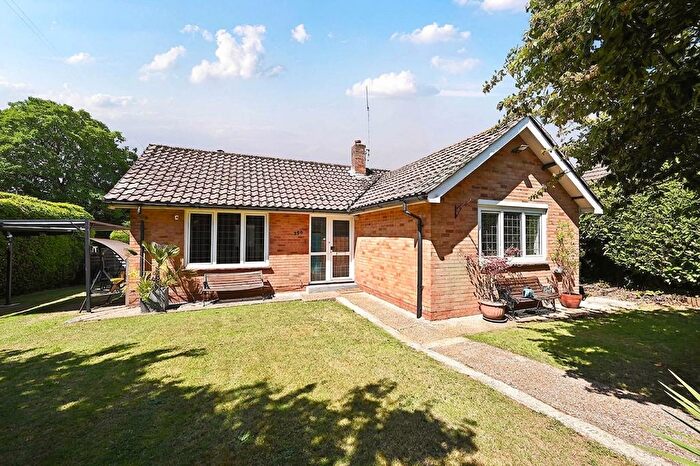
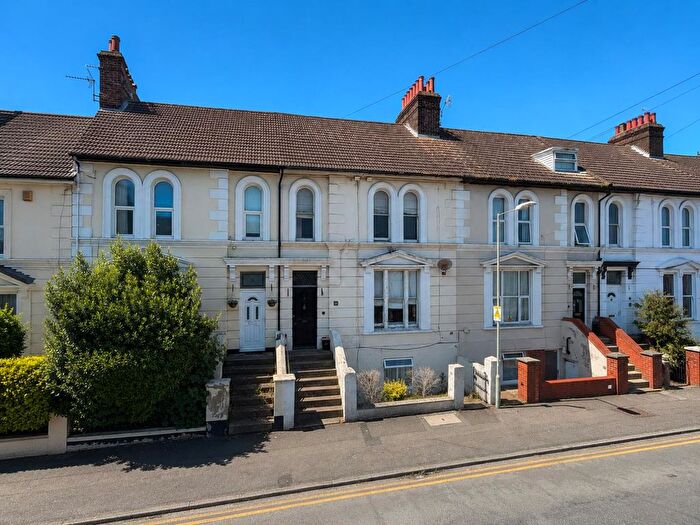
![]()
If you are looking to sell your house, let it out, or receive a property valuation, an expert can help you.
Click the button below to get started.
Roads and Postcodes in Bybrook
Navigate through our locations to find the location of your next house in Bybrook, Ashford for sale or to rent.
| Streets | Postcodes |
|---|---|
| Ashborne Close | TN24 9LX |
| Beauchamp Close | TN24 9ER |
| Belmont Road | TN24 9LS |
| Bockhanger Court | TN24 9JJ |
| Bybrook Court | TN24 9JX |
| Bybrook Road | TN24 9JA TN24 9JB TN24 9JD TN24 9JE TN24 9JF TN24 9JG TN24 9JH TN24 9JQ |
| Canterbury Road | TN24 8QE TN24 8QQ TN24 9QA TN24 9QB TN24 9QD TN24 9QE |
| Eythorne Close | TN24 9LP |
| Faversham Road | TN24 9DB TN24 9DF |
| Greenbank | TN24 9NJ |
| Kingswood | TN24 9LB |
| Kinneys Lane | TN24 9RD |
| Midsummer Hill | TN24 9NL |
| Nine Acres | TN24 9JL TN24 9JN TN24 9JP TN24 9JR TN24 9JS TN24 9JW |
| Northumberland Avenue | TN24 9QF TN24 9QG |
| Oakfield Road | TN24 9LL |
| Old School Mews | TN24 9ES |
| Park Road | TN24 9DJ TN24 9DL TN24 9HQ |
| Park Vale | TN24 9NH |
| Rylands Road | TN24 9LH TN24 9LJ TN24 9LN TN24 9LR TN24 9LU |
| Shaw Cross | TN24 9JY |
| Tadworth Road | TN24 9JT TN24 9JU TN24 9LA |
| The Pasture | TN24 9LY TN24 9LZ TN24 9ND |
| Tudor Byway | TN24 9DP |
| Tudor End | TN24 9DR |
| Tudor Road | TN24 9DN |
| Underwood Close | TN24 9LT |
| York Road | TN24 9QQ |
Property price trends in Bybrook
According to the latest Land Registry data, the average home in Bybrook sold for £625,000 in 2026. That figure comes from 1,223 sales logged over the past 31 years.
Prices have continued to climb over the last three years. Compared with 2023, when the typical sale came in around £300,775, that's a rise of roughly 107.8%.
Looking back five years, average prices are up about 98.5% since 2021, a gain of around £310,146 in cash terms.
Zoom out to the past decade for the fuller picture. Back in 2016, homes here averaged £230,447, so the typical sold price has climbed about 171.2% since then, roughly 10.5% a year. Stretch the view to fifteen years and that annual pace eases back to about 9.6%.
Frequently asked questions about Bybrook
What is the average price for a property for sale in Bybrook?
The average price for a property for sale in Bybrook is £318,010. This amount is 13% lower than the average price in Ashford. There are 974 property listings for sale in Bybrook.
What streets have the most expensive properties for sale in Bybrook?
The streets with the most expensive properties for sale in Bybrook are Old School Mews at an average of £505,000, Midsummer Hill at an average of £493,500 and Park Road at an average of £457,500.
What streets have the most affordable properties for sale in Bybrook?
The streets with the most affordable properties for sale in Bybrook are Nine Acres at an average of £225,441, Oakfield Road at an average of £270,000 and Bybrook Road at an average of £272,142.
Which train stations are available in or near Bybrook?
Some of the train stations available in or near Bybrook are Ashford International, Wye and Charing.
Property Price Paid in Bybrook by Year
The average sold property price by year was:
| Year | Average Sold Price | Price Change |
Sold Properties
|
|---|---|---|---|
| 2026 | £625,000 | 48% |
1 Property |
| 2025 | £321,955 | 1% |
34 Properties |
| 2024 | £320,266 | 6% |
26 Properties |
| 2023 | £300,775 | -14% |
29 Properties |
| 2022 | £343,090 | 8% |
22 Properties |
| 2021 | £314,854 | 15% |
55 Properties |
| 2020 | £269,014 | 1% |
32 Properties |
| 2019 | £266,902 | -1% |
39 Properties |
| 2018 | £270,756 | -8% |
39 Properties |
| 2017 | £291,182 | 21% |
52 Properties |
Property Price per Property Type in Bybrook
Here you can find historic sold price data in order to help with your property search.
The average Property Paid Price for specific property types in the last three years are:
| Property Type | Average Sold Price | Sold Properties |
|---|---|---|
| Semi Detached House | £317,520.00 | 50 Semi Detached Houses |
| Detached House | £466,250.00 | 12 Detached Houses |
| Terraced House | £274,708.00 | 24 Terraced Houses |
| Flat | £139,229.00 | 4 Flats |
